Vaccination intentions generate racial disparities in the societal persistence of COVID 19 - Nature
←
→
Page content transcription
If your browser does not render page correctly, please read the page content below
www.nature.com/scientificreports
OPEN Vaccination intentions generate
racial disparities in the societal
persistence of COVID‑19
Yanchao Wang1,9, Alina Ristea2,3,9, Mehrnaz Amiri2,3, Dan Dooley4, Sage Gibbons2,3,
Hannah Grabowski5,6, J. Lee Hargraves5, Nikola Kovacevic5, Anthony Roman5,
Russell K. Schutt6,7, Jianxi Gao8, Qi Wang1,3* & Daniel T. O’Brien2,3*
We combined survey, mobility, and infections data in greater Boston, MA to simulate the effects
of racial disparities in the inclination to become vaccinated on continued infection rates and the
attainment of herd immunity. The simulation projected marked inequities, with communities of color
experiencing infection rates 3 times higher than predominantly White communities and reaching
herd immunity 45 days later on average. Persuasion of individuals uncertain about vaccination was
crucial to preventing the worst inequities but could only narrow them so far because 1/5th of Black and
Latinx individuals said that they would never vaccinate. The results point to a need for well-crafted,
compassionate messaging that reaches out to those most resistant to the vaccine.
Ever since the World Health Organization declared COVID-19 to be a global pandemic on 11 March 2020,
vaccination has been the light at the end of the tunnel. Following an unprecedented development effort by the
biotech industry, the first vaccines became available in some countries for health-care workers and the most
at-risk in winter 2020–2021. The United States, United Kingdom, and many other nations began to distribute
vaccines to high-risk groups shortly thereafter and then extended distribution to the general public in the spring.
This process is intended to curtail the rate of infection and is hoped to eventually eliminate infections by creating
herd immunity. But an available vaccine does not automatically create herd immunity. If a sufficient fraction of
the population does not choose to be vaccinated1, 2, substantial numbers of people will remain susceptible and
infections will persist.
A series of surveys in late 2020 revealed that ~ 30–40% of Americans were hesitant to get vaccinated against
COVID-193–5; this mirrors results in other c ountries6–10. Some respondents were worried about receiving a
vaccine before seeing more widespread evidence that it is effective and has few side-effects5, 7, 9. For example, a
December 2020 KFF COVID-19 Vaccine Monitor survey reported that among the 27% of the U.S. population
likely to not get the vaccine, 59% were worried about side effects and 55% did not trust the government to make
sure that the vaccine is safe and e ffective11. Others stated that they are opposed to being vaccinated altogether,
following a growing trend in American society to reject vaccines as having dangerous side effects12, 13. Resist-
ance to COVID-19 vaccination is particularly pronounced among Black Americans, who cite a long history of
discrimination and mistreatment at the hands of medical p rofessionals14, 15.
The various objections to vaccination and their uneven distribution across communities have posed a major
challenge for the pursuit of vaccine-based herd immunity. Of particular concern, differences between communi-
ties in willingness to be vaccinated will multiply the risks faced by residents and reduce the chances of achiev-
ing herd immunity locally for all. Specifically, if too few Black and Latinx individuals choose to be vaccinated,
communities with many Black and Latinx residents will remain vulnerable to infection at disproportionate rates
while communities that are predominantly White and Asian approach herd immunity. Such a disparate result
would be yet another racial inequity in a pandemic that has already had a glaringly disparate impact on health
1
Department of Civil and Environmental Engineering, Northeastern University, Boston, MA 02120, USA. 2School of
Public Policy and Urban Affairs, Northeastern University, Boston, MA 02120, USA. 3Boston Area Research Initiative,
Northeastern University, Boston, MA 02120, USA. 4Boston Public Health Commission, Boston, MA 02118,
USA. 5Center for Survey Research, University of Massachusetts Boston, Boston, MA 02125, USA. 6Department of
Sociology, University of Massachusetts Boston, Boston, MA 02125, USA. 7Beth Israel Deaconess Medical Center,
Boston, MA 02215, USA. 8Department of Computer Science, Rensselaer Polytechnic Institute, Troy, NY 12180,
USA. 9These authors contributed equally: Yanchao Wang and Alina Ristea. *email: q.wang@neu.edu; d.obrien@
neu.edu
Scientific Reports | (2021) 11:19906 | https://doi.org/10.1038/s41598-021-99248-2 1
Vol.:(0123456789)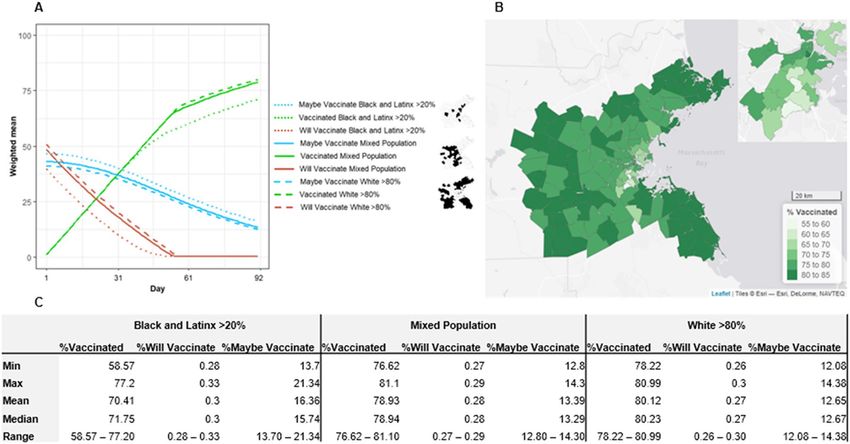
www.nature.com/scientificreports/
Figure 1. Representation of variations in vaccine intentions. (A) Individuals vary in their intentions to receive
the vaccine by ethnicity. When combined with (B) the categorization of communities by predominantly White
(> 80%), high Black–Latinx (> 20%), or other, these disparities translate into geographic differences in the
proportion who definitely will not vaccinate. (Made in R Studio V.1.4. http://www.rstudio.com/).
and finances in Black and Latinx c ommunities16–20. Further, communities are not islands unto themselves, and
intermixing through the daily movements of individuals have been critical in explaining infection transmission
across regions21–26. As such, if any community in a region fails to achieve a sufficient level of vaccination, it could
harbor infections that still pose a risk to unvaccinated individuals in other communities through mobility-based
transmission.
The current study evaluates the inequities that might arise from differential willingness to be vaccinated
across a single metro region. We use a traditional SIR (susceptibility–infection–recovery) model for simulating
the evolution of an infectious disease within a community, applied across the ZIP codes of Boston, MA, and the
surrounding municipalities in the greater Boston area (collectively referred to as “communities” from hereon). We
further inform these models using mobility data generated by cell phones to track how movement between com-
munities could further spread the disease21–26. We incorporate into these models an additional set of parameters
for the gradual rollout of a vaccine, which removes individuals from a community’s susceptible population at an
assumed rate of effectiveness, based on clinical trials27. We simulate the vaccination rollout as if it had occurred
October-December, 2020. This matches the proposed 3-month vaccination process for the general population
that many leaders promised in early 2021 and allows us to leverage historical mobility and infections data and,
as has been demonstrated by other simulation studies of vaccination28, permits us a clear counterfactual against
which we can compare the introduction of vaccination.
The study is designed to address four main research questions, each of which is relevant to the initial vaccina-
tion rollout for COVID but can also be generalized to future vaccination rollouts for this or other pandemics.
First, we simulate both the global and community-specific rollout of vaccines, revealing at what point the process
would be expected to hit a “bottleneck,” where supply outstrips willing recipients, and whether this milestone
arrives at different times across communities. This will be crucial to leaders seeking to manage vaccine supply.
Second, we quantify the anticipated impact of racial differences in vaccination hesitancy, which are largely
attributable to historical inequities in medical treatment. To do so we use results from three recent surveys that
separated responses by race to approximate willingness to vaccinate in each community. Third, there is evidence
that those who are uncertain about receiving a new medical procedure, including vaccinations, often wait until
others that they know have done so with few negative side e ffects29–31. In order to examine both the impact and
limitations of this process, we include a “persuasion” rate (or “imitation” f actor32, 33) by which individuals who
were uncertain if they would get vaccinated can eventually decide to do so as the proportion of those vaccinated
in their community increases. Fourth, a major concern is that slow uptake of vaccination in one community can
undermine herd immunity in neighboring areas via mobility-based exposure. Here we will be able to evaluate
this proposition.
Results
Vaccination. In three independent surveys of Boston and Massachusetts residents in the fall of 2020, 49.6%
of respondents said that they planned to get the COVID-19 vaccine, and 8.8% said that they did not; the remain-
ing 41.6% were uncertain. These responses featured prominent disparities by race, however. On the low end,
6.6% of White respondents and 1.8% of Asian respondents said they would definitely not get the vaccine, com-
pared to 21.7% of Black and 20% of Latinx respondents (see Fig. 1A). We combined these ratios with the racial
composition of communities to estimate the percentage of residents in each who planned to get vaccinated, did
not plan to, and who were uncertain. This revealed stark differences across communities, with municipalities in
the region varying between 33.9 and 54.1% of the population saying they would definitely get vaccinated, and
Scientific Reports | (2021) 11:19906 | https://doi.org/10.1038/s41598-021-99248-2 2
Vol:.(1234567890)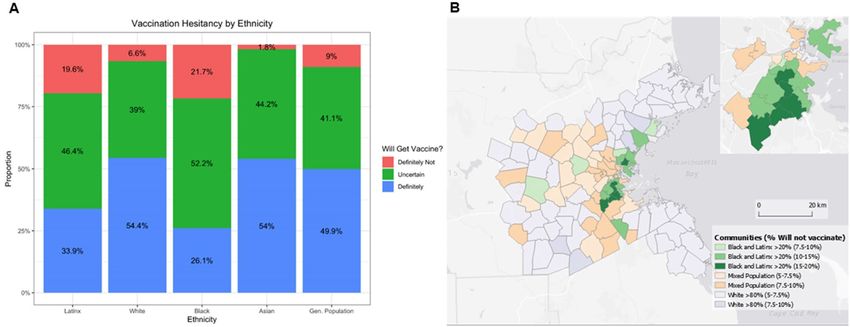
www.nature.com/scientificreports/
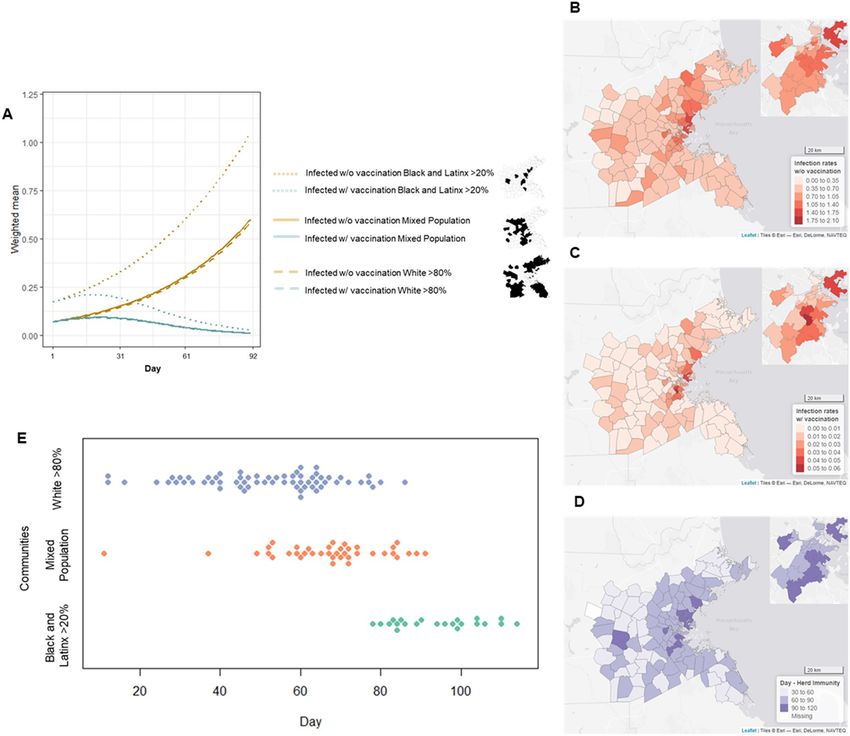
Figure 2. Vaccination rates varied across communities throughout the simulation. (A) Growth curves of
the percentage of residents intending to vaccinate, will maybe vaccinate, and have been vaccinated across the
3-month simulation, broken out by communities that are predominantly White, high Black–Latinx, and other.
These different curves resulted in disparities across communities in (B) the total percentage of those vaccinated
at the end of the simulation. (C) Shows the disparities at the end of the modeling process. (Made in R Studio
V.1.4. http://www.rstudio.com/).
between 5.4 and 17.2% saying they definitely would not; the same ranges indicated slightly less receptivity of
vaccines in Boston’s ZIP codes, which has a higher Black and Latinx population than most surrounding munici-
palities (definitely will: 28.2–52.1%; definitely will not: 5.1–19.8%; sees Fig. 1B, Figure S1a–c).
We simulated the impact of vaccination across communities by incorporating it into an SIR-mobility model
with parameters approximating transmission and recovery rates based on actual case numbers for October-
December 2020. We also assume the 95% efficacy of the vaccine reported by the initial clinical trials27 and that
vaccination will occur at the rate of 8.25% of the population per week, following the goal of complete vaccination
over a 12-week (3-month) period. The model also allowed for those uncertain about the vaccine to be persuaded,
contingent on the likelihood of seeing others in their neighborhood who had been vaccinated and presumably
not seen adverse side e ffects31. To maintain a true counterfactual, all comparisons of outcomes are made against
the results of the same model without vaccination as a facsimile for the actual events of this time period.
Figure 2A depicts a steady increase over the 3-month period in the proportion of people who were vac-
cinated across the region, reaching 75%. In late November, however, the vaccination process hit a bottleneck
(mean = 53 days into simulation). It had exhausted all individuals who either were willing to be vaccinated at the
outset or were persuaded to that point, as indicated by the blue line reaching zero. As a result, vaccination from
then on was dependent on those additional individuals who were persuaded in each week, which was less than
the rate at which vaccination was possible. This created the kink in the red line, indicating a slowed vaccination
process from that point on, explaining why the simulation did not successfully vaccinate 100% of the population
after 12 weeks, despite having the capacity to do so.
The bottleneck in vaccination did not occur at the same time in all communities (see Fig. 2B,C). For purpose
of comparison here and moving forward, we divide communities into those that are predominantly White (> 80%
White residents; 51% of communities), those with high Black–Latinx populations (> 20% Black and Latinx resi-
dents; 17% of communities), and those that are neither (32% of communities). For predominantly White com-
munities, the bottleneck was reached at the very end of November (mean = 57th day). Meanwhile, in communities
with high Black–Latinx populations the same milestone occurred before November 15th (mean = 42nd day).
Because this date was reached earlier, the lower proportion of vaccinated residents at that time in turn resulted
in a diminished power of persuasion, meaning fewer additional people were persuaded each week thereafter
than in predominantly White communities. This further exacerbated disparities in cumulative vaccinations. By
the end of the simulation, residents in predominantly White communities were consistently 80% vaccinated
whereas those living in high Black–Latinx populations were 71% vaccinated, though there were communities
with rates of vaccination as low as 59%.
Infection rates. The impacts of vaccination, including disparities in uptake across communities, were evi-
dent in the corresponding evolution of infection rates. As shown in Fig. 3A, infection rates kept pace with the no-
vaccination scenario until mid-October, which is when vaccination began to substantially lower the population
Scientific Reports | (2021) 11:19906 | https://doi.org/10.1038/s41598-021-99248-2 3
Vol.:(0123456789)www.nature.com/scientificreports/
Figure 3. Vaccination rates varied across communities throughout the simulation. (A) Growth curves of
the percentage of residents intending to vaccinate, will maybe vaccinate, and have been vaccinated across the
3-month simulation, broken out by communities that are predominantly White, high Black–Latinx, and other.
These different curves resulted in disparities across communities in (B) the total percentage of those vaccinated
at the end of the simulation, (C) infection rates at the end of the modeling process, (D) and the day when herd
immunity was reached, while (E) shows a graphic representation of when communities reached herd immunity.
(Made in R Studio V.1.4. http://www.rstudio.com/).
susceptible to infection. Over the following week or so, infection rates started to decrease, eventually nearing
zero infections. To wit, 99% of communities had more than one case per 100 without vaccination, whereas no
community was above 0.75 cases per 100 with vaccination.
The growth curve for infection rates under vaccination was consistent across communities of different racial
composition, though with some noteworthy variations. First, the absolute drop in infection rates with vaccina-
tion was greater in communities of color, seemingly because they had much higher levels of infection in the
no-vaccine scenario. In other words, vaccination held the greatest absolute benefit for communities harder hit
by the virus. The second difference, however, was how close they came to herd immunity. Predominantly White
communities nearly reached zero infections (3rd quartile = 0.10 cases per 100 residents). Meanwhile, communi-
ties with high Black–Latinx populations failed to reach this point, averaging 0.27 infections per 100 residents at
the end of the simulation (Fig. 3A–C).
A series of linear regression models confirmed the racial disparities in infection rates under the vaccination
scenario (see Table 1 for all parameters). Communities with greater Black and Latinx populations had higher
infection rates at the conclusion of the simulation (% Black: B = 0.30, p < .001; % Latinx: B = 0.54, p < .001). Even
when we controlled for expected infection rates, as drawn from the no-vaccine scenario, these racial disparities
persist, meaning that differential uptake of the vaccine played a consequential role in cross-community variations
in infection (% Black: B = 0.26, p < .001; % Latinx: B = 0.26, p < .001).
Scientific Reports | (2021) 11:19906 | https://doi.org/10.1038/s41598-021-99248-2 4
Vol:.(1234567890)www.nature.com/scientificreports/
Unstand. beta Unstand. beta Unstand. beta Unstand. beta
(S.E.) β (S.E.) β (S.E.) β (S.E.) β
Exp. infectionsa – – 0.02*** (0.001) 0.53 – – 0.02*** (0.001) 0.61
% Black 0.30*** (0.03) 0.42 0.26*** (0.01) 0.37 0.26*** (0.03) 0.36 0.28*** (0.01) 0.39
% Latinx 0.54*** (0.04) 0.63 0.26*** (0.02) 0.30 0.50*** (0.04) 0.58 0.23*** (0.02) 0.27
% Asian − 0.05 (0.04) − 0.04 − 0.07*** (0.02) − 0.06 − 0.10* (0.04) − 0.09 − 0.05* (0.02) − 0.04
Mobility-based
– – – – 0.02*** (0.004) 0.22 − 0.01*** (0.002) − 0.10
exposureb
Table 1. Parameter estimates from regression equations using demographic composition, mobility-based
exposure, and expectations from the no-vaccine scenario to predict infection rates at the end of the vaccination
simulation. For 128 communities, defined as the municipalities of the greater Boston region and the ZIP codes
within Boston. *p < .05; ***p < .001. a Based on rates in the no-vaccine scenario. b Potential exposure to infection
transmission via movement between communities, as derived from the model parameters.
Achieving herd immunity. Moving beyond infection rates, did communities reach the goal of herd immu-
nity via vaccination? We defined herd immunity as the point at which a community effectively eliminated the
virus locally (i.e., < 1 infection; the model permits fractions of infections). We found that only 27% of communi-
ties had reached herd immunity by this definition at the end of the simulation. We thus extended the simulation
for three additional months (simulating mobility based on historical data; see Methods for more). An additional
52% of communities achieved herd immunity in the fourth month of the extended simulation (80% cumula-
tive), and all but one remaining community achieved herd immunity in the fifth month, which reached it shortly
thereafter (see Fig. 3D,E). The average community reached herd immunity on day 103 of the simulation.
Differences in achieving herd immunity again reflected stark disparities by race. Only 14% of communities
with high Black–Latinx populations saw herd immunity before the fifth month of the simulation, whereas 99%
of predominantly White communities had achieved herd immunity by this time. To reiterate, all predominantly
White communities achieved herd immunity before any community with a high Black–Latinx population, some
by nearly 2 months. The average difference in achieving herd immunity between these two sets of communities
was 45 days (89 days and 134 days into the simulation).
Mobility‑based exposure. Mobility-based exposure—that is, the quantification of a community’s poten-
tial exposure to infection via cross-community travel—has been a central component of models of the trans-
mission of COVID21–26 and we included it in our own. Unsurprisingly, when added to the previous regressions,
mobility-based exposure in a community at the end of the simulation independently predicted higher infection
rates, albeit with an effect size considerably lower than those of racial composition (β = 0.22, p < .001; see Table 1
for all parameters). The inclusion of mobility-based exposure in the model did not meaningfully alter the effects
of race. However, when we controlled for infection rates in the no-vaccine scenario, mobility-based exposure
had a negative effect on infection rates under vaccination (β = − 0.10, p < .001). This would appear to be because
vaccination especially benefited those who were more at risk from either baseline or dynamic exposure. This
would all indicate that mobility-based exposure had a moderate effect on continued infections, though it played
a much smaller role relative to vaccination in determining infection trends. As a final test of this interpretation,
we ran a model using only percentage vaccinated and mobility-based exposure to explain infection rates, and
found that the effect of the former was four times the size of the effect of the latter (β = − 0.78 vs. β = 0.21, both
p values < .001).
If mobility-based exposure and vaccination are each relevant to the evolution of infections, the question
remains how often these two factors coincide, making certain communities doubly vulnerable. We find that
mobility-based exposure correlated moderately with the proportion of Black and Latinx residents (% Black:
r =0. 23, p < 0.01; % Latinx: B = 0.23, pwww.nature.com/scientificreports/
Figure 4. Disparity across simulations. Parameter estimates (unstandardized betas, standard errors, and
standardized betas) from regression equations meta-analyzing the indicators of disparity from across
simulations with different levels of persuasion, vaccine efficacy, and rollout rate.
itself (i.e., relative to the no-vaccine scenario). Vaccine efficacy had little effect on disparities in reaching herd
immunity, however. This was likely because less effective vaccines will extend the timeline to herd immunity for
everyone, but the burden of allowing infections to persist will fall heaviest on those communities experiencing
the most exposure. Last, a quicker rollout rate led to greater disparities when controlling for infections in the no-
vaccination scenario and differences in the average date of reaching herd immunity. This is likely because high
Black–Latinx communities reach the vaccination bottleneck sooner and thus fall behind their predominantly
White counterparts at a faster rate. It is important to note, however, that the absolute outcomes were better for
everyone under this scenario. Last, a faster rollout led to lower disparities in the raw infection rate for the Latinx
population, but this appeared to attributable to the higher starting infection rate and mobility-based exposure
in these communities, making a quick rollout especially valuable.
As we describe these differences across simulations, we must take into account their practical implications.
The strength of persuasion is the most important component in the models, and it cuts both ways. If we remove
persuasion entirely, 97% of predominantly White communities reach herd immunity in the 180-day simulation,
with an average of 121 days, whereas no high Black–Latinx communities do. However, its power to eliminate
disparities seems limited. When we increased the rate of persuasion by 50% from the baseline model, the average
high Black–Latinx community saw herd immunity only 9 days earlier, while predominantly White communities
saw an even smaller improvement of 3 days. This closed the gap between the two by only 14%. This indicates
that even if individuals uncertain about getting vaccinated are convinced to do so more quickly, the proportion
Scientific Reports | (2021) 11:19906 | https://doi.org/10.1038/s41598-021-99248-2 6
Vol:.(1234567890)www.nature.com/scientificreports/
of people committed to being vaccinated at the outset and, conversely, the proportion committed to not being
vaccinated, are far more consequential in determining the timeline of reaching herd immunity.
Discussion
The simulation found that the introduction of vaccinations helped all communities. Disparities, however, between
predominantly White communities and communities of color emerged early and worsened as the simulations
proceeded, the details of which answered each of our four research questions. First, communities quickly reached
a bottleneck in vaccination, at which point further vaccination relied entirely on continued persuasion. Because
communities with more Black and Latinx residents had fewer people who were initially willing to be vaccinated,
they reached this bottleneck weeks before predominantly White communities. Second, the disparities in vac-
cination rates set the stage for inequities in infection rates. Communities of color experienced average rates of
infection 3 times as high as predominantly White communities and reached herd immunity on average a month-
and-a-half later. Third, we found that persuasion is crucial to closing the infection gaps between communities of
different racial backgrounds. Unfortunately, however, increasing the power of persuasion had limited additional
effect because of the large number of people saying they would definitely not get vaccinated in communities
of color. Fourth, mobility-based exposure had only a moderate impact during vaccination, meaning that lower
adoption of vaccines in some communities did not heavily undermine herd immunity in surrounding areas.
We proceed by elaborating on the insights from each research question in greater detail, but we must note
that much has happened since the beginning of the vaccination program and the original execution of this study.
Vaccination programs have been successfully administered nationwide, verifying much of what the simulations
predicted. We conducted a posthoc analysis using data published by the Massachusetts Department of Public
Health (weekly data available at https://www.mass.gov/info-details/massachusetts-covid-19-vaccination-data-
and-u pdate s#w
eekly-c ovid-1 9-m
unici palit y-v accin
ation-d
ata-) and found that our estimated rates of vaccination
by community correlated substantially with those reported on August 26, 2021 (r = .0.53). This is noteworthy
because our analysis relied solely on race and ethnicity. In fact, the simulation results mapped almost perfectly
onto correlations between actual vaccination rates and the racial composition of communities, the only deviation
being that we underestimated the willingness (or willingness to be persuaded) to be vaccinated among Asian
and Asian American residents (correlations of indicators of ethnic composition with residual variance in actual
vaccination rates not predicted by our simulations: % Asian: r = 0.24, pwww.nature.com/scientificreports/
If one follows the logic of taking those that say they will never get vaccinated at their original word for Boston,
1 in 5 Black and Latinx residents would never be vaccinated. This would pose a large stumbling block to achiev-
ing herd immunity for communities of color. Though we have estimated herd immunity as the first moment at
which there are no infections in a community, there could still be pockets of low vaccination with concomitant
gaps in the protective wall of community health36. That said, vaccine hesitancy is not synonymous with vaccine
denial, which questions efficacy and propagates potential harms from vaccines37. With luck, some of those who
are rejecting the idea of being vaccinated now are more hesitant than they are deniers, and they will be receptive
to increased evidence of the vaccine’s effectiveness and safety. Thus, the solution is not only to increase the rate
at which people on the fence decide to be vaccinated; it is in convincing those steadfastly opposed to the vac-
cination to consider it. This has only become more critical since vaccine rollout began as misinformation has
steadily undermined efforts to reassure those who are h esitant38.
Our fourth research question regarded the implications of lower vaccine adoption in some communities for
the surrounding region. Namely, could lower adoption in one or more communities undermine the pursuit of
herd immunity in surrounding communities? This would seem plausible given the known importance of cross-
community mobility for transmission of the v irus21–26. We find here a mixed answer. Indeed, mobility-based
exposure continued to predict infection rates, though with a strength far smaller than that of vaccination adop-
tion. This is consistent with other work that has found that the importance of mobility has been largely supplanted
by the impact of interventions intended to mitigate transmission of the virus, whether they be social distancing
guidelines in the summer of 2020 or, in this case, vaccine rollouts39. As such, the ability of a community with
lower vaccine adoption to impact other communities around it appears to have been limited under the assump-
tions of the model (though see below for more on the implications of the Delta variant).
There are a number of limitations to the model and its implications arising from assumptions we were forced
to make. First, we did not account for any first-stage rollout to first responders, frontline workers, and the most at-
risk, which was anticipated to reach ~ 10–15% of the population. This would accelerate herd immunity by raising
the baseline level of vaccination and kick-starting persuasion. Second, we assumed that vaccinated individuals
cannot carry the virus. When this study was originally conducted, there was little evidence one way or the other
as to whether this was the case, though this has now changed with the emergence of the Delta variant. Third, our
simplistic model of persuasion ignores the power of leadership, which is argued to be as critical in communities
of color as seeing one’s neighbors be vaccinated40. Fourth, the reproduction rate of the virus remained stable
throughout the simulation, but there are reasons to believe that vaccination leads to behavioral shifts that will
increase the underlying reproduction rate even if vaccines themselves limit the total i mpact41. Our estimates of
infection rates and the timeline to herd immunity could be somewhat optimistic in that case. Fifth, the model
treats vaccination access as being evenly distributed across communities, whereas numerous analyses have
found lower numbers of vaccination sites in communities of color in multiple U.S. cities, especially in southern
states42, 43. All of these dynamics could alter the specific quantitative results we see here and the timeline to herd
immunity. That said, given the variety of robustness tests that we have run, we are confident saying that in any
of these scenarios there will be extensive inequities in infection rates and the time elapsed before achieving herd
immunity between predominantly White and Asian communities and Black and Latinx communities—and that
some of these nuances would only exacerbate outcomes.
We conclude by noting the new shape the pandemic has taken in the months since the vaccination program
started and this study was originally conducted. As described above, our simulation forecast inequitable out-
comes, but eventual herd immunity for everyone. Unfortunately, since the emergence of the more virulent Delta
variant, this situation no longer seems near at hand, if even within the realm of possibility. The variant is far more
virulent, instigating what the governor of Mississippi called “a pandemic of the unvaccinated,” but it is also more
contagious, lowering the efficacy of vaccination. We did run alternate simulations that iteratively lowered levels
of vaccine efficacy, and these increased racial inequities in the long-term persistence of infections. Additionally,
lowering vaccine efficacy to 75% increased the impact of mobility on infection rates by ~ 25%. Greater virulence
would only magnify each of these findings, further highlighting the urgency around inequities but also tempering
our forecast that inter-community mobility would be less of a concern at this point in the vaccination program.
Last, the narratives surrounding vaccination intentions in the United States have shifted somewhat, with
increasing concern not only about hesitance among Black and Latinx residents in urban areas, but also among
conservative White Americans, especially in rural areas44. Simulations like those run here that address whatever
local disparities exist could be useful for planning across the United States and internationally, provided that
there are tools available for tracking intentions, be they repeat surveys (especially with panel d esigns45), social
46
media polls , or otherwise. This is especially true if there is a transition to the distribution of booster shots
and widespread revaccination, in which case attitudes may be somewhat different from before. In any case, the
pandemic has not in fact been “ended” by the current vaccination program and continuing to refine these multi-
methodological approaches to anticipate and respond to it will be crucial.
Materials and methods
The study centers on an SIR model that uses pre-determined transmission and recovery rates in conjunction
with mobility between communities to estimate daily infection rates in each community. The models were run
for October-December, 2020, and the transmission and recovery rates were based on actual infection records.
Mobility was also derived from historical data for the same time period. The “communities” act as nodes in the
mobility model and are defined as the 100 non-Boston cities in towns in the greater Boston region (following
the Metropolitan Area Planning Council’s definition) and the 28 ZIP codes within Boston. This decision was
made based on the availability of more granular data for Boston as well as the large amount of between-ZIP
code demographic diversity within the city, which is lower or absent in many of the surrounding municipalities.
Scientific Reports | (2021) 11:19906 | https://doi.org/10.1038/s41598-021-99248-2 8
Vol:.(1234567890)www.nature.com/scientificreports/
Data and measures. The models used four data sources: (1) population descriptors from the American
Community Survey’s 2014–2018 5-year estimates; (2) daily and weekly infection case counts, derived from
infection records, for all towns in greater Boston and ZIP codes within Boston; (3) responses to three surveys
including items on people’s intentions regarding vaccination; (4) cross-community mobility records derived
from cell phone records, generated by SafeGraph, a data company that aggregates anonymized location data
from numerous applications in order to provide insights about physical places, via the Placekey Community.
To enhance privacy, SafeGraph excludes census block group information if fewer than five devices visited an
establishment in a month from a given census block group. The Boston Area Research Initiative’s Geographical
Infrastructure47 was used to join data describing each municipality or ZIP code.
Census indicators. We drew population descriptors from the U.S. Census’ American Community Survey’s
2014–2018 estimates for all census block groups in Massachusetts. This level was selected as it is the largest
census geography that nests cleanly within ZIP codes in Boston and within municipal boundaries. Community
indicators included total population and ethnic composition (i.e., proportion Asian, proportion Black, propor-
tion Latinx, proportion White). All measures were aggregated from census block groups to the municipal or ZIP
code level using population-weighted means.
Infection cases. The Commonwealth of Massachusetts’ Department of Health released weekly counts of new
infections for all municipalities, starting on April 14th, 2020. It also released daily counts for counties. From
these two data sources we created daily town measures by: tabulating the weekly sum of infected cases in a
county; calculating the percentage of a county’s cases attributed to each town; estimating the daily infected cases
per town as the same percentage of the daily count for the county. For Boston ZIP codes, we had case records
tracked by the Boston Public Health Commission mapped to the ZIP code of residence. We tabulated these for
daily counts.
Surveys. Three surveys of Massachusetts residents were conducted that included a question regarding inten-
tion to vaccinate and split these responses by race. The three surveys were conducted by the Center for Survey
Research at University of Massachusetts Boston with the Boston Area Research Initiative, MassInc Polling on
behalf of the Boston Museum of Science, and Suffolk University Polling and the Boston Globe. The first surveyed
residents of Boston from September to November and the other two surveyed residents from throughout Mas-
sachusetts in November and December, respectively. Although the exact wording varied between them, all three
surveys permitted respondents to say that they “definitely” or “definitely did not” plan to get the vaccine or that
they were uncertain or undecided. The overall proportion of individuals falling in each of these three groups
was consistent across the three surveys, as were the breakdowns by race (though the MassInc poll did not have
enough Asian respondents to include cross-tabs for that group; see Supplementary Online Materials for full
results).
We summed the cross-tabs for the vaccination intention question by race across the three surveys to calculate
the weighted proportion of individuals indicating “as soon as possible,” “never,” and something in between for
each of the four major racial categories—Asian, Black, Latinx, and White. We then estimated the proportion
of residents in each of these three categories regarding the vaccine for each municipality and Boston ZIP code
with the following equation:
Yi,k = pi,j ∗ rj,k
j
where Yi,k is the proportion of residents in community i with attitude k toward the vaccine (e.g., getting it as soon
as possible), pi,j is the proportion of residents in community i of race j, and rj,k is the proportion of members of
race j giving k as their response across the three surveys.
Cellphone generated mobility records. We used SafeGraph’s daily “Social Distancing” dataset to create the
mobility network. The data are generated using a panel of GPS pings from anonymous mobile devices. Each
device is attributed to an estimated home census block group (CBG) based on its most common nighttime loca-
tion. It also tracks all stay points of these devices within other CBGs. The published data aggregate these pieces
of information to generate a mobility matrix of the daily number of visits by the assumed residents of each CBG
to each other CBG. Each CBG was nested in its ZIP code or municipality.
Mobility‑driven SIR model with the distribution of vaccination. Model. Our model was based on
a traditional SIR (susceptible-infected-recovered) model that then incorporated two additional factors: mobility,
to simulate the effect of contacts brought by the mobility between communities; and vaccination, to model the
effect of the adoption of vaccination across communities. The full model consists of the following differential
equations, which update daily:
Scientific Reports | (2021) 11:19906 | https://doi.org/10.1038/s41598-021-99248-2 9
Vol.:(0123456789)www.nature.com/scientificreports/
Nm
∂t jn = αn jn + γ αn wmn jm +γ αm wnm jm sn − βjn
m�=n Nn n�=m
Nm
∂t sn = − αn jn + γ αn wmn jm +γ αm wnm jm + µg pn sn
m�=n Nn n�=m
∂t rn = βjn
∂t pn = −g pn + hun vn
∂t un = −hun vn
∂t vn = g pn
where Nn, jn, sn, and rn represent the total population size, number of infected cases, susceptible individuals, and
recovered cases, respectively, for a community at a given timepoint.
The equations, which model simultaneous change over time in infected, susceptible, and recovered individu-
als, rely on four main components. αn is the growth rate of infections in a community (i.e., the expected number
of new cases from existing cases). It is based on a global α0 in combination with a sigmoid function
that accounts
jn 4
for fluctuation effects between communities when jn is less than a threshold ε i.e. αn = α0 · j
4 48. The second
ε
1+ εn
component pertains to mobility, including two operands: rI = γ m�=n αn wmn jm Nn calculates the possibility of
Nm
an infected person
in other communities (m) visiting the community and infecting susceptible in community
n; and rR = γ n�=m αm wnm jm is the possibility of a susceptible person from the community visiting another
community (m) and becoming infected. wmn = Fmn/Nm where Fmn indicates the total number of visits from com-
munity m to community n, as captured by the cell-phone generated mobility data. The average mobility rate
F
gamma is defined as γ = m∈G Nmm . The third component is the rate of recovery of infected individuals, repre-
m∈G
sented by β, which is consistent across communities. All individuals who have been infected and recovered are
permanently removed from the susceptible population.
The fourth component of the model is vaccination adoption, wherein pn is the proportion of people who will
definitely receive the vaccine, un is the proportion of people uncertain about getting the vaccine, and vn is the
proportion of people who have already been vaccinated. μ reflects the effectiveness of the vaccine and μ⋅vn are
treated as part of rn as they have been removed from the susceptible population. h is the persuasion rate at which
someone uncertain about getting the vaccine will be persuaded to do so, whose strength is contingent on the
proportion of residents in the community who have already been vaccinated (i.e., hunvn). We assume that h is
consistent across communities. Only those who were uncertain about the vaccine could be persuaded, not those
who stated they would never get the vaccine. Actual vaccination is represented by the function g(pn), of the form:
c pn ≥ c
g pn =
pn pn < c
in which c is the maximum capacity of the vaccination rollout for a day.
Fixed parameters. Multiple parameters were established in advance of estimating the final model. α and β, the
transmission and recovery rate, were estimated by running the simulation without vaccination on historical
mobility and infection data for September 30th through December 22nd. Grid search identified a local optimum
for α = 0.096 and β = 0.072, which translate to the more familiar R0 = α/β = 1.33. ε was calculated as
ε = M Nm = 3.826 × 10⁻⁵, where M is the number of communities. μ, or the vaccine effectiveness, was set
m∈G
to 0.95, per the Pfizer and Moderna trial results. The rate of vaccine rollout was initially set to a 12-week (approx.
3-month) rollout period, meaning c = 1/(7*12) = 0.0119, or 1.19% of the population could be expect to be vacci-
nated daily.
In addition, we had to extend the simulation for three additional months for determining herd immunity
(i.e., < 1 infection; the model permits fractions of infections), because only a third of communities had reached
it by this definition at the end of the initial simulation. Two extreme scenarios are designed to impute the mobil-
ity data after Jan 12, 2021 to ensure that the real mobility data lies between the two imputed mobility datasets.
We assume a cumulative 5 ± 0.5% increase or decrease for every 2 weeks to the real mobility data from Dec 29,
2020, to Jan 11, 2021.
For h, we assume that the rate at which individuals uncertain about taking the vaccine are persuaded to do so
is dependent on the number of people in their community who have received the vaccine. The number of people
a person knows in their neighborhood and the number of people they need to know who have been vaccinated
to be persuaded both vary by individual. In terms of likelihood to be persuaded, we use an additional item from
the Mass Inc-Museum of Science survey regarding when people would be likely to get vaccinated. We note two
groups: those who would like to see a few people get the vaccine before they do, and those who would like to see
many other people get it. We use the cross-tabs from this question with the initial vaccination intention ques-
tion to distribute them within the sample (see Supplementary Online Materials), and differentiate between these
functionally in the model based on how many members of their neighborhood need to be vaccinated for them to
be persuaded. Numerous neighborhood surveys have found that people say they are friends with or personally
know very few of those living in their neighborhood (e.g., 5 people on one’s street, less than 10 friends in the
neighborhood40). Based on these numbers, we estimate that the average individual knows approximately 1% of
the residents of his or her neighborhood well enough to know and relate to their vaccination experiences. We
Scientific Reports | (2021) 11:19906 | https://doi.org/10.1038/s41598-021-99248-2 10
Vol:.(1234567890)www.nature.com/scientificreports/
Parameter Meaning Value (robustness checks) Source
αa Transmission rate 0.096 Modeled on historical infections, mobility (9/30–12/22)
βa Recovery rate 0.072 Modeled on historical infections
μ Vaccine effectiveness 0.95 (0.75, 0.85) Pfizer and Moderna trial results26, 27
c Weekly rollout (% of population) 0.0119 (0.0089, 0.0056) Based on 3-month (12-week) rollout
Sigmoid function based on neighborhood surveys about
h Persuasion rate 0.026 (0, 0.013, 0.039)
number of neighbors known49
Table 2. Fixed values and sources for parameters in the baseline simulation model and robustness checks.
a
The more familiar R0 = α/β = 1.33.
further estimate that if about 25% of these people (i.e., 0.25% of the population) were vaccinated, the average
person would know at least “a few” people who had been vaccinated. Approximately 37% of people who were
uncertain about vaccination said they would do so once “a few people they knew” were, the remainder when
“many people” were. From this, we estimate that when 25% of the residents of a neighborhood are vaccinated,
18.5% of those who started out as uncertain will have been persuaded (that is, half of 37%, as only the average
person would have enough exposure at that time). Based on the same results, we believe that the asymptote for
persuasion is at 90%. We solved for these established points in a sigmoid function and found h = 0.026. All fixed
parameters, their meaning, source, and value in the baseline model are reported in Table 2.
Robustness tests. We ran iterations of the model to test for robustness, varying three elements: persuasion, vac-
cine efficacy, and timeline of vaccine roll-out. We tested persuasion as 50% stronger (h = 0.039) and 50% weaker
(h = 0.013), as well as the absence of persuasion altogether (h = 0). We tested vaccine efficacy at the lower points
of 85% and 75%. We tested the timelines for vaccination roll-out at four and 6 months (c = 0.0089 and 0.0056,
respectively). We re-ran the simulation with all possible combinations, making for 36 sets of results (4 × 3 × 3).
All parameters are reported in Table 2.
Methods statements. We confirm that all methods were carried out in accordance with relevant guidelines and
regulations.
The survey “Living in Boston During COVID-19 Survey” conducted by the authors of this manuscript has IRB
approval from Northeastern University and The University of Massachusetts Boston. Additionally, we confirm
that informed consent was obtained from all subjects.
Data availability
The population descriptors from the U.S. Census’ American Community Survey’s 2014–2018 estimates were used
from the processed and curated open database of BARI. According to the mobility data agreement, SafeGraph
is providing free access to various datasets only to researchers, non-profits, and governments around the world
which are working directly in the response to COVID-19, reason why this dataset is not open for reproducibility.
The COVID-19 infection counts are openly available per week and day from the Massachusetts governmental
website at town and county level. The COVID-19 infection counts for the City of Boston were processed from
BPHC based on a shared data agreement, and we do not have the rights to publicly share the data. The vaccina-
tion information was derived from the Living in Boston survey, which was designed and implemented by the
authors of this manuscript. The vaccination data is available upon request. Modeling code will be posted through
GitHub upon publication of the paper.
Received: 22 March 2021; Accepted: 14 September 2021
References
1. Anderson, R. M. & May, R. M. Vaccination and herd immunity to infectious diseases. Nature 318, 323–329 (1985).
2. Rashid, H., Khandaker, G. & Booy, R. Vaccination and herd immunity: What more do we know?. Curr. Opin. Infect. Dis. 25,
243–249 (2012).
3. S. E. A. Network. COVID-19 Survey Summary: December 18, 2020 (2020).
4. Pogue, K. et al. Influences on attitudes regarding potential COVID-19 vaccination in the United States. Vaccines 8, 1–14 (2020).
5. Taylor, S. et al. A proactive approach for managing COVID-19: The importance of understanding the motivational roots of vac-
cination hesitancy for SARS-CoV2. Front. Psychol. 11, 575950 (2020).
6. Domnich, A. et al. Attitudes and beliefs on influenza vaccination during the COVID-19 pandemic: Results from a representative
Italian survey. Vaccines 8, 1–20 (2020).
7. Wang, J. et al. Acceptance of COVID-19 vaccination during the COVID-19 pandemic in China. Vaccines 8, 482 (2020).
8. Sherman, S. M. et al. COVID-19 vaccination intention in the UK: Results from the COVID-19 vaccination acceptability study
(CoVAccS), a nationally representative cross-sectional survey. Hum. Vaccines Immunother. 17, 1–10 (2020).
9. Freeman, D. et al. COVID-19 Vaccine Hesitancy in the UK: The Oxford Coronoavirus Explanations, Attitudes, and Narratives Survey
(OCEANS) II (Cambridge University Press, 2020).
10. Neumann-Bohme, S. et al. Once we have it, will we use it? A European survey on willingness to be vaccinated against COVID-19.
Eur. J. Health Econ. 21, 977–982 (2020).
11. Hamel, L., Krirzinger, A., Munana, C. & Brodie, M. KFF COVID-19 Vaccine Monitor: December 2020 (Kaiser Family Foundation,
2020).
12. Hobson-West, P. Understanding vaccination resistance: Moving beyond risk. Health Risk Soc. 5, 273–283 (2003).
Scientific Reports | (2021) 11:19906 | https://doi.org/10.1038/s41598-021-99248-2 11
Vol.:(0123456789)www.nature.com/scientificreports/
13. Streefland, P. H. Public doubts about vaccination safety and resistance against vaccination. Health Policy 55, 159–172 (2001).
14. Quinn, S., Jamison, A., Musa, D., Hilyard, K. & Freimuth, V. Exploring the continuum of vaccine hesitancy between African
American and White adults: Results of a qualitative study. PLoS Curr. https://doi.org/10.1371/currents.outbreaks.3e4a5ea39d
8620494e2a2c874a3c4201 (2016).
15. Schmid, P., Rauber, D., Betsch, C., Lidolt, G. & Denker, M.-L. Barriers of influenza vaccination intention and behaviour—A sys-
tematic review of influenz vaccine hesitancy, 2005–2016. PLoS ONE 12, e0170550 (2017).
16. Hawkins, D. Differential occupational risk for COVID-19 and other infection exposure according to race and ethnicity. Am. J. Ind.
Med. 63, 1–4 (2020).
17. Garcia, M. A., Homan, P. A., Garcia, C. & Brown, T. H. The color of COVID-19: Structural racism and the disproportionate impact
of the pandemic on older Blank and Latinx adults. J. Gerontol. B Psychol. Soc. Sci. 76, 1–6 (2020).
18. Kirksey, L. et al. Pandemic superimposed on epidemic: COVID-19 disparities in Black Americans. J. Natl. Med. Assoc. 113, 1–5
(2020).
19. Lamb, M. R., Kandula, S. & Shaman, J. Differential COVID-19 case positivity in New York City neighborhoods: Socioeconomic
factors and mobility. Influenza Other Respir. Viruses 382, 1–9 (2020).
20. Bryan, M. S., et al. COVID-19 mortality and neighborhood charcteristics in Chicago. Ann. Epidemiol. 56, 47–54 (2020).
21. Chang, S., et al. Mobility network models of COVID-19 explain inequities and inform reopening. Nature 589, 82–87 (2020).
22. Badr, H. S. et al. Association between mobility patterns and COVID-19 transmission in the USA: A mathematical modelling study.
Lancet Infect. Dis. 20, 1247–1254 (2020).
23. Chinazzi, M. et al. The effect of travel resitraictions on the spread of the 2019 novel oronavirus (COVID-19) outbreak. Science 368,
395–400 (2020).
24. Zhang, J., et al. Changes in contact patterns shape the dynamics of the COVID-19 outbreak in China. Science 368 (6498), 1481–1486
(2020).
25. Zhang, J., et al. Evolving epidemiology and transmission dynamics of coronavirus disease 2019 outside Hubei province, China: A
descriptive and modelling study. Lancet Infect. Dis. 20 (7), 793–802 (2020).
26. Kraemer, M. U. G. et al. The effect of human mobility and control measures on the COVID-19 epidemic in China. Science 368,
493–497 (2020).
27. Mahase, E. Covid-19: Logistical problems frustrate GPs ready to deliver vaccine in England. BMJ Br. Med. J. (Online) 371, m4849
(2020).
28. Chinazzi, M., et al. Estimating the effect of cooperative versus uncooperative strategies of COVID-19 vaccine allocation: a modeling
study (Network Science Institute, Northeastern University, 2020).
29. Angst, C. M. & Agarwal, R. Adoption of electronic health records in the presence of privacy concerns: The elaboration likelihood
model and individual persuasion. MIS Q. 33, 339–370 (2009).
30. Battacharyya, S. & Bauch, C. T. “Wait and see” vaccinating behaviour during a pandemic: A game theoretic analysis. Vaccine 29,
5519–5525 (2011).
31. Fu, F., Christakis, N. A. & Fowler, J. H. Dueling biological and social contagions. Sci. Rep. 7, 43634 (2017).
32. Le Chang, S., Piraveenan, M. & Prokopenko, M. The effects of imitation dynamics on vaccination behaviours in SIR-network
model. Int. J. Environ. Res. Public Health 16, 2477–2507 (2019).
33. Fu, F., Rosenbloom, D. I., Wang, L. & Nowak, M. A. Imitation dynamics of vaccination behaviour on social networks. Proc. R. Soc.
B Biol. Sci. 278, 42–49 (2011).
34. Easton, J. & Murphy, J. 15 million Covid Vaccine Doses Thrown Away in the U.S. Since March, New Data Shows. (NBC News, 2021).
35. Schmid, P., Macdonald, N. E., Habersat, K. & Butler, R. Commentary to: How to respond to vocal vaccine deniers in public. Vaccine
36, 196–198 (2018).
36. Estep, K. & Greenberg, P. Opting out: Individualism and vaccine refusal in pockets of socioeconomic homogeneity. Am. Sociol.
Rev. 85, 957–991 (2020).
37. Dube, E. et al. Vaccine hesitancy: An overview. Hum. Vaccines Immunother. 9, 1763–1773 (2013).
38. Lokyer, B. et al. Understanding COVID-19 misinformation and vaccine hesitancy in context: Findings from a qualitative study
involving citizens in Bradford, UK. Health Expect. 24, 1159–1168 (2021).
39. Gatalo, O., Tseng, K., Hamilton, A., Lin, G. & Klein, E. Associations between phone mobility data and COVID-19 cases. Lancet
Infect. Dis. 21, e111 (2020).
40. Gallagher, R. J., Doroshenko, L., Shugars, S., Lazer, D. & Foucault Welles, B. Sustained online amplification of COVID-19 elites in
the United States (arXiv, 2020).
41. Krueger, T., Gogolewski, K., Bodych, M., Gambin, A., Giordano, G., Cuschieri, S., et al. Assessing the risk of COVID-19 epidenic
resurgence in relation to the Delta variant and to vaccination passes (2021).
42. McMinn, S. et al. Across the South, COVID-19 Vaccine Sites Missing from Black and Hispanic Neighborhoods (National Public Radio,
2021).
43. Williams, N., Tutrow, H. & Pina, P. Assessment of racial and ethnic disparities in access to COVID-19 vaccination sites in Brooklyn,
New York. JAMA Netw. Open 4(6), e2113937 (2021).
44. Agarwal, R. et al. Socioeconomic privilege and political ideology are associated with racial disparity in COVID-19 vaccination.
Proc. Natl. Acad. Sci. 118(33), e2107873118 (2021).
45. Perlis, R. H. et al. Association of acute symptoms of COVID-19 and symptoms of depression in adults. JAMA Netw. Open 4(3),
3213223 (2021).
46. Eibensteiner, F. et al. People’s willingness to vaccinate against COVID-19 despite their safety concerns: Twitter poll analysis. J.
Med. Internet Res. 23(4), e28973 (2021).
47. Ristea, A., Sheini, S., O’Brien, D. T. Geographical Infrastructure for the City of Boston v. 2020. https://doi.org/10.7910/DVN/
W0V6FX. (Harvard Dataverse, V1, 2020).
48. Brockmann, D. & Helbing, D. The hidden geometry of complex, network-driven contagion phenomena. Science 342, 1337–1342
(2013).
49. Sampson, R. J. Great American City: Chicago and the Enduring Neighborhood Effect (University of Chicago Press, 2012).
Acknowledgements
We thank our colleagues at the City of Boston and Boston Public Health Commission for feedback on the concept
and early analyses and SafeGraph for the provision of mobility data.
Author contributions
Conceptualization: Y.W., A.R., J.L.H., J.G., Q.W., D.T.O. Data Curation: A.R., M.A., S.G., J.L.H., H.G., N.K.
Formal Analysis: Y.W., A.R. Methodology: Y.W., A.R., J.G., Q.W., D.T.O. Investigation: A.R., J.L.H., R.S., D.D.,
Q.W., D.T.O. Visualization: A.R. Funding acquisition: A.R., J.L.H., R.S., Q.W., D.T.O. Project administration:
A.R., J.L.H., A.R., R.S., D.T.O. Writing—original draft: D.T.O. Writing—review & editing: A.R., J.L.H., A.R.,
R.S., D.D., J.G., Q.W., D.T.O.
Scientific Reports | (2021) 11:19906 | https://doi.org/10.1038/s41598-021-99248-2 12
Vol:.(1234567890)You can also read