Val d'Or: highest grade Archean gold camp globally - Sprott
←
→
Page content transcription
If your browser does not render page correctly, please read the page content below

Val d’Or: highest grade Archean gold camp globally
Monarch Resources (MQR CN) Initiating with BUY rating and C$1.65/sh PT                                               RISK RATING: HIGH
O3 MINING (OIII CN): Initiating with BUY rating and C$4.60/sh PT                                                     RISK RATING: SPECULATIVE
Probe Metals (PRB CN): Initiating with BUY rating and C$2.60/sh PT                                                   RISK RATING: SPECULATIVE

        Step back and remember the geology: the Yilgarn and the Abitibi, alongside the Keniba Inlier of Mali and the Man Shield
        of Ghana were, are, and always will be the most prolifically mineralised Archean gold belts globally. Within these, the
        Eastern Goldfields, Senegal-Mali Shear Zone, Ashanti Gold Belt, and Abitibi Gold Belt from Timmins to Val d’Or are far
        and away the richest trends, within the richest cratons. The Yilgarn has more defined ounces, but averages ~1.5g/t. The
        Abitibi is less well explored than the easily drilled WA desert, and averages 2.5g/t. The three juniors we initiate on in this
        report hold ounces that would be worth multiples of their current market caps if in Australia, so what’s the catch?
        Time to take a page from the Aussie playbook
        Western Australia’s discovery rate dipped in the 2010s, but is now the centre for a constant stream of discoveries, mines
        and mills. The take homes for us are (i) drill dollars and rising gold price drive new ounces even in mature Archean belts,
        and (ii) while the Canadians are king of deep narrow-vein, the Australians rule the hub-and-spoke model. Val d’Or not
        only has eight gold plants, it has better inter-mine infrastructure than Australia with rail links, including to Timmins. So
        why own Val d’Or developers? We expect current ounces to start falling into feasibility studies either standalone or
        through third party mills, with improved reserve conversion at high gold prices. More drilling equals more ounces.
        Tick tock: eight mills with 26Mtpa capacity but only 190Mt of reserves
        In Val d’Or, the size of the milling capacity is immense at 26Mtpa, or well over that if on-rail Kidd Creek and/or Timmins
        mills are added. However, current reserves are under 200Mt. While some of these mines will grow, finding ~1.4Moz pa
        organically appears unlikely. The two implications to us are excess mill capacity on a toll basis, and/or independents
        with high gold endowments will become M&A targets. As always, the majors were asleep at the wheel at US$1,200/oz,
        dropping land not acquiring it, and fearfully avoiding M&A. Once again, this will cost them dearly in the bull market.
        Monarch: potential bidding war for 2Moz, stock is just too cheap
        We think Monarch is too cheap. There could be a two-way (or more) bidding war for Wasamac’s 2Moz, 25-30koz pa
        from Beaufor while bonanza grades at McKenzie Break potentially underpin the entire market cap in cash. In
        neighbouring camps we count >$1.5bn market cap from a few juniors with no mineable gold. As enthusiasm wanes, we
        expect a re-rate for the ‘real’ assets of Monarch. Our valuation is based on 0.5xNAV for Wasamac’s C$948m NPV,
        0.7xNAV C$40m for Beaufor and C$36m for other assets, with the stock trading at just 0.14xNAV.
        O3: 5Moz and largest land position, 120koz pa on the way
        Few realise that O3 has 5Moz; 2Moz in Timmins, 2Moz at Marban, and multiple Val d’Or satellites the balance. Marban
        should cornerstone production with >100koz pa ‘in the bag’ in our view. Step back though, and it is evident that counter-
        cyclical aggression has allowed this junior to peg the largest holding in one of the most prolific belts globally, a prime
        position. Once again the majors were asleep as the wheel, and its going to cost them. O3 isn’t doing ‘more of the same’
        either, with AI now sifting through new targets. Our PT is based on 0.4xNAV5%-1850, comprising C$495m Marban NPV,
        C$79m in cash and investments, and a nominal C$40m for resources outside reserves, putting the stock on just
        0.27xNAV.
        Probe: now at 3.2Moz, with momentum shifting to new ground, and the entire Lower Detour belt
        Probe is the quiet achiever. Every year they grow ounces in overlooked Val d’Or East. Like O3, the downturn was used
        to build a larger land position, and this is already returning new discoveries. Alongside IP to see through Val d’Or clays,
        we expect more discoveries to come. Next year should see Probe wrap economics around their ounces which we expect
        to act as a material catalyst, alongside one thing investors can relay on with Probe, more ounces. Our valuation is based
        on a conservative 2/3 of pittable ounces converting into 1.1Moz

               All valuations in this report are prepared at 5% discount and US$1,850/oz gold price, with share prices as at August 14
                                                                                                                   Sprott Capital Partners Equity Research

           1
Val d’Or sector review ............................................................................................................... 3

                                                          MONARCH GOLD
Investment thesis ..................................................................................................................... 8
Valuation .............................................................................................................................. 11
Wasamac .............................................................................................................................. 14
Beaufor mine ......................................................................................................................... 17
McKenzie Break ..................................................................................................................... 19

                                                              O3 MINING
Investment thesis ................................................................................................................... 28
Valuation .............................................................................................................................. 28
Marban ................................................................................................................................. 30
Alpha ................................................................................................................................... 31
East Cadillac ......................................................................................................................... 36
Garrison ............................................................................................................................... 38

                                                          PROBE METALS
Investment thesis ................................................................................................................... 44
Valuation .............................................................................................................................. 45
Cadillac East exploration ......................................................................................................... 52
Detour Gold Trend .................................................................................................................. 53
Megiscane-Tavernier............................................................................................................... 53

                                                                                                       Sprott Capital Partners Equity Research

2
Val d’Or sector note, 17 August 2020

Val d’Or: lower production points to opportunity on highest-grade ‘super belt’
With the exception of Nevada’s Carlin trend, Archean era deposits are the best mineralised. In the Archean era,
the mantle was thicker, the crust thinner and the earth was very tectonically active, resulting in more fluids coming
to surface. Similarly, most gold precipitates at depth (‘mesothermal’). Epizonal deposits such as Fosterville and
Newfoundland) may be catching the headlines but these deposits came from ‘brittle cracks’ near surface and
typically have less continuity and endowment. What is notable about Val d’Or is the grade and lower production.
The lower production of this camp is a consequence of near-surface deposits not being developed as the focus
has been on deep ‘main break’ assets and, is simply the result of an immature development schedule and
exploration spend than prospectivity.
                   Figure 1. Global gold camps showing total endowment, grade, and 2019 production

Source: Source: S&P Market Intelligence, August 4th, 2020; total endowment refers to current total gold resources as well as total estimated
historic gold production for each jurisdiction

Southern Abitibi: undisputed king of Canada
The Southern Abitibi has a total endowment of 223Moz which is a third of all Canadian endowment. Alongside
deposits to the east (Red Lake, Timmins) and North (Detour, Windfall), the Archean represents the vast majority
of Canadian gold. Looking at >2Moz deposits, the Val d’Or and Ontario / Quebec area show the highest
concentration within the belts, making it the undisputed (geological) king of Canadian gold. Only three sub-belts
rival this globally; (i) the Eastern Goldfields Province of the Yilgarn (Kalgoorlie surrounds), (ii) the Ashanti Gold Belt
of Ghana, and (iii) the Senegal-Mali Shear Zone of the Kedougou-Keniba in West Africa.
                                      Figure 2. Location of >2Moz gold deposits in Canada

Source: Kenorland Minerals August 2020

                                                                                                       Sprott Capital Partners Equity Research

3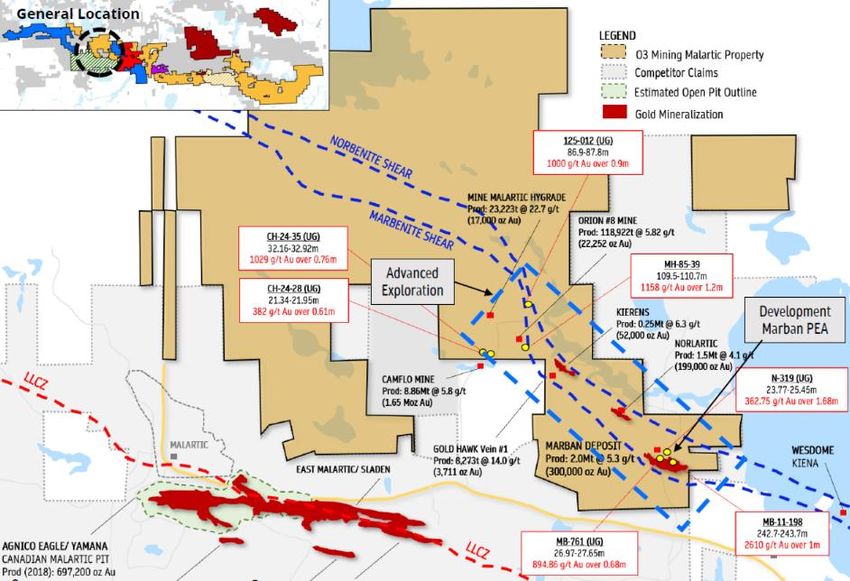
Val d’Or sector note, 17 August 2020

Low exploration spend and cheap cost of discovery point to immature belt
Clues to the lower production profile but high endowment lie below, as exploration spend in Western Australia is
close to double that in Quebec, while the downturn saw even less investment in Africa. Above we point out that
low production could be the result of immature exploration. The second chart below bears witness to this, as the
discovery cost in Quebec remains lower than most North American jurisdictions with the exception of the Golden
Triangle. So we have a prolific, under explored, cheap-to-deliver ounces belt. There isn’t a lot not to like about Val
d’Or with this in mind.
                                   Figure 3. Exploration expenditure and replacement cost

Source: S&P Market Intelligence, Statistics Canada, Australian Bureau of Statistics, Alaska’s Mineral Industry Report, Survey of Nevada’s
Mineral Industry, company public filings, August 4th, 2020

Existing operators have no shortage of mills with 26Mtpa capacity
In total, Val d’Or has 8Mtpa of milling capacity, which increases to 26Mtpa when including Malartic with 55ktpd /
18Mtpa. There area range of CIL, CIP, Merrill-Crow and floatation plants. Similarly, TMFs a just as important, again
with a range of those suitable for benign and acid-forming tails. The strategic value of permitted TMFs can’t be
underplayed, given the savings in both capex for a potential new entrant, as well as savings on permitting time
frames. On top of this, simple expansions at Sigma-Lamaque could add 1Mtpa, and if Glencore repurposes slighty
more distant at Kidd Creek, that would add a further 4Mtpa for almost 31Mtpa in total.
                                        Figure 4 Regional mining operations and plants

Source: Source: S&P Capital IQ, Market Intelligence, August 4th, 2020. The Sigma-Lamaque mill is currently permitted to a throughput of
2,200tpd, however the mill can be further expanded up to 5,000tpd with the addition of a SAG mill.

                                                                                                     Sprott Capital Partners Equity Research

4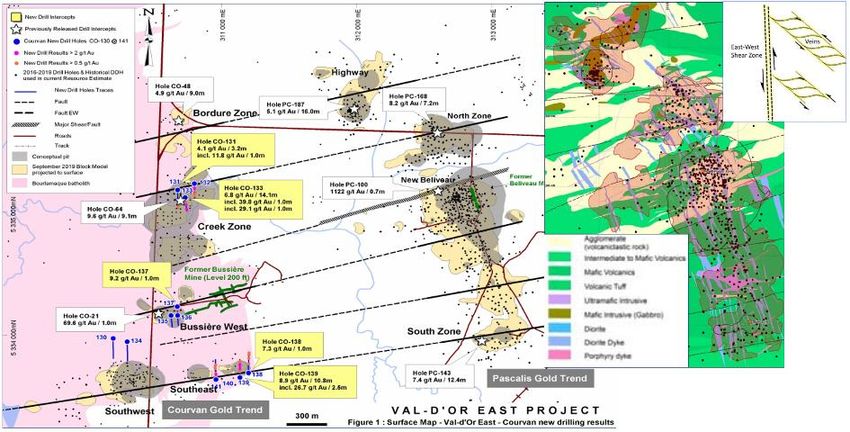
Val d’Or sector note, 17 August 2020

Supporting ever rising production
All the above mills have driven a lift in total resources to the current 83Moz. This in turn has supported a relentless
increase in production to the current ~1.4Moz pa, matching the ever-growing endowment. Two key take homes for
us are (i) the endowment growth is demonstrable evidence of the underlying prospectivity of the belt, and (ii) the
ever growing production will put ‘fill the mill’ pressure on producers.
                         Figure 5 (A) Gold production over time and (B) gold resources over time

Source: S&P Market Intelligence,, August 4th, 2020

Predators: existing mines average 6-8 year life, the clock is ticking
We show below that the ~26-31Mtpa of capacity is reasonably well matched to the ~190Mt of reserves. In most
cases, existing mine lives are 7-8 years. We would expect a lowering of cut-off grades and near-mine exploration
to replace some of these ounces, but not at the rate of depletion. Another key point here is grade, with mills such
as Malartic and Goldex processing ore at just 0.9g/t and 1.5g/t, respectively. Put simply, either operation could
substitute higher-grade satellite feed for a materially improved production rate and mine life. Looking to the longer
term, Malartic is considering a future higher-grade underground, which would leave more spare capacity and lower-
grade feed to ‘fill the mill’ in order to optimize unit costs. Our overall view is that while no operation is in ‘desperate’
need of feed, the clock is ticking across the belt. Assuming 2-3 years to permit and develop regional inferred
ounces, these majors need to act within a 4-6 year window at the latest.
                   Figure 6 Total resources held by (A) producers and (B) pre-producers in the Abitibi

Source: S&P Market Intelligence, company public filings, August 4th, 2020. Canadian Malartic is under a Joint Venture between Agnico
Eagle and Yamana Gold. Agnico is the mine’s operator. Beaufor ore is processed at the nearby Camflo mill. The mine was placed on care
and maintenance in June 2019. Note: AuEq resources calculated using spot commodity pricing from August 4th, 2020

                                                                                                  Sprott Capital Partners Equity Research

5
Val d’Or sector note, 17 August 2020

Prey: 87% of Val d’Or ounces held by developers lie within Monarch, Probe and O3
The chart below shows resources held by producers, with Agnico and Yamana being the ‘big boys’. What is
interesting is the volume of ounces held by pre-producers. While Falco and Osisko lead the pack they are in Rouyn-
Noranda and Windfall districts, respectively. The three names we initiate coverage on here, Monarch, Probe and
O3, have >10Moz (+2Moz in Timmins for O3), a remarkable endowment. Historically the focus may have been on
how to optimise pits vs. undergrounds, and how to avoid high-capex mine builds. However, given the mill capacity
shown above, and increasing ‘what fits in the pit’ with gold price, we see self-development, M&A or toll-milling
operations as a necessity in coming years.
                   Figure 7 Total resources held by (A) producers and (B) pre-producers in the Abitibi

Source: Source: S&P Market Intelligence August 4th, 2020; AuEq resources calculated using spot commodity pricing from August 4th, 2020

Developers to be had for just US$33/oz
While more exploration focused QMX and more advanced Osisko trade at >US$160/oz, the remainder of the
developers in the Abitibi trade well under that. In fact, Probe, Monarch and O3 all trade at effectively the same
level around US$33/oz. We undertake more detailed DCF valuation later in this report, but stepping back, this
trading value is more common to ‘unconstrained’ explorers yet to reach critical mass. To be fair, with no recent
feasibility studies from all three names, this is perhaps a fair valuation for where these names are today. The
opportunity is thus very simple; (i) valuation uplift through publication of feasibility or PEA studies, and of course
(ii) adding ounces.
                    Table 1. P/NAV (based on public consensus) and EV/in-situ for Abitibi gold names

Source: S&P Capital IQ, Market Intelligence, August 4th, 2020.

                                                                                                   Sprott Capital Partners Equity Research

6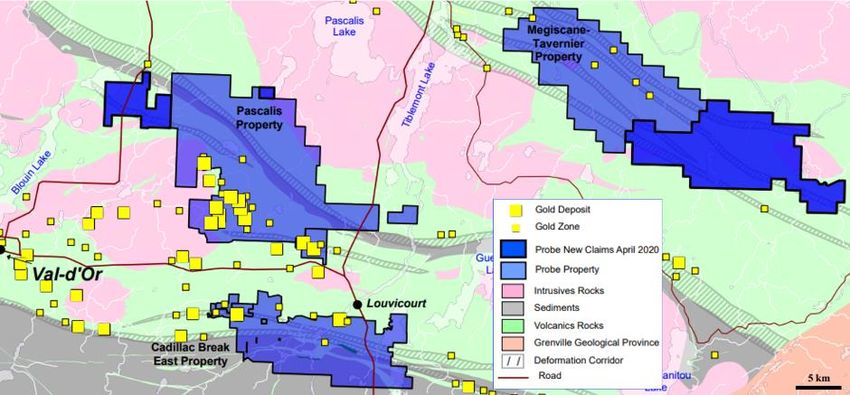
Monarch Gold (MQR CN)
Big asset upside with Val d’Or optionality
RECOMMENDATION: BUY PRICE TARGET: C$1.65/sh RISK RATING: HIGH
SHARE DATA A treasure trove in the Abitibi
Shares (basic, FD, FF FD) 270 / 281 / 445 Monarch’s 3.5Moz in the Abitibi is corner stoned by flagship Wasamac with
Share price (C$/sh) C$0.48/sh 1.7Moz @ 2.6g/t. That asset can produce almost 150kozpa over 11 years, with
52-week high/low C$0.59 / C$0.12
both Malartic and Kidd Creek mills vying for the feed for a likely ‘no mill’ capex
Market cap (C$m) 129
SCPe net cash 2Q20 (C$m) 18.3
drop. After a pause this year to build up reserves, Beaufor’s ~ 30koz pa
1.0xNAV5% @ C$2050/oz (C$m)* 1,045 operation should generate good cash flow from next year, with likely bonanza-
1.0xNAV5% FD (C$/sh)* 3.72 grade drill results ahead of that. McKenzie Break should do the same given the
Project P/NAV today (x, FD) 0.15x average 11m @ 11g/t from the new zones, and if SCPe 150koz is defined, this
Average daily value (C$000, 3M) 1,075 could generate the entire market cap in cash from the ‘forgotten third asset’.
FINANCIALS FY23E FY24E FY25E Wasamac underpins large valuation, bidding war to emerge?
Gold sold (000oz) - 70 163 Wasamac’s ~150koz pa over 11 years at US$630/oz AISC was less attractive
Revenue (C$m) - 189 439
at lower gold price given the C$464m capex, and reliance on low-opex rail-
AISC (US$/oz) - 1,078 730
veyors in use at Goldex. However, the SCPe NPV5%-1850 of C$781m is less
Income (C$m) (14.2) 22 93
EPS (C$) - 0.03 0.12
sensitive to opex, while a similar NPV of C$790m under toll-treatment options
PER (x) - 16.7x 3.9x at Kidd Creek or Malartic reduces capex. In fact, we could see a bidding war
CFPS (C$) - - - ahead; Glencore’s Kidd operations benefit from Wasamac’s neutralizing ore to
P/CF (x) - - - remediate their site and defer environmental liabilities. Malartic would similarly
EBITDA (C$m) 4.6 29.5 34.6 benefit with the +100koz from substituting their own low-grade feed with
EV/EBITDA (x) 37.7x 3.8x 10.6x Wasamac ore adding C$900-1.3bn of value based on Agnico and Yamana’s
EV/EBTIDA. With rail connections to Timmins, even more doors could open.
TIME VALUE: 1850/oz SQ22 SQ23 SQ24
1xNAV5% FF FD (C$m)^ 1,107 1,152 1,361 Beaufor offers non-dilutive funding
1xNAV5% FF FD (C$/sh)^ 2.49 2.59 3.06
TIME VALUE: 2000/oz SQ22 SQ23 SQ24
The small Beaufor mine could restart for C$5-6m, producing SCPe 112koz over
1xNAV5% FF FD (C$m)^ 1,107 1,152 1,361 4yrs at >5g/t, processed at Monarch’s Camflo mill. The 42,000m drill program
1xNAV5% FF FD (C$/sh)^ 2.49 2.59 3.06 should return impressive hits for shareholders ahead of that, while extensions
0.70 3.0
at depth could increase the existing SCPe C$30m FCF the project generates.
Volume Price
0.60 2.5 Forgotten McKenzie Break could underpin entire market cap in FCF
McKenzie Break, Swanson and Croinor hold 550koz @ 3.7g/t, offering
Average daily vol. (m)
0.50 2.0
Share price (C$)
development and sale opportunities. We estimate the new discovery east of
0.40 1.5
McKenzie Break, averaging 11m @ 11g/t in three holes, could already support
0.30 1.0
150koz. At over US$1,000/oz margin, put through existing mill capacity, this
0.20 0.5 could generate the market cap in cash, and it’s only just been discovered.
0.10 - Recommendation: initiate with BUY rating and C$1.65/sh PT
Nov-19
Feb-20
May-20
Aug-20
Aug-19
At US$1,850/oz and a 5% discount, we value Wasamac on a self-build basis at
Source: Fidessa, ^FD for options and mine build C$781m, Beaufor at C$29m, and add a nominal US$50/oz for ounces outside
our DCF for C$36m. Adding cash and cash from options drives our 1xNAV of
C$867m or C$3.09/sh. Applying a 0.5xNAV multiple to Wasamac and 0.7xNAV
to Beaufor, we initiate with a BUY rating and a C$1.65/sh PT. At these levels,
Brock Salier, PhD +44-203-931-6771 with think the engineering studies underway by potential buyers should combine
bsalier@sprott.com with a permitting pathway to see substantial value unlocked in a stock trading at
just 0.16xNAV1850.
Chris Tonkin +44-203-931-6772
ctonkin@sprott.com
Monarch Gold, 17 August 2020

Investment thesis
Monarch Gold has been operating in Val d’Or for a number of years having owned and bought/sold a number of
licenses in what is prime mining real estate gaining various industry heavy weights as shareholders including
Alamos Gold (16%), Yamana Gold (6%), Hecla (4%) Agnico Eagle (3%), retail (29%), family offices (20%), funds
(14%) and management (3%). The key change from last year is the move from a diversified asset-holder focussed
on toll treatment to a concentrated portfolio focussed on three assets; Wasamac, Mackenzie Break and Beaufor,
with fringe assets now sold. The other key change comes with Wasamac ore through regional mills rather than
through a new self-built mill. DFS level Wasamac has a global resource of 2.8Moz @ 2.6g/t in a thick, steep dipping
underground mine, perfect for long hole stoping, and is the company’s flagship asset. The Beaufor mine offers
additional upside in the form of a quick small-production, which can fund drilling or offset Wasamac development
costs, with optionality on new high-grade shoots being discovered. McKenzie Break (and also Swanson and
Croinor) offer discovery upside, particularly at McKenzie Break where we estimate 150koz @ 10g/t could already
have been ‘de-risked’.
                                  Figure 8. Monarch assets across the Abitibi belt

Source: Monarch

Wasamac: Rouyn-Noranda’s next ~150kozpa underground mine
Wasamac holds reserves of 1.77Moz at 2.56g/t in 21.5Mt to be mined over 11 years. The innovative use of a Rail-
Veyor system, like we’ve seen at Agnico’s Goldex, Harmony’s Phakisa and Vale’s Copper Cliff, means that mining
costs are kept low while the 6,000tpd volume is easily met, ramping up over two years, after the two year build.
              Figure 9: (A) Wasamac DFS highlights (B) Rail-Veyor system (C) Wasamac long section
Mining inventory (000t)                 21,454
AuEq grade (g/t)                         2.56
Mining inventory AuEq (000oz)           1,767
Au recovery (%)                          88%
LOM throughput (Mtpa)                   1,950
Production AuEq Y1-5 (000oz pa)          153
Total build capex (C$m)                  464
Total sustaining capex (C$m)             165
LOM C1 costs (US$/oz AuEq)               550
LOM AISC (US$/oz AuEq)                   630
Gold price (US$/oz)                     1,300
Project NPV post-tax (C$m)               311
IRR post-tax (%)                         17%
Source: Monarch

                                                                                     Sprott Capital Partners Equity Research

8
Monarch Gold, 17 August 2020

Kidd concentrator: first step to ‘unlock’ the value of Wasamac
Glencore’s Kidd zinc operations lie ~200km away, but are connected to Wasamac via a 12,000tpd railway line that
runs through Wasamac’s license to Kidd Creek. The ‘ah hah’ moment for Glencore came with the realisation that
Kidd Creek, whose own reserves run out in SCPe 2023 after the operation moved to used only two of its four 3ktpd
lines, could see its substantial environmental liabilities not only deferred by toll-milling Wasamac ore, but offset.
The Kidd Creek site likely needs a cover over its historic TMFs with non acid forming rock. Given the site extends
over 6km2, which could take 10-20Mt of material costing >C$50m. Wasamac’s 21Mt of ore provides this ‘for free’
given its not acid forming, and is in fact neutralising given carbonate components. Further, this could defer a
considerable (SCPe multi-hundred-million) environmental liability at Kidd Creek, key for Glencore at a time when
they have recently cut their dividend to focus on debt repayments. While the front-end of the plant is reuseable, a
back-end (gold circuit) would be required, but this should come at a tiny fraction of the cost of a new plant. Ausenco
is now undertaking a review of what conversion requirements are made. We doubt Glencore wants ‘in’ to the gold
mining game, nor would Monarch want the Kidd Creek liabilities, so if this option comes to fruition we would look
to a toll-milling agreement as the most likely outcome.
With surprise second suitor emerging at Canadian Malartic
After signing an MOU with Glencore, Monarch was pleasantly surprised to be approached by Yamana, 50% holder
of the JV Canadian Malartic. Its no secret that that low-grade will be mined out in the next decade; while an
underground will likely continue, the JV would benefit from ‘filling the mill’ which is far too large to run on
underground feed only at 55,000tpd (running above this recently). Wasamac isn’t just a potential future feed either,
as its own 2.56g/t ROM feed compares to 0.8g/t at Malartic, meaning the JV could start processing Wasamac ore
‘early’, seeing a lift in production there. In fact, substituting Wasamac’s 2.1Mtpa feed should lift the JVs production
by 100koz pa for a simplistic US$100m increase in EBITDA. Agnico and Yamana trade at a forward looking ~10x
and ~7x EV/EBITDA, respectively, meaning Wasamac could be worth C$900-1.3bn. This is pretty compelling math
for those two producers, so if this outcome eventuates, we would expect Monarch to be the target of a full take-
out. So how interested are the counterparties? In June, post Glencore MOU, Yamana invested C$4.2m in a
placement with Monarch, a strategic investment coming with a board representative for Yamana. So yes, while we
would expect ESG, transport, geotechnical, environmental, engineering and resource modelling to require
investigation over the course of the year, Yamana evidently likes what they see so far.
Malartic worth SCPe C$780m at US$1,850/oz, lifting to US$950m at US$2050/oz
DFS Scenario: We model Wasamac per the DFS before adjusting for LT and US$2050 gold price and various mill
scenarios with an identical NPV to the DFS using the same inputs. Lifting the gold price to US$1,850 over doubles
the NPV5% from C$311m to C$781m, or triples it C$948m at US$2,050/oz.
Kidd Concentrator: We reduce initial capex by C$230m for the plant and tailings facility and add C$77m for the
Kidd refurbishment and C$16m for a rail siding at Wasamac. We remove plant sustaining-costs of C$66m over the
LoM. Maintaining processing costs of C$20/t and adding C$10/t in the form of train loading and hauling costs and
for any additional backfill requirements, with waste and tails now stored at Kidd Creek. Finally, we maintain a two
year build for this scenario on the basis that the decline lies on the critical path. Interestingly what is saved in capex
is lost on toll-treatment costs, for a similar build-start NPV of C$788m at US$1,850/oz and C$955m at US$2,050/oz
but the reduced capex sees IRR lift. Clearly the equity requirement will be lower under this scenario, improving the
per share upside for Monarch shareholders.
Canadian Malartic: We remove the C$230m in initial plant capex again, but add C$36m for a siding at Wasamac
as well as infrastructure for stock management at Malartic. We use the same mining costs here as the Kidd Creek
scenario but lift processing costs slightly on the basis of a tolling scenario. Again this returns a similar NPV of
C$787m at US$1,850/oz and C$954m at US$2,050/oz. With both Agnico and Yamana currently shareholders, we
think M&A is more likely. Using our estimated Malartic processing cost of C$11/t, Wasamac’s NPV increases to
C$877m at US$1,850/oz or C$1,042m at US$2,050/oz. This tallies well with EV/EBITDA multiples noted above.

                                                                                          Sprott Capital Partners Equity Research

9
Monarch Gold, 17 August 2020

                                              Figure 10: Wasamac project economics
                                                MQR              SCPe DFS             SCPe Kidd Ck     SCPe Malarcitc
        Wasamac Mine (100%)                     DFS     DFS       1850/oz 2050/oz   1850/oz 2050/oz   1850/oz 2050/oz
        Mining inventory (000t)                21,454    >>          >>      >>       >>       >>         >>         >>

        AuEq grade (g/t)                        2.54     >>          >>      >>       >>       >>         >>         >>

        Mining inventory AuEq (000oz)          1,752     >>          >>      >>       >>       >>         >>         >>

        Au recovery (% )                        89%      >>          >>      >>       >>       >>         >>         >>

        LOM throughput (Mtpa)                  1,950     >>          >>      >>       >>       >>         >>         >>

        Production AuEq Y1-5 (000oz pa)         153      154         >>      >>       >>       >>         >>         >>

        Production AuEq LOM (000oz)            1,559    1,565        >>      >>       >>       >>         >>         >>

        Mining & haul costs (C$/t mined)         27      >>          >>      >>       37       >>         >>         >>

        Proc & tailings costs (C$/t milled)      20      >>          >>      >>       >>       >>        24          >>

        G&A costs (C$/t milled)                  3.5     >>          >>      >>       >>       >>         >>         >>

        LOM C1 costs (US$/oz AuEq)              550     545          >>      >>      684       >>        729         >>

        LOM AISC (US$/oz AuEq)                  630     625          >>      >>      733       >>         >>         >>

        Total build capex (C$m)                 464      >>          >>      >>      327       >>        270         >>

        Total sustaining capex (C$m)            165      >>          >>      >>       99       >>         >>         >>

        Exchange rate (USD/CAD)                 1.31     >>          >>      >>       >>       >>         >>         >>

        Gold price (US$/oz)                    1,300     >>        1,850   2,050    1,850    2,050      1,850      2,050
        Project NPV post-tax (C$m)              311     311        781     948      788      955        787        954
        IRR post-tax (% )                       17%      >>        30%     34%      39%      45%        44%        50%
        Payback (years)                         3.90    4.25       3.00    2.75     2.50     2.25       2.25       2.00
        Source: SCPe

Quick Beaufor restart to fund up to 25% of Wasamac build
Beaufor produced more than 1.1Moz at >6g/t until it went on care and maintenance in mid-2019 due to a lack of
delineated reserves. With 30koz in reserves at 6.8g/t and a resource of 100koz at 7.8g/t (at US$1,280/oz)
(according to the 2017 InnovExplo report) we think that Beaufor is well positioned for C$5m restart in the next year
– capex is kept low through the use of Camflo mill 50km away; Camflo has historically processed Beaufor ore at
98% recovery. We model production of 112koz over 2.5 years at an AISC of US$739/oz. In the lead up to a restart,
we expect a 42,000m drill program targeting near mine extensions and growth at depth to return some splashy
bonanza-grade news flow. As exemplified by Kiena Deeps, there is always potential for Val d’Or underground
mines to turn up new ‘jewel boxes’ as well.
                 Figure 11: (A) Beaufor DCF outputs (B) drill targets at depth (C) near mine exploration
Beaufor Mine (100%)                    1300/oz 1850/oz          2050/oz
Mining inventory (000t)                   700        700          700
Au grade (g/t)                              5         5            5
Lom production (koz)                      112        112          112
LoM (years)                               4.0        4.0          4.0
Mill capacity (ktpa)                      538        538          538
Exploration spend (C$m)                   8.4        8.4          8.4
Restart capex (C$m)                         6         6            6
Sustaining capex (C$m)                     17         17           17
Mining & hauling costs (C$/t mined)        90         90           90
Processing costs (C$/t milled)             39         39           39
G&A costs (C$/t milled)                   4.0        4.0          4.0
C1 cost (US$/oz)                          790        790          790
AISC (US$/oz)                             934        934          934
Gold price (US$/oz)                      1,300      1,850        2,000
NPV5% (C$m)                                -5         30           40
IRR (%)^                                  0%        332%         438%
Source: SCP estimates, ^excludes exploration, Monarch

Other Val d’Or assets offer Monarch non-dilutive funding options
No stranger to M&A having bought and sold a number of operations in the past, Monarch retains this optionality
with McKenzie Break, Swanson and Croinor, having recently sold Fayolle to IAMGold for C$11m. In the shorter
term we expect these operations to provide similarly splashy news flow to Beaufor, with McKenzie Break step outs
                                                                                               Sprott Capital Partners Equity Research

10
Monarch Gold, 17 August 2020
returning 14m @ 14.3g/t and 7m @ 5.3g/t (both with a high grade core) in July. We add a nominal US$50/oz for
each of Monarch’s Abitibi assets (other than the modelled Wasamac and Beaufor):
McKenzie Break: 166koz @ 3.46g/t x US$50/oz = US$8.3m
Croinor: 274koz @ 8.9g/t x US$50/oz = US$13.7m
Swanson: 111koz @ 2g/t x US$50/oz = US$5.5m
Valuation
With so many strategic options, not to mentioned M&A take-out potential, we value the operations at build start on
a fully diluted basis for options, but don’t dilute for mine-build. We consider the DFS scenario with a LT gold price
of US$1,850/oz for a Wasamac NPV5%-1850-DFS of C$781m while Beaufor returns a NPV5%-1850-DFS of C$29m, adding
a nominal C$36m for “other assets”, C$18m in net cash and C$3m in cash from options takes our 1xNAV5%-1850-
DFS to C$867m or C$3.09/sh. We show sensitivities to the NPV below. Most importantly, even throwing very
aggressive mining figures at Wasamac still sees the NPV >C$500m.
Table 2. SOTP valuation for Monarch
SOTP project valuation* Asset value: 1xNPV project @ build start (C$m, ungeared)*
C$m O/ship NAVx C$/sh Project NPV (C$m)* $1750oz $1850oz $1950oz $2050oz $2150oz
Wasamac @ build start (1Q22) 781 100% 0.50x 1.39 10.0% discount 423 485 546 608 669
7.5% discount 545 617 688 760 831
Beaufor mine @ 1st pour (1Q21) 29 100% 0.70x 0.07
5.0% discount 696 781 865 948 1,031
Other assets 36 100% 1.00x 0.13
Ungeared project IRR: 28% 30% 32% 34% 36%
SCP net cash 2Q20 18 100% 1.00x 0.07 Project NPV (C$m)* $1750oz $1850oz $1950oz $2050oz $2150oz
Cash from options 3 100% 1.00x 0.01 Mining cost C$26.7/t 696 781 865 948 1,031
Asset NAV5% C$1850/oz 867 1.67 Mining cost C$36.7/t 610 695 780 864 948
*Shares diluted for options but not mine build P/NAV5% 2Q20 0.18x Mining cost C$46.7/t 522 608 694 779 864
Source: SCP estimates
Modelling Monarch on a fully-diluted (for mine build) basis is very difficult given the capex figure could well be far
lower on toll-treating basis, and thus required equity dilution cold be low. Also it is difficult to forecast the price at
which that is raised. Nonetheless, modelling C$223m debt, C$295m in equity raised at 0.5xNAV for Monarch and
C$30m Beaufor FCF gives our 480m FD share count. Netting of finance costs and central G&A, and discounting
to today takes our 1xNAV5%-1850-DFS to C$726m. This lifts to C$1bn by SQ23, or C$2.00/sh on a FF FD basis.
Table 3. SOTP valuation for Monarch
Group valuation over time^ SQ20 SQ21 SQ22 SQ23 SQ24 Geared company NAV diluted for mine build, net G&A and finance costs
Wasamac mine (C$m) 726 762 852 1,093 1,319 1Q22 1xNAV FF FD (C$m)^ $1750oz $1850oz $1950oz $2050oz $2150oz
Beaufor mine (C$m) 29 33 21 5 1 10.0% discount 617 695 773 850 927
7.5% discount 728 815 902 988 1,073
Other assets (C$m) 36 36 36 36 36
5.0% discount 862 959 1,055 1,152 1,248
Group G&A and finace (C$m) (87) (69) (65) (64) (54)
Geared project IRR: 27% 29% 32% 34% 37%
Net cash prior qtr (C$m) 4 - 75 (114) (149)
1Q22 1xNAV FF FD (C$/sh)^ $1750oz $1850oz $1950oz $2050oz $2150oz
Cash from options (C$m) 3 3 3 3 3 10.0% discount 0.97 1.18 1.39 1.61 1.83
NAV FF FD (C$m) 711 766 923 959 1,156 7.5% discount 1.30 1.54 1.79 2.05 2.31
FD shares in issue (m) 281 281 480 480 480 5.0% discount 1.71 2.00 2.29 2.59 2.89
1xNAV5%/sh FF FD (C$/sh) 2.53 2.73 1.92 2.00 2.41 ^Project NPV incl grp SG&A & fin. cost, +net cash; *diluted for mine build equity
Source: SCP estimates
Recommendation
We base our price target on our 1Q22 bulid-start 1xNAV5%-1850-DFS of C$867m or C$3.09/sh. We apply a 0.5xNAV
multiple for Wasamac and a 0.7xNAV for “quick start” Beaufor for a combined NAV multiple of 0.54x diluting shares
for options but not mine build. As such, we initiate with a BUY rating and a price target of C$1.65/sh. At the
current share price, we estimate Monarch is trading at just 0.16xNAV5%-2,000-DFS.
Risks
Modelling risk – mining dilution or poor modelling could drive lower than expected grades at Wasamac.
This is mitigated by the mine plan comprised entirely of reserves, with data from historic mining also.
Permitting risk – this is inherent in the project and will be until the project is fully permitted – this is expected
to be in 2H21.
Sprott Capital Partners Equity Research
11Monarch Gold, 17 August 2020
Operating costs – mining costs used in the study are relatively low and so we have evaluated the project
value should these costs increase. A 10% lift in mining costs sees NPV reduced by 4%. This risk is
mitigated / more than offset by current gold prices.
Capital costs – while costs were calculated at the DFS level and so largely based on quotes, many of
these costs would have changed since the study was done in 2018. A 10.5% contingency mitigates this
risk.
Catalysts
2H20-21: Beaufor and McKenzie Break drill results (SCPe ‘market grabbing’ grades likely)
4Q20/1Q21: Results of Ausenco study at Kidd Operations
1H21: Beaufor restarts
2H21: Wasamac permitted
1Q22: Wasamac build start
2Q24: Wasamac first pour
Sprott Capital Partners Equity Research
12Monarch Gold, 17 August 2020
Ticker: MQR CN Price / mkt cap: C$0.48/sh, C$129m Project PNAV today: 0.19x Asset: Wasamac
Author: B Salier / C Tonkin Rec / 0.4xNAV PT: BUY, C$1.67/sh 1xNAV 1 Q2 1 FF FD: C$2.53/sh Country: Canada: QC
Commodity price FY19A FY20E FY21E FY22E FY23E Total M&I&I resource
Gold price 1,953 1,878 1,850 Wasamac resource 34Mt 2.63g/t 2882koz
SOTP project valuation* Beaufor 0.4Mt 7.76g/t 98koz
C$m O/ship NAVx C$/sh Other assets 4.6Mt 3.74g/t 551koz
Wasamac @ build start (1Q22) 781 100% 0.50x 1.39 Total M&I&I resource 39Mt 2.82g/t 3531koz
Beaufor mine @ 1st pour (1Q21) 29 100% 0.70x 0.07 Funding: uses Funding: sources
Other assets 36 100% 1.00x 0.13 Mine build capex C$464mSCPe 2Q20 cash + options cash* C$13m
SCP net cash 2Q20 18 100% 1.00x 0.07 SCPe G&A to 1st Au C$13m Pre-Wasamac Beaufor CF C$32m
Cash from options 3 100% 1.00x 0.01 SCPe pre-production expl'n C$26m Mine debt @ 60% gearing C$223m
Asset NAV5% C$1850/oz 867 1.67 SCPe finance costs + wkg cap C$10m Mine build equity at 0.5xNAV C$295m
*Shares diluted for options but not mine build P/NAV5% 2Q20 0.16x Total uses C$512m Total proceeds C$563m
Asset value: 1xNPV project @ build start (C$m, ungeared)* *Cash from options expiring pre first pour Buffer C$50m
Project NPV (C$m)* $1750oz $1850oz $1950oz $2050oz $2150oz Share data Basic FD FF FD with build
10.0% discount 423 485 546 608 669 Basic shares (m) 270 281 480
7.5% discount 545 617 688 760 831 Ratio analysis (yr to Jun) FY19A FY20E FY21E FY22E FY23E
5.0% discount 696 781 865 948 1,031 Average shares out (m) 249.1 268.3 292.2 379.3 524.6
Ungeared project IRR: 28% 30% 32% 34% 36% EPS (C$/sh) 0.00 - 0.00 0.03 0.01
Project NPV (C$m)* $1750oz $1850oz $1950oz $2050oz $2150oz CFPS (C$/sh) - - - - -
Mining cost C$26.7/t 696 781 865 948 1,031 EV (C$m) 130.5 133.7 172.4 115.8 375.4
Mining cost C$36.7/t 610 695 780 864 948 FCF yield (%) - - - - -
Mining cost C$46.7/t 522 608 694 779 864 PER (x) 246.1x - 179.8x 15.8x 44.2x
NPV5 (C$m)* $1750oz $1850oz $1950oz $2050oz $2150oz P/CF (x) - - - - -
Min Inventory 21.5Mt 696 781 865 948 1,031 EV/EBITDA (x) 50.9x - 47.0x 4.7x 13.2x
Min Inventory 25.0Mt 799 891 982 1,074 1,164 Income statement (yr to Jun) FY19A FY20E FY21E FY22E FY23E
Min Inventory 30.0Mt 903 1,003 1,102 1,201 1,300 Net revenue (C$m) 31.7 1.1 19.6 54.9 57.7
*Project level NPV, excl finance costs and central SGA, discounted to build start COGS (C$m) 27.3 0.3 12.0 25.3 24.0
Group valuation over time^ SQ20 SQ21 SQ22 SQ23 SQ24 Gross profit (C$m) 4.4 0.8 7.6 29.6 33.7
Wasamac mine (C$m) 726 762 852 1,093 1,319 D&A, attrib (C$m) - - 0.3 3.2 6.3
Beaufor mine (C$m) 29 33 21 5 1 Admin (C$m) 5.1 2.6 3.6 4.0 4.4
Other assets (C$m) 36 36 36 36 36 Expensed exploration (C$m) 0.3 - - - -
Group G&A and finace (C$m) (87) (69) (65) (64) (54) Finance cost (C$m) 0.4 0.1 0.0 - 4.9
Net cash prior qtr (C$m) 4 - 75 (114) (149) Royalty (C$m) - - 0.3 0.9 0.9
Cash from options (C$m) 3 3 3 3 3 Forex, other (C$m) (3.6) (0.8) - - -
NAV FF FD (C$m) 711 766 923 959 1,156 Taxes (C$m) 1.7 0.0 2.5 10.0 11.5
FD shares in issue (m) 281 281 480 480 480 Net income (C$m) 0.5 (1.2) 0.8 11.5 5.7
1xNAV5%/sh FF FD (C$/sh) 2.53 2.73 1.92 2.00 2.41 Cash flow (yr to Jun) FY19A FY20E FY21E FY22E FY23E
Equity ROI from spot (% pa) 468% 152% 104% 91% EBIT (C$m) 2.6 (1.1) 3.4 21.5 22.1
Geared company NAV diluted for mine build, net G&A and finance costs Add back D&A (C$m) - - 0.3 3.2 6.3
1Q22 1xNAV FF FD (C$m)^ $1750oz $1850oz $1950oz $2050oz $2150oz Less tax + net interest (C$m) 2.1 0.1 2.6 10.0 16.4
10.0% discount 617 695 773 850 927 Net change in wkg cap (C$m) (3.6) (0.2) (1.2) (0.7) (1.8)
7.5% discount 728 815 902 988 1,073 Add back other non-cash (C$m) (3.8) (0.5) 0.4 0.4 5.3
5.0% discount 862 959 1,055 1,152 1,248 Cash flow ops (C$m) (7.0) (1.9) 0.3 14.3 15.5
Geared project IRR: 27% 29% 32% 34% 37% PP&E - build + sust. (C$m) 3.5 9.7 (9.4) (57.4) (200.4)
1Q22 1xNAV FF FD (C$/sh)^ $1750oz $1850oz $1950oz $2050oz $2150oz PP&E - expl'n (C$m) (8.6) (8.5) (18.2) (3.5) -
10.0% discount 0.97 1.18 1.39 1.61 1.83 Cash flow inv. (C$m) (5.1) 1.2 (27.6) (60.9) (200.4)
7.5% discount 1.30 1.54 1.79 2.05 2.31 Share issue (C$m) 2.9 6.4 - 145.0 -
5.0% discount 1.71 2.00 2.29 2.59 2.89 Proceeds from warrants (C$m) 0.1 0.0 - - -
^Project NPV incl grp SG&A & fin. cost, +net cash; *diluted for mine build equity Debt draw (repay) (C$m) (0.8) (0.7) (5.8) - 140.2
Wasamac prod. Y1 = Mar24 Y1 Y2 Y3 Y4 Y5 Cash flow fin. (C$m) 2.2 5.7 (5.8) 145.0 140.2
Gold eq production (000oz) 70 163 179 191 165 Net change in cash (C$m) (9.9) 5.0 (33.0) 98.4 (44.8)
C1 cost (US$/oz) 687 485 491 475 534 EBITDA (C$m) 2.6 (1.1) 5.5 15.8 27.9
AISC cost (US$/oz) 1,078 730 631 502 565 Balance sheet (yr to Jun) FY19A FY20E FY21E FY22E FY23E
AISC = C1 + ug sustaining capex, Y1 = 12M to Feb 2025 Cash (C$m) 6.4 10.1 (22.9) 75.5 30.7
Gold prod'n (LHS, 000oz) AISC (RHS, US$/oz Au) Acc rec., inv, prepaid (C$m) 4.1 2.0 2.8 3.6 5.4
300koz 1250/oz
PP&E + other (C$m) 62.1 67.8 95.1 152.8 346.9
Total assets (C$m) 73 80 75 232 383
200koz 1000/oz Debt (C$m) 17.3 15.0 9.2 9.2 154.3
Accounts payable (C$m) 4.2 2.4 2.0 2.0 2.0
Others (C$m) 5.9 6.0 6.0 6.0 6.0
100koz 750/oz
Total liabilities (C$m) 27.4 23.4 17.3 17.3 162.4
Sh'hlds equity + wrnts (C$m) 66.9 77.9 78.3 223.7 224.1
0koz 500/oz Retained earn'gs + rsvs (C$m) (21.7) (21.4) (20.6) (9.1) (3.4)
Y1 Y2 Y3 Y4 Y5 Liabilities + equity (C$m) 73 80 75 232 383
Source: SCP estimates
Sprott Capital Partners Equity Research
13Monarch Gold, 17 August 2020
Wasamac
Wasamac lies on ~760ha across three mining concessions and is located on the Abitibi greenstone belt in south
west Quebec, 15km south west of Rouyn-Noranda via tarred road. Rouyn-Noranda, a mining town with a
population of 41,000, provides various mining services, with daily flights from Montreal. The national railway line
links Wasamac to Kirkland Lake in the west and Canadian Malartic and Goldex (amongst others) in the east. A
25kV hydropower line runs past the property along the main road while a 125kV power line passes the project 8km
away. The project lies on flat Abitibi Plains, with -12°C winter temperatures meaning geochemical surveys are
conducted from May to October, with year round drilling and geophysical surveying.
Historical exploration started in 1936 led to a 60m shaft and one level of development. The main Wildcat zone was
discovered from there, with a 340koz @ 5.3g/t deposit outlined, accessed through a 55° angled shaft to 350m and
five underground levels developed in the late 1940’s. Commercial production began in the late 1960’s and saw
mining of 253koz @ 4.2g/t over six years in the Main and No. 1 zones before low gold prices led to closure.
Richmont took control in the 1980’s with sporadic drilling focussed on a dip extension and the shaft pillar, before
2002-2204 drilling led to a 1.3Mt @ 7g/t resource with a 4.45g/t cut-off. Additional drilling to 2012 outlined a 560koz
@ 2.56g/t M&I and 2Moz @ 2.6g/t inferred resource at a 1.5g/t cut-off – this fed into a PEA which contributed to
the current DFS and formed the basis for the current 2.6Moz M&I resource in the Main Zone and Zones 1-4.
The underground mine has a shaft to 420m with seven levels, and is currently flooded. A non-acid generating
tailings dump lies on the property. Monarch has the surface and water rights to the property. The EIA was launched,
and project notice given, in November 2019. Wasamac was selected as a pilot project for an interdepartmental
approach to mine permitting which aims to fast track permitting. As this is a pilot, we still expect an 18-24 month
permitting process. There is a 1.5% royalty payable to Richmont on commercial production.
Figure 12: (A) Wasamac location relative to nearby mills (B) Wasamac license area
Source: Monarch
Geology
Wasamac is hosted by a typical Abitibi assemblage of mafic to felsic Archean volcanics with diorite sills. The area
has produced >300million ounces of gold over the past 120 years. Locally the deposit is hosted in the Blake River
Group, the youngest volcanic sequence in the province, and is bounded by two faults to the north and south. The
group is characterised by folded cyclic andesite-rhyolite units underlain by sedimentary rocks and intruded by post-
tectonic or synvolcanic mafic gabbro-diorite sills. Two large granitoids lie just north of the Wasamac property and
cross through the volcanics while the Wasa shear zone (WSZ) separates the property into the south eastern mafic
portion and the northern felsic tuff/ rhyolite portion. The WSZ is an 80m wide, 50° north dipping, 265° azimuth,
reverse fault, is strongly hydrothermally altered and is related to most gold on the property. Mineral assemblages
within the WSZ consist of chlorite, carbonate, hematite, albite and sericite while gold is associated dissemination
of fine pyrite in altered portions.
Sprott Capital Partners Equity Research
14Monarch Gold, 17 August 2020
Figure 13: Local geology at Wasamac property
Source: Monarch
Mineral resource estimate
Surface and underground drilling delineated a 2.6Moz M&I resource and a 1.7Moz underground reserve. Additional
drilling, a reduced cut-off grade, removal of in-situ material around stopes and expansion to the east (Zone 4) in
the period from 2011 to 2017 saw 2Moz converted from inferred to indicated, while indicated grades increased
slightly but M&I grades dropped. Dilution ranges from 8% in the main zone to 15% in Zone 4 from the hanging and
foot wall, and 5% from backfill, for a total average dilution of 16.2% at grades of 0.4-0.8g/t while stope recovery
averages 86.4%.
Table 4. Resources and reserve for Wasamac
Tonnes Grade Ounces Tonnes Grade Ounces
(Mt) (g/t Au) (koz) (Mt) (g/t Au) (koz)
Measured resource 4.0 2.52 323 Proven 1.0 2.66 88
Indicated resource 25.9 2.72 2,265 Probable 20.4 2.56 1,679
Total M&I resource 29.9 2.70 2,588 Total reserves 21.5 2.56 1,767
Inferred resource 4.2 2.2 294 Source: Monarques, C$26.72/t mined mining cost, C$2.20/t milled tailings
Total resource 34.0 2.63 2,882 cost, C$17.79/t milled proc cost, 1.31 exchange rate, 88.2% rec.
Source: Monarques, resources include reserves, 1g/t cut-off grade,
US$1,500/oz gold price, USD:CAD $0.80
Mining and processing
Underground mining will be carried in five zones, the Main Zone (MZ) and Zones 1-4 (Z1-4). The method to be
used is top down long hole stoping with an integrated Rail-Veyor which will be fed by reclaim feeders and up to six
7t LHDs for a total 6,000tpd operation. Stopes are designed to be 20m high and 15m on strike with a minimum
mining width of 4m and will be filled with paste backfill. The MZ is a dip extension of previous mined workings and
contemplates a 30m sill pillar between historic and new workings.
Sprott Capital Partners Equity Research
15Monarch Gold, 17 August 2020
Rehabilitation and dewatering of the existing infrastructure will take place over 15 months while a 4x4m twin decline
is sunk, and three twin ramps access the various zones. The twin decline averages 7.5% gradient for a total of
~2.5km to just above MZ where three twin-ramps will provide access to each zone. The system sees workers and
supplies make use of the intake airway/ rubber tire ramp while the Rail-Veyor system uses the return airway. Z2
extends to 840m vertical depth, the deepest part of the operation.
The Rail-Veyor was selected so that ore could be transported under Highway 117 to surface infrastructure north
of the road while maintaining a low opex with capex similar to that of a shaft. High-speed development is planned
at 6m/day, for an expected two years from first blast to commercial production with shaft bottom reached in after
four years when full production is met. Total lateral development amounts to ~137,000m with ~7,000m of vertical
development. Other operations making use of the Rail-Veyor system are Agnico Eagle’s Goldex, Harmony Gold’s
Phakisa and Vale’s Copper Cliff.
Ore is relatively hard with BWi ~16kwh/t but less competent than host rock for a Geological Strength Index
(incorporates strength and joint sets) of ~50 versus ~64 in the hanging wall and footwall.
Figure 14: Wasamac mine layout
Source: Monarch
A number of processing scenarios exist, with the DFS based on the construction of a ~16Mw, 2.2Mtpa crush,
stockpile, two-stage 60um grind, 48 hr leach, carbon-in-pulp, cyanide destruction plant. Tailings that are not used
as backfill will be dry stacked after being pumped 6.3km along a private road and dewatered. Recoveries range
from 82% in Z1 to >92% in MZ and Z3. There is excess water in the process of 18m3/h. Other processing options
include tolling treatment at Agnico/Yamana JV Canadian Malartic or Glencore’s Kidd concentrator, both are less
than 100km away by train and so ROM can be transported at low cost.
Economics
Using the DFS scenario which includes the plant build, initial capex is spent over the two years of construction and
the first year of ramp-up. We model a two year build with first pour in 2024. Approximately half of all initial capex
is spent on the plant and tailings facility while lateral development makes up most of the sustaining capital
throughout the LoM. The company applied a broad 10.5% contingency.
Table 5: Wasamac DFS capital costs
Initial capital costs Total cost (C$m)
Processing plant and TMF 230
Mining costs 146
Owners costs and indirects 39
Contingency 49
Total initial capital costs 464
Total sust. capital costs 165
Source: Monarques
Sprott Capital Partners Equity Research
16Monarch Gold, 17 August 2020
Operating costs are kept low through the use of the Rail-Veyor system. Cash costs are in line with Agnico Eagle’s
Goldex operation which has made use of the Rail-Veyor system since 2017. Processing costs are generally in line
with peers with similar size plants and similarly hard ore.
Table 6: Wasamac DFS operating costs
Mining LOM operating costs Ave. cost (C$/t milled) Plant LOM operating costs Ave. cost (C$/t milled)
Lateral dev. (operating) 3.51 Reagents 6.02
Production 14.09 Grinding media 2.29
Mine services 4.67 Maintenance and parts 1.64
Technical services 1.43 Process consumables 1.43
Supervision and management 1.70 Personnel 2.81
Definition drilling 0.22 Utilities (Power and gas) 3.59
Equipment leasing payment 1.11 Total 17.79
Total 26.72 Other costs Ave. cost (C$/t milled)
C1 costs (US$/oz) 550 Tailings, waste and water management 2.20
AISC (US$/oz) 630 Site G&A 3.53
Source: Monarques
Figure 15 Wasamac DFS input sensitivities (A) US$1,300/oz (B) SPCe LT US$1,850/oz
40% 35%
FX/Au px/recovery 40% FX/Au px/recovery
30% 30%
Min. inventory 20% Min. inventory
20% 20%
15% Mining cost
10% 8% 10% 11% Mining cost
D NPV
D NPV
0% 9% 3%
Capex 0% -4% 4% Capex
-9% -3%
-10% -8% -10% -7%
-11%
-20% -20% -20%
-30% -30%
-35%
-40% -40%
10% worse 10% better 10% worse 10% better
Source: SCP estimates
Beaufor mine
Monarch’s 100% owned Beaufor Mine covers claims over 5.9km2 located just northeast of Val d’Or. The mine
operated from 1933 to 1951 and from 1993 to 2018, producing ~15koz in FY2018 before going on care and
maintenance in mid-2019. Historical grades average ~7.5g/t, and the mine has produced >1.1Moz from three
shafts. The company’s ex-Barrick Camflo mill is 50km away and has processed Beaufor feed at a ~98% recovery
since 1994. Surface infrastructure is in place and no additional permits are required to recommence operations.
Figure 16: Beafor mine and Camflo mill
Source: Monarch
Geology
Beaufor is an Archean orogenic deposit hosted in the Bourlamaque granodiorite batholith. Mafic dykes undercut
the granodiorite and are closely related to mineralisation particularly with regards to structure. Gold is hosted in
quartz-tourmaline filled shear-fractures with the granodiorite. Stacked veins are 5cm to 5m wide (with most 30cm
to 120cm wide) and generally strike north west to south east, dipping gradually towards the south west. Currently
resources stand at 100koz, although we flag that this was calculated at US$1,280/oz gold and a 3.95g/t-4.66g/t
cut-off (lower for long hole stoping, higher for room and pillar).
Sprott Capital Partners Equity Research
17Monarch Gold, 17 August 2020
Table 7. Resources and reserves at Beaufor
Tonnes Grade Ounces Tonnes Grade Ounces
(Mt) (g/t Au) (koz) (Mt) (g/t Au) (koz)
Measured resource 74.4 6.71 16 Proven 281.0 5.95 5.4
Indicated resource 271.7 7.93 69 Probable 111.5 7.05 25.2
Total M&I resource 346.1 7.67 85 Total reserves 392.5 2.42 30.6
Inferred resource 46.1 8.34 12 Source: Monarques, 3.95g/t - 4.66g/t cut-off, dilution 10-15% in LH,
CAD/USD 1.28, Aupx US$1,280/oz, 98% rec.
Total resource 392.2 7.76 98
Source: Monarques, resources exclude reserves, 3.95-4.66g/t cut-off,
Aupx US$1,280/oz, CAD/USD 1.28, min. 2.4m vein width
A 42,000m drill program will target near mine extensions as well as a depth extension with the goal of a restart in
12-18 months. A long-section showing existing development is presented below, with resource drilling targets
highlighted in the yellow-dashed box generally at the bottom of the decline. Reserve-conversion drilling is
targeted for higher up in the mine, with a blend of the two likely to support future production. While there is good
optionality on a Kiena Deeps style high-grade lode. Investors should reasonably expect a succession of high-
grade drill results from ongoing reserve conversion.
Figure 17: (A) Near mine drilling and (B) deep targets at Beaufor
Source: Monarch
Mining and processing
Beaufor was previously long hole stoped in steeper dipping areas (zone Q) and room and pillar in shallower dipping
areas (zone QH). A vertical shaft accesses the mine to ~700mbs where a decline extends to ~930mbs. A 2017
technical report noted 140kt of mining at 6.83g/t in zones Q, QH, C, 22 and CF5 before the expected closure 18
months later. Pre-closure mining was in line with this at 100ktpa with ore skipped to surface in 500t bins from
Perron shaft.
Figure 18: (A) Composite section and (B) long section of Beaufor mine
Source: Monarch
We model a restart in 2021 with 700kt processed over 4 years at an average of 5.2g/t for a total of 112koz of
production. Camflo mill, 50km away, will be used by the operation to process ore. The mill has a throughput
capacity of 1600tpd with a 92% availability, this amounts to ~135ktpq, significantly more than maximum ~100ktpq
Sprott Capital Partners Equity Research
18Monarch Gold, 17 August 2020
that we model. The plant consists of a crushing and grinding circuit as well as a Merril-Crowe system utilising
cyanidation and zinc powder precipitate. Beaufor has been using the plant since 1994 and recoveries are ~98%.
Economics
We expect restart costs of ~C$5-6m for the operation and think this is achievable on the basis that the mine recently
went into care and maintenance. We expect C$5m of this expenditure to come in the form of development capex
as new areas are accessed. Exploration costs of C$8.4m were attributed to corporate costs rather than the project.
We base mining costs on peers which use similar methods while processing costs were based on a sliding scale
from 2017 where C$/t milled is based on mill utilisation. There is a 3% NSR on the property (of which 2% can be
bought back)
Table 8: Beaufor mine economic analysis
Beaufor Mine (100%) 1300/oz 1850/oz 2050/oz
Mining inventory (000t) 700 700 700
Au grade (g/t) 5 5 5
Lom production (koz) 112 112 112
LoM (years) 4.0 4.0 4.0
Mill capacity (ktpa) 538 538 538
Exploration spend (C$m) 8.4 8.4 8.4
Restart capex (C$m) 6 6 6
Sustaining capex (C$m) 17 17 17
Mining & hauling costs (C$/t mined) 90 90 90
Processing costs (C$/t milled) 39 39 39
G&A costs (C$/t milled) 4.0 4.0 4.0
C1 cost (US$/oz) 790 790 790
AISC (US$/oz) 934 934 934
Gold price (US$/oz) 1,300 1,850 2,000
NPV5% (C$m) -5 30 40
IRR (%)^ 0% 332% 438%
Source: SCPe, ^excludes exploration spend
McKenzie Break
Monarch acquired 100% of the 326ha McKenzie Break (MB) project from Agnico Eagle for a total C$4.6m in 2017.
The property lies 35km of Val d’Or in the Abitibi region and is easily accessible by road.
Geology
The property lies on the Abitibi greenstone belt. Known gold mineralisation in the area occurs at the Pascalis
batholith contact in a shallow indenture. This indenture is underlain by mafic to felsic volcanics and is cut by quartz
diorite dykes, and likely contact metamorphosed given the highly anomalous magnetic signature. Mineralisation
occurs in three main zones all striking northwest, dipping at 20-25⁰ north east (i) Upper Zone (green), 1cm to 2m
(average 20-30cm) with free, coarse gold in subparallel quartz-chlorite ribbon veins, (ii) Mid Zone (orange), quartz-
carbonate-sericite schist (iii) South No.4 Zone – in non-magnetic diorite, 600m long in a N-S direction, >90m down
dip, grades of 1-3g/t over 3-6m, shallower dipping than other zones.
Figure 19: (A) Isometric of MB – 2018 (B) MB resource
Tonnes Grade Contained
(kt) (g/t Au) Au (koz)
Indicated reosurce (pit) 939.9 1.59 48
Indicated resource (UG) 281.7 5.9 53
Total M&I resource 1222 2.59 102
Inferred resource 574.8 3.46 64
Total resource 1796 2.87 166
Source: Monarques
Sprott Capital Partners Equity Research
19Monarch Gold, 17 August 2020
A step change came in the potential upside with deeper step-out drilling by Monarch in 2Q20. The company moved
toward the east, and down dip, with initial drilling returning an extremely strong 14m @ 14g/t and 7m @ 5.3g/t,
both with a high grade core. Our view: we think the initial drilling area could support perhaps 100koz. However, the
new drilling is very much a step change given the thickness and grade, which also make it eminently more
underground mineable than shallower stacked lodes. Simply taking a 20m radius around existing intercepts already
adds SCPe 50koz @ 11.3g/t. Looking geometrically at Figure 20A even 150m x 100m by an average 11m thick of
the three pierce points into the new zone adds 150koz at 10g/t. Make no mistake, we expect this to grow, but even
if it doesn’t, milling just this through Beaufor would generate ~C$140m of FCF before capex. High grades mean
small tonnes, and thus limited development capex and low opex. Given the asset is open in all directions, the great
irony is that this ‘third project’ could underpin the entire companies market cap right now.
Figure 20. (A) Plan map showing drilling and (B) recent drilling highlights of 14m @ 14g/t
Source: Monarch
Mining and processing
Two scenarios were considered for Mackenzie Break (i) a bulk low grade open pit targeting the upper zones and
(ii) an underground which would target deeper, narrower high grade zones. Given the recently discovered high-
grade zone at depth, we expect continued drilling to bottom out that resource / reserve potential. Processing could
be done at the 750tpd Merrill-Crowe Beacon Mill or at Camflo in conjunction/after Beaufor. Certainly a high-grade
underground could easily truck to either mill.
Valuation
We value McKenzie Break at a nominal US$50/resource oz for a total US$8.3m as part of a more holistic C$36m
for resources defined by the company outside our modelled mine plans. We eagerly await further drilling here,
which has every potential to drive a step-change in our valuation.
Sprott Capital Partners Equity Research
20You can also read