Value for Money Assessment for Cycling Grants - August 2014
←
→
Page content transcription
If your browser does not render page correctly, please read the page content below
Do not remove this if sending to pagerunnerr Page Title

Value for Money Assessment for
Cycling Grants

August 2014
The Department for Transport has actively considered the needs of blind and
partially sighted people in accessing this document. The text will be made
available in full on the Department’s website. The text may be freely
downloaded and translated by individuals or organisations for conversion into
other accessible formats. If you have other needs in this regard please contact
the Department.

Department for Transport
Great Minster House
33 Horseferry Road
London SW1P 4DR
Telephone 0300 330 3000
Website www.gov.uk/dft
General email enquiries FAX9643@dft.gsi.gov.uk

© Crown copyright 2014

Copyright in the typographical arrangement rests with the Crown.

You may re-use this information (not including logos or third-party material) free
of charge in any format or medium, under the terms of the Open Government
Licence. To view this licence, visit www.nationalarchives.gov.uk/doc/open-
government-licence/ or write to the Information Policy Team, The National
Archives, Kew, London TW9 4DU, or e-mail: psi@nationalarchives.gsi.gov.uk.

Where we have identified any third-party copyright information you will need to
obtain permission from the copyright holders concerned.
Contents
1.      Background ................................................................................................. 4
2.     Value for Money assessment ...................................................................... 6
     Background..................................................................................................... 6
     Overall Results ............................................................................................... 6
     Health Benefits ............................................................................................... 8
     Benefits of reduced Car use ........................................................................... 9
     Journey Ambience .......................................................................................... 9
     General Appraisal Assumptions...................................................................... 9
3.      Summary................................................................................................... 11
4.      Annex 1: Detailed results .......................................................................... 13
5.      Annex 2: Scheme impacts pro-forma ........................................................ 15

                                                           3
1. Background
1.1 The coalition agreement has set out the Government's commitment to
promote cycling and walking explicitly stating that it will 'Support
sustainable travel initiatives, including the promotion of cycling and
walking'. Demonstrating that support, in February 2013, the Department
for Transport (DfT) announced the Cycle City Ambition Grant and the
Cycling in National Parks Grant as a single fund of £42 million for capital
expenditure on cycling and walking infrastructure. Additional funding was
later identified to bring the total up to £94m.
1.2 The Cycle City Ambition Grant was formulated in order to support the
first two years of a transformational long term cycling strategy. This was
linked to the 'City Deals' wherein the Government had been talking to
individual cities to negotiate tailored city deals with the aim of unlocking
economic potential. The fund was open to the major cities involved in this
initiative, with these cities invited to set out ambitious long term plans to
increase cycling.
1.3 The Cycling in National Parks Grant bidding process was open to all nine
National Parks in England. The focus for investment was to support
increases in cycle trips to, from and around National Parks, linking
communities and supporting the sustainable tourism economy.
1.4 The bids from cities for the Cycle City Ambition Grant detailed compelling
proposals to increase cycling in ways that would support local economic
growth, reduce carbon emissions and improve the health and wellbeing
of their residents. The National Parks submitted proposals for a range of
facilities, including new and improved cycle routes and better integration
between cycling and other modes of travel.
1.5 The Prime Minister announced the successful schemes in the briefing on
the Government's ambition for cycling on August 12th 20131. Eight2
cities were awarded a total of £77m and four3 National Parks received
£17m of funding. Including local contributions, these twelve schemes
represent a total of just below £150m investment in cycling.
1.6 30bids were received and the decision on which to invest in was based
on assessment of each submitted bid's business case. Officials in the
Department evaluated all submissions against each of the five elements
1 https://www.gov.uk/government/news/government-shifts-cycling-up-a-gear
2 The cities that received funding were: Birmingham, Bristol, Cambridge Leeds, Manchester, Newcastle,
Norwich and Oxford
3 The National Parks that received funding are: Dartmoor, New Forest, Peak District and South Downs
4of The Department's transport business case: strategic, economic,
financial, management and commercial cases.
1.7 This note summarises the analysis and evidence included in the
economic cases of the successful bids and briefly explains the methods
used to support the analysis. This includes the final benefit cost ratios
(BCRs), the main types of benefits behind both cities and National Parks
schemes as well as the assumptions used within the appraisal.
52. Value for Money assessment
Background
2.1 Bidders were required to submit information on the impacts expected
from their proposals and to set out the evidence base for these
estimates. The bidding guidance encouraged the use of proportionality
by focussing on the benefits (or disbenefits) likely to be most significant.
2.2 To minimise the burden on bidders, The Department published a scheme
impacts pro-forma in which bidders were required to set out the basic
information that would enable assessment of all bids in a consistent
manner. The pro-forma is attached at Annex 2.
2.3 Bidders were further asked to submit an economic appraisal report
explaining the evidence used. Some bidders provided fully worked up
appraisals while others simply submitted the pro-forma with supporting
evidence as required. Where appraisals were submitted, it was not
always clear that consistent assumptions had been used.
2.4 Economists within the Department scrutinised the submitted pro-formas,
the evidence base and were applicable the submitted appraisals. The
predicted outcomes were benchmarked to those observed from existing
schemes and between the bids and submitted data compared to
publically available sources to ensure realistic values were used. Where
the submitted estimates (e.g. on existing and additional cyclists) were
found to be credible, the information was used alongside the
methodologies recommended in WebTAG unit A5-1 (active mode
appraisal) to monetise the estimated impacts and to calculate cost
benefit ratios.
2.5 WebTAG A5-1 provides approaches for monetising health and
absenteeism benefits from increased physical activity, journey ambience
impacts, direct road safety impacts and the benefits associated with
mode shift away from car use (environmental, decongestion, indirect
road safety and indirect taxation).
Overall Results
2.6 This section summarises the results of the assessment separately for the
cities and National Parks that received funding. Not all bids included
evidence against all benefits. Rather than seeking alternative sources of
evidence, benefits were not estimated in these cases even if this clearly
resulted in underestimating the total merits of the proposal. While, for
6example, the Oxford scheme shows no decongestion benefits, the
scheme is likely to lead to reduced motorised traffic through modal shift.
However, as it was not a key focus for the scheme, no evidence had
been submitted. Annex 1 provides details of estimated benefits on a
scheme by scheme basis.
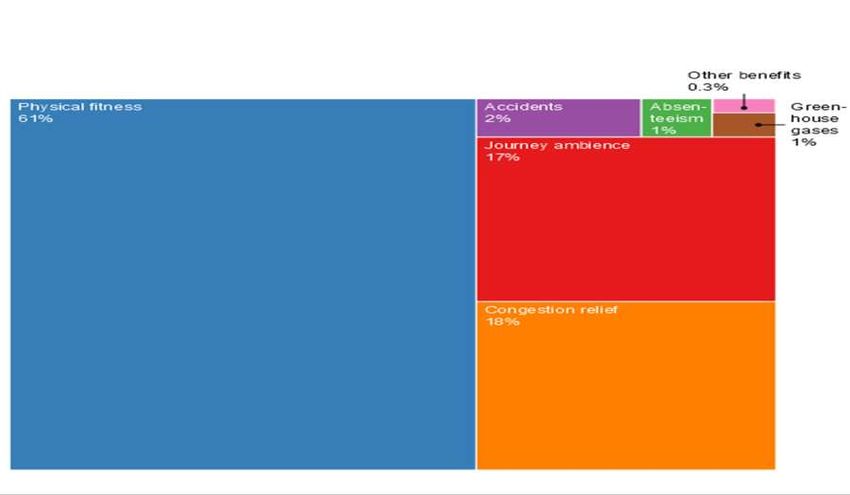
2.7 Figure 2.1 shows the overall split of benefits for funded Cycle City
Ambition schemes and the National Park schemes.
Figure 2.1: Split of Total Benefits for Cycling Grant
2.8 Over 60% of benefits estimated for the Cycle City Ambition Grant come
from increased physical fitness. The four National Park schemes similarly
show a majority of benefits derived from increased physical activity.
While the second most substantial driver of benefits is decongestion in
cities, journey quality is more important in the National Parks.
2.9 Tables A1.1 and A1.2 in the annex provides the same data individually
for each of the twelve schemes funded. Across the different cities the
balance of benefits varies considerably, depending on the particular
focus of the intervention. Both decongestion and road safety benefits
provide over half the total in individual schemes.
2.10 Across the National Parks, however, journey quality and health benefits
consistently provide for at least 75% of the benefits estimated, while the
other categories are less important drivers here.
2.11 As a package, the Cycle City Ambition Grant is expected to deliver
around five pounds of benefits for each pound invested with individual
7schemes' benefit cost ratios (BCRs) ranging from just above 2:1 to in
excess of 30:1.
2.12 The four National Park schemes are as a package expected to provide
more than seven pounds of benefits per pound invested, with the
individual BCRs ranging between 3:1 and 13:1.
2.13 The following sections discuss the different types of benefits and explain
some of the assumptions underlying their monetisation.
Health Benefits
2.14 In both cities and National Parks, the largest share of expected benefits
comes from the positive impact increased physical activity has on health.
The monetisation of these benefits follows the World Health
Organisation's HEAT tool (health economic assessment tool)4.
2.15 The HEAT tool is based on evidence showing that people who are more
physically active have a lower rate of premature death when compared to
less active individuals. The tool provides a formula to translate increases
in cycling or walking (minutes of activity) into a reduction in the
individual's risk of premature mortality.
2.16 Across all users of a scheme this reduced risk can be expressed as the
number of lives saved due to the intervention. Using values for the
avoidance of a fatality from WebTAG (unit 4.1) allows monetisation the
benefit.
2.17 The HEAT tool uses a linear relation between activity level and risk
reduction. This suggests that small amounts of daily activity have the
same benefits as less frequent but more substantial efforts.
In practice this means that one does not need to know if the new cyclists
are few but regular cyclists or many people cycling less frequently. This
was important in assessment of the bids, as it allowed the same method
to be used for schemes targeted at (frequent) commuters in cities as for
(occasional) tourists in National Parks.
2.18 This approach only represents the benefit to society of reduced
premature mortality. It does not account for the benefit of improved
health itself (reduced morbidity) to either the individual, their employer or
the NHS. The evidence on this is still developing.
2.19 The estimated benefit from the grants is further limited to the additional
activity on the particular cycle routes directly benefitting from the
investment. However, it is likely that people who take up cycling due to
these improvements will become more confident in general and start
cycling on other routes or for other purposes as well. People trying out
4 The HEAT methodology is integrated within WebTAG unit A4.1.
8cycling while on holiday in the National Parks might for example take up
cycling for commuting as a result of a positive experience.
2.20 Finally it is assumed that new users of cycling infrastructure undertake
more physical activity as a result of the scheme rather than reduce their
activity levels elsewhere (e.g. stop going to the gym).
Benefits of Reduced Car Use
2.21 The next most significant benefit is decongestion and the related
environmental benefits. Not surprisingly this is significantly more
important in cities that experience higher level of car use and congestion
to start with. Not all bids included estimates for how many car journeys
might be taken off the road.
2.22 The reduction in car traffic expected also drives the forecast of noise,
greenhouse gas and air pollution benefits as well as the indirect tax
impacts. Reduced car traffic is also expected to reduce accidents.
WebTAG unit A5.4 provides standard values for each of these impacts
for every vehicle Km taken off (or added to) the road.
2.23 Where schemes include measures explicitly addressing road safety
issues, additional evidence on the reduction in accident risks has been
considered along with data on historic incidents. WebTAG unit 4.1
contains suggested values for monetising the reduction in future
accidents.
Journey Ambience
2.24 Journey ambience benefits occur when a scheme provides an improved
environment for cyclists to enjoy during their journey, compared to the
situation before the changes. Examples of this might include a more
scenic route but more typically represent a feeling of improved safety due
to being physically segregated from motorised traffic or having a
smoother ride surface. Similarly secure cycle storage or shower facilities
and lockers at their workplace improve the quality of cyclists' experience.
2.25 The proposals received from the National Parks typically scored more
highly on journey ambience benefits as in many cases the improved
routes are generally free from motorised traffic and provide a step
change compared to the current situation.'
General Appraisal Assumptions
2.26 Our analysis is based on the assumption that the infrastructure delivered
by these grants has a useful life of at least 30 years. Benefits and costs
have been estimated over that period and discounted to 2010 values
using the 3.5% discount rate recommended in WebTAG and the
9Treasury's Green Book5, the guidance for appraisal in Central
Government.
2.27 The financial costs estimates provided have been converted into market
prices and discounted and deflated to 2010 values and prices. An
optimism bias uplift of 15% has been applied to account for likely cost
escalation. This is a standard approach for schemes that are still fairly
early in the design and planning process.
2.28 The appraisal considers all costs and benefits to society. In order to
compare costs and benefits in the form of BCRs, we consider costs to
the wider transport sector (i.e. both Central and Local Government) as
costs in the denominator, while private sector contributions and indirect
tax losses are accounted for as negative benefits in the numerator.
5 https://www.gov.uk/government/publications/the-green-book-appraisal-and-evaluation-in-central-
governent
103. Summary
3.1 The combined BCR for the funding stream as a whole, both under Cycle
City Ambition Grant and Cycling in National Park Grant, is 5.5:1 which
suggests that for every £1 of public money spent, the funded schemes
provide £5.50 worth of social benefit. The analysis suggests that non-
monetised impacts are likely to be minor6 and overall positive. The grants
are therefore considered to deliver very high value for money.
3.2 Figure 3.1 summarises the previous chart showing the overall balance of
benefits with around 60% accounted for by improved physical fitness and
roughly equal shares for journey quality and decongestion.
3.3 The data from the evaluation of the Cycling Demonstration Towns
programme has previously been used to estimate a 30 year BCR range
for that programme of between 4.7 and 6.17. The appraisal evidence
from the cycle grants summarised here confirms this, with the overall
BCR in the middle of that range. This provides further confirmation that
targeted investment into cycling can bring very strong returns to society.
6 Apart from the likely additional benefits of increased physical activity not accounted for within the HEAT
methodology.
7 http://webarchive.nationalarchives.gov.uk/+/http:/www.dft.gov.uk/cyclingengland/site/wp-
content/uploads/2010/02/091223-cdts-bcr-analysis-final-edit.pdf
11Figure 3.1: Split of Total Benefits for Both Grants
124. Annex 1: Detailed results
A.1 The table A1.1 below provides the detailed benefits estimated and the
resulting benefit cost rations for the eight Cycle City Ambition schemes.
Table A1.1: Monetised benefits for funded schemes under the Cycle City Ambition
Grant ('000£)
Birming Cam Manches New Norwic
ham Bristol bridge Leeds ter castle h Oxford Total
Noise 46 979 36 123 193 0 0 0 1,378
Local Air Quality 7 489 6 3 915 0 0 0 1,420
Greenhouse Gases 1,086 215 855 364 77 127 0 0 2,723
Journey Ambience 15,353 2,226 31,929 35,538 11,881 6 1,954 494 99,381
Accidents 741 3,026 583 6,096 1,932 0 5,902 728 19,008
Physical Fitness 33,387 58,540 169,719 13,434 149,765 22,756 1,727 14,884 464,212
Absenteeism 1,735 0 2,984 693 0 0 99 774 6,285
Congestion relief 7,054 66,961 5,554 15,177 49,784 4,418 473 0 149,422
Indirect Taxation -1,656 -2,877 -1,304 -1,806 0 0 0 0 -7,644
Third Party
contribution -500 0 -5,023 0 0 0 0 -60 -5,582
Present Value 57,252 129,559 205,339 69,622 214,545 27,307 10,156 16,820 730,602
Benefits
Present Value 25,041 31,800 5,742 32,822 30,024 11,812 4,285 1,017 142,543
Costs
BCR 2.3 4.1 35.5 2.1 7.1 2.3 2.4 16.5 5.1
A.2 Table A1.2 provides the same data for each of the four National Park
schemes funded.
Table A1.2: Monetised benefits for funded schemes under the Cycling in
National Parks Grant ('000£)
Dartmoor New Forest Peak South Total
District Downs
13Noise 16 0 82 1 99
Local Air Quality 3 0 17 0 21
Greenhouse Gases 377 0 1,928 12 2,318
Journey Ambience 24,897 3,918 8,511 23,866 61,192
Accidents 257 0 1,315 8 1,581
Physical Fitness 62,128 7,207 28,082 1,916 99,332
Absenteeism 1,866 377 236 71 2,549
Congestion relief 2,452 0 12,524 81 15,057
Indirect Taxation -576 0 -2,941 -19 -3,536
Third Party contribution -2 -3 -1 -277 -282
Present Value Benefits 91,419 11,499 49,754 25,660 178,331
Present Value Costs 6,910 3,985 7,693 5,520 24,109
BCR 13.2 2.9 6.5 4.6 7.4
145. Annex 2: Scheme impacts pro-
forma
Figure A2.1: Split of Total Benefits for Both Grants
15You can also read