Value of Shear Wave Elastography in Liver Cirrhosis
←
→
Page content transcription
If your browser does not render page correctly, please read the page content below
Annals of R.S.C.B., ISSN:1583-6258, Vol. 25, Issue 6, 2021, Pages. 15204 - 15215
Received 25 April 2021; Accepted 08 May 2021.

                                  Value of Shear Wave Elastography in Liver Cirrhosis
              Dr. Ahmed MahmoodKhudir, 1 Dr.WassanMoujedAbdAlzahra, 2 Dr.Atheer Adnan Fadil. 3
                  1
                   M. B. Ch .B, Residents doctor of Radiology Department of Radiology, Baghdad Teaching
                                              Hospital/Medical city Complex.
                 2
                   M.B.Ch.B , F.I.B.M.S, Specialist radiologist, Department of Radiology, Baghdad Teaching
                                               Hospital/Medical city Complex
                 3
                   M.B.Ch.B , D.M.R.D, F.I.B.M.S, Specialist radiologist Department of Radiology, Baghdad
                                          Teaching Hospital/Medical city Complex
                                    Corresponding author: Dr.WassanMoujedAbdAlzahra
                                             Email: wassan.mojid@yahoo.com.

              Abstract:
              Background: Chronic liver disease associated with viral hepatitis (mainly hepatitis B and C) or
              other etiologies, is clinical problem. It can cause various parenchymal liver injuries, lead to
              development of liver fibrosis and its various complications, from those portal hypertension and
              hepatocellular carcinoma being the most important. Liver biopsy is the most commonly used
              method for the diagnosis of liver fibrosis. The biopsy specimen size varies from one to three
              centimeters in length and between one to two millimeter in diameter, therefore the sample
              represents 1/50000 of all liver tissue.Objective: To assess the diagnostic value of two-
              dimensional shear wave elastography in evaluation of liver fibrosis.Patients and method: A
              prospective study included one hundred patients, fifty patients clinically confirmed as had liver
              fibrosis, the other fifty patients were normal (taken randomly with no history of liver disease and
              have normal ultrasound), the age of patients ranging from 20-55 years old. This study is single
              hospital study done in Baghdad teaching hospital in medical city, from November 2019 to march
              2020.Results: The shear wave elastography measurements value in liver fibrosis was 11.165 kPa
              (range 3.8 to 23 kPa), whereas the median liver elasticity for normal subjects was 4.885 kPa
              (range 3.2 to 7.2 kPa) . A significant correlation was found between shear wave elastography and
              fibrosis (p=0.0006) with sensitivity of 80%. A significant correlation also seen between shear
              wave elastography and exclusion of fibrosis (sensitivity 76%) (sensitivity 76%) (p= 0.003).
              Conclusion: Shear wave elastography examination is a promising noninvasive method for the
              evaluation of liver fibrosis, with good diagnostic performance
              Keyword: liver cirrhosis, two-dimensional shear wave elastography, noninvasive method

              Introduction:
              Chronic liver disease associated with viral hepatitis (mainly hepatitis B and C) or other
              etiologies, is clinical problem (1). It can cause various parenchymal liver injuries, lead to
              development of liver fibrosis and its various complications, from those portal hypertension and
              hepatocellular carcinoma being the most important (2). Liver biopsy is the most commonly used
              method for the diagnosis of liver fibrosis (3). The biopsy specimen size varies from one to three
              centimeters in length and between one to two millimeter in diameter, therefore the sample
              represents 1/50000 of all liver tissue (4). However, the biopsy is an invasive procedure with
              secondary effects, and about 1- 3% of patients may need hospitalization for complications (5).
              The mortality rate among patients following liver biopsy is approximately 1 in 10000 to 1 in
              20000, thus it cannot be repeated frequently to monitor liver fibrosis (6). Moreover, biopsy

               http://annalsofrscb.ro                                                                      15204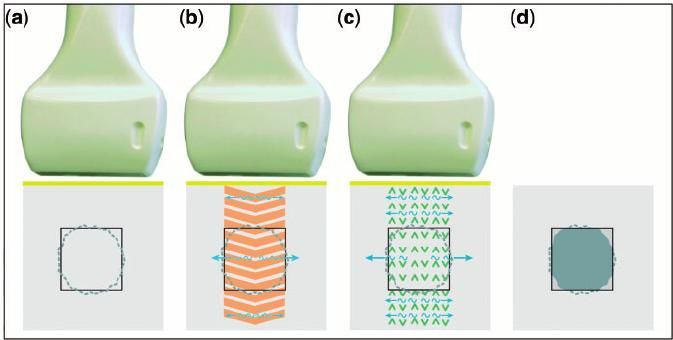
Annals of R.S.C.B., ISSN:1583-6258, Vol. 25, Issue 6, 2021, Pages. 15204 - 15215
Received 25 April 2021; Accepted 08 May 2021.

              sampling error and sample size are major sources of bias during liver fibrosis assessment (7).
              Therefore, there is increasing interest in developing new, non-invasive methods to evaluate
              chronic liver disease as an alternative to biopsy, with focus on elastographic methods. 2
              Ultrasound imaging plays increasing role in the diagnosis, monitoring and decision of therapy in
              chronic liver diseases (8).
              It has several clinical indications (9):
              1. morphological examination of the liver parenchyma.
              2. assessment of the risk of development of chronic disease by investigating the signs of
              dysmorphism and /or portal hypertension.
              3. detecting and characterizing lesions in the liver.
              4. monitoring local treatments ( i,e percutaneous radiofrequency )
              5. assessing treatment response. Conventional ultrasound cannot differentiate accurately the
              stages     of     liver     fibrosis     which   is    considered      limitation   to    ultrasound
              (10)
                  .ShearwaveelastographyPrinciple’s shear wave elastography was introduced in 2005 on the
              diagnostic imaging apparatus, called Aixplorer. It depends on measurement of the shear wave
              propagation speed in soft tissue.itdoes not require external vibrator to generate the shear wave.it
              is based on the generation of radiation force in the tissue to create the shear wave. The ultrasound
              probe of the device produces a very localized radiation force deep in the tissue of interest (11). An
              acoustic radiation force is focused at successively greater depths on an axial line to produce
              multiple sequential spheric wave fronts. These interfere constructively to create a Mach cone
              with greater displacement magnitudes than those produced by the individual wave fronts. By
              analogy with supersonic planes, the Mach cone is produced because the rate of sequential wave
              front production is greater than the speed of the resulting shear waves. In the commercial
              implementation of shearwaveelastography, several Mach cones are produced at different lateral
              positions of the image. An ultra-high frame rate (up to 15,000 images per second) is used to scan
              the entire imaging plane in one acquisition with high temporal resolution. The combination of
              Mach cone generation and fast imaging allows real-time generation of elastograms. The results
              are reported as meters per second or converted to the Young modul in kilopascals (12). A
              comparison of two consecutive ultrasound images allows the measurement of displacements
              induced by the shear wave and creates a movie showing the propagation of the shear wave whose
              local speed is intrinsically linked to elasticity. The propagation speed of the shear wave is the
              estimated from the movie that is created and two-dimensional color map is displayed, for which
              each color codes either the shear wave speed in meters per second (m/s), or the elasticity of the
              medium in kilopascals (kPa) This color map is accompanied by the anatomic reference gray
              scale (or B mode) image.this quantitative imaging technique is a real time imaging mode.
              Quantitative measurements can be performed in the color window by positioning one or more
              region of interest, called Q –Box. The Q-Box are variable in size (from 3 mm2 to 700 mm2)(13).
              Measurements can be performed retrospectively from the saved image or cineloop. The
              measurements provided by Q-Box are the mean, standard deviation, and minimum and
              maximum elastography values. Results are given in m/s or kpa(13). Figure 1.

               http://annalsofrscb.ro                                                                       15205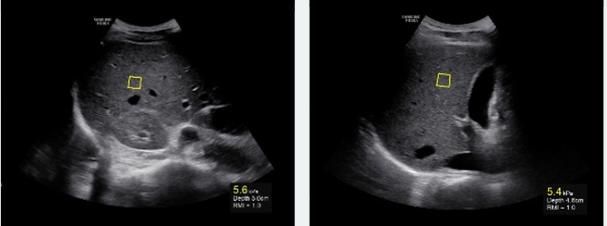
Annals of R.S.C.B., ISSN:1583-6258, Vol. 25, Issue 6, 2021, Pages. 15204 - 15215
Received 25 April 2021; Accepted 08 May 2021.

              Figure 1: schematic illustration of shear wave imaging .(a) an elastography region of interest
              (black box) is placed over the liver .(b) high intensity acoustic impulse (orange arrows) are
              transmitted to the tissue , which induce shear waves (blue) .(c) diagnostic impulses (green arrows
              ) track shear wave propagation(14) .

              Liver stiffness evaluation with S-Shearwaveelastography Samsung’s S-Shearwave is a
              technology that detects the velocity of the shearwave propagated through a targeted area in liver
              tissue, then displays the numerical measurement of stiffness in kPa or m/s. The ―shearwave is a
              perpendicular wave produced as a result of multiple, focused, highintensity, short-duration
              acoustic pulses generated lateral to the area of interest (Fig. 3). The shearwaves are tracked as
              they travel through this region of interest. The shearwave propagation speed is used to calculate
              the stiffness of the tissue. Shearwave displays the numerical measurement of elasticity (stiffness)
              as either shearwave velocity (m/s) or as Young’s Modulus in kPa. Shearwaves travel faster in
              stiffer tissues. In the liver, the loss of elasticity corresponds closely to the amount of
              hepatocellular damage (fibrosis).(15)

              Figure 2: Graphic depiction of an ultrasound pulse (blue arrow)and resultant shear waves (red
              perpendicular waves )used during shear wave elastography . The shear waves propagate through
              the region of interest (green box) to determine the stiffness of the liver tissue /lesion(16).

               http://annalsofrscb.ro                                                                      15206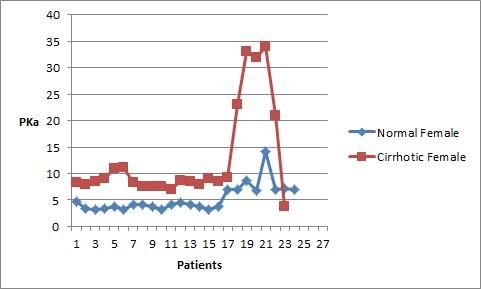
Annals of R.S.C.B., ISSN:1583-6258, Vol. 25, Issue 6, 2021, Pages. 15204 - 15215
Received 25 April 2021; Accepted 08 May 2021.
Shearwave on Samsung’s HS70 is conducted on the liver by first using B-Mode imaging to
locate the area of interest. The Region of Interest (ROI) box is then placed in an area of the right
lobe of liver and several S-Shearwave measurements are taken (Fig. 3). The measurements are
conducted while the patient suspends respiration. The region of interest box should not be placed
in or immediately lateral to any vasculature. The velocity of the shearwaves are used to calculate
the stiffness (kPa) of the targeted area within the ROI.(15)
Figure 3: several shear wave measurements taken on a patients liver .After each sample , shear
wave indicates the stiffness measured in kilopascal , the depth of the region of interest ,and the
reliable measurement index (RMI)(16)
The average of the measurements is used to estimate the degree of liver stiffness (Fig. 4).
Additionally, the Reliability Measurement Index (RMI) and Variation Range (VR) are provided
in the Shearwave Profile. The RMI (reliability of the measurement) is a quality control parameter
that is calculated by the weighted sum of two factors: the residual of the wave equation, and the
magnitude of the shearwave. Therefore, high RMI values are strongly correlated with
reproducible measurements. An RMI of 0.0 would indicate significant error, whereas an RMI of
1.0 would indicate no error). While in the Shearwave Profile display, the user can easily deselect
any unreliable measurements depending on its RMI (16).
Figure 4: the shear wave profile graphs the measurements including kPa, RMI, percentiles , and
median values. Additionally , an interquartile range (IQR)of all successful measurements of
median value is calculated(16)
Advantages (14)
it is an easy,painless, rapid technique
http://annalsofrscb.ro 15207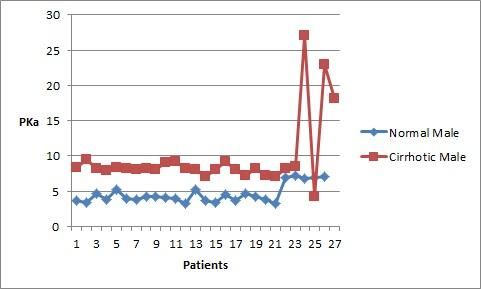
Annals of R.S.C.B., ISSN:1583-6258, Vol. 25, Issue 6, 2021, Pages. 15204 - 15215
Received 25 April 2021; Accepted 08 May 2021.
good intra-operator reproducibility with an intra-class correlation coefficient of 0.95 when
measurements are taken at the same day and 0.84 when they are taken at different days by same
operator.
goodinteroperatorreproducibility.
the result is immediately available.
shear wave elastography is incorporated onto a conventional ultrasound diagnostic imaging
device, which allows the combination, in one exam of quantitative elastography assessment of
the liver fibrosis and /or tumor after the morphological ultrasound examination of the liver (to
investigate for signs of cirrhosis, portal hypertension and to identify focal lesions).
quantitative assessment of soft tissue elasticities in kPa or in m/s.
real-time two-dimensional map of tissue elasticities.
visual control of measurement location with the ability to avoid vascular structures when
performing acquisition, study regions of interest (area of steatosis, liver with tumor) and
visualize the special distribution of fibrosis , correlate elasticity to the tissue architecture seen
(necrosis , steatosis), study the right and left lobe of the liver(16) .
the ability to select measurement depth, and an area free of shear wave elasticity artifact (due to
vessels,Glisson’scapsule, or other lesions).
the ability to perform several measurements retrospectively on saved images on the device.
the ability to choose the size of the Q-Box. results expressed and displayed in kPa or m/s
ultrasound based elastography samples a liver volume 150 times largest than a biopsy specimen
(17)
.
Aim of the study:
To assess the diagnostic value of two-dimensional shear wave elastography in evaluation of liver
fibrosis.
Patients and methods
Patients
This is a prospective study included one hundred patients, fifty patients clinically confirmed as
had liver fibrosis, the other fifty patients were normal (taken randomly with no history of liver
disease and have normal ultrasound), the age of patients ranging from 20-55 years old. This
study is single hospital study done in Baghdad teaching hospital in medical city, from November
2019 to march 2020. All the patients underwent a general abdominal ultrasound and shear wave
elastography examination. Inclusion criteria for the cirrhotic patients is patient with known
cirrhosis according to laboratory tests with increase liver enzyme level, exclusion criteria include
association of the cirrhosis with ascites.inclusion criteria for normal patients include no history
of liver disease and normal ultrasound study, exclusion criteria include any history of liver
diseases or hepatitis.
http://annalsofrscb.ro 15208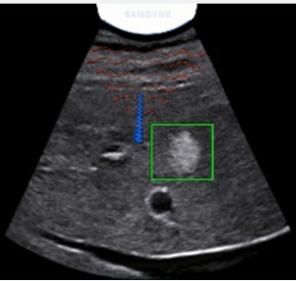
Annals of R.S.C.B., ISSN:1583-6258, Vol. 25, Issue 6, 2021, Pages. 15204 - 15215
Received 25 April 2021; Accepted 08 May 2021.
Figure 5: illustrate number of patients according to gender
Figure 6: number of patients percent
Shearwaveelastography examination
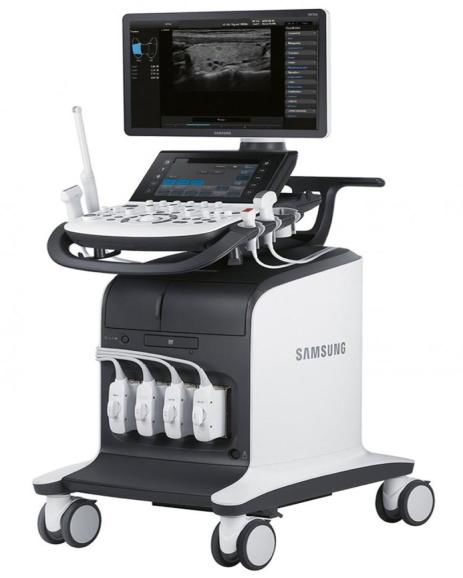
Shear wave elastography examination was performed using Samsung HS70A equipment (figure
7).the patient was lying in the lateral decubitus position with the right arm extended above the
head in aim to get access to the right hypochondrium and to increase the intercostal acoustic
shadow. The probe was placed parallel to the intercostal space with gel applied sufficiently to
minimize rib shadowing.
http://annalsofrscb.ro 15209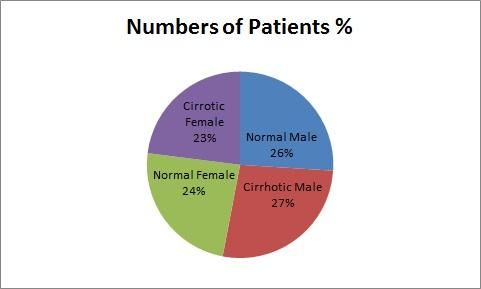
Annals of R.S.C.B., ISSN:1583-6258, Vol. 25, Issue 6, 2021, Pages. 15204 - 15215
Received 25 April 2021; Accepted 08 May 2021.

                                                      Figure 7: Samsung HS 70 apparatus

              The region of interest (ROI) with a box size of 1-2cm was positioned with in the liver
              parenchyma under two-dimensional B mode using depth of at least 2cm below the capsule of the
              liver in the right lobe, taking care to avoid including large vasculature or biliary structures.
              During scanning no pressure was applied to the liver, and the patient was asked not to breath for
              a few seconds to minimize motion artifacts.
               Measurements of liver stiffness were performed on same area of liver parenchyma. The
              equipment listed the shear wave velocity (m/s) in the region of interest as well as the depth at
              which the measurements was performed. The tissue stiffness is computed in kilopascal (kPa), the
              shear wave velocity (v) was converted into shear Modulus G= t/y, in which the t is the shear
              stress and y is the shear strain based on relationship G = pv2, in which the p is the density of the
              tissue .
               Ten to fifteen measurements were collected at the same location and reports was generated
              when success rate of at least 80% was obtained
              Statistical analysis
              Data are expressed as means ± standard error. Statistical analysis was performed using two-way
              analysis of variance (ANOVA) and then subjected to the least significant difference test (LSD).
              The significance level considered was (p < 0.05). table 1

              Table 1:Measurements of liver stiffness according to gender in the studied groups
                                    sex        N          Control group       N              Fibrosis group
                                                                      aA
                                  male        26           4.57±0.25         27                 9.63±0.95aB
                                female        24           5.21±0.51aA       23               12.70±1.88bB
              M±SE=mean+ standard error
              Different small letters represent significant differences within groups (P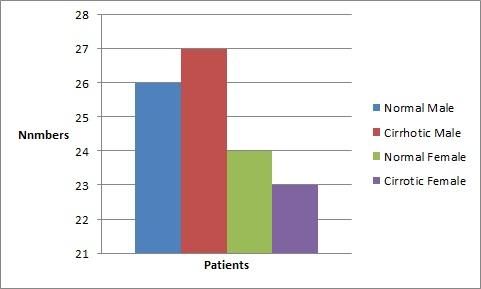
Annals of R.S.C.B., ISSN:1583-6258, Vol. 25, Issue 6, 2021, Pages. 15204 - 15215
Received 25 April 2021; Accepted 08 May 2021.

              patients.from those mean age 26.6 ± 7.1 (range 20-60 years) , from the normal subjects 26 male (
              52%) and 24 female ( 48%) , and those with fibrosis 27 male ( 54%) and 23 female ( 46%)
              The shearwaveelastography measurements value in liver fibrosis was 11.165 kPa (range 3.8 to
              23 kPa) ,whereas the median liver elasticity for normal subjects was 4.885 kPa ( range 3.2 to 7.2
              kPa ) . A significant correlation was found between shear wave elastography and fibrosis
              (p=0.0006) with sensitivity of 80% . A significant correlation also seen between shear wave
              elastography and exclusion of fibrosis (sensitivity 76%) (sensitivity 76%)(p= 0.003).

                           Figure 8:Number of normal and cirrhotic male and their measurement in kPa

                          Figure 9: number of normal and cirrhotic female and their measurement in kPa

              Discussion
              Two-dimensional shear wave elastography is relatively new ultrasound technique that allows
              integrated liver stiffness measurement to non-invasively assess liver stiffness.Although, the

               http://annalsofrscb.ro                                                                    15211
Annals of R.S.C.B., ISSN:1583-6258, Vol. 25, Issue 6, 2021, Pages. 15204 - 15215
Received 25 April 2021; Accepted 08 May 2021.
method is easy to learn and fast to perform, validated normal values for healthy individuals as
well as cirrhotic patients are largely missing and may differ between various high ends
ultrasound devices (19).
Studies on two-dimensional shear wave elastography are starting to emerge but mostly have been
confined to the supersonic ImgineAixplorer system (the first system used shear wave), with
mean liver stiffness measurments ranging from 4.29 (20) to 6 ± 1.4 kPa (21).
In our study, the mean liver stiffness measurement of all subjects without liver disease was 4.88
kPa (range 3.2 to 7.2) which is lower than measurement produced by Chong Hyun Suh et al (22) ,
who evaluate normal value in 196 subjects with potential donor for living donor liver
transplantation using biopsy verified normal liver value and identified a cut off of 6.2 kPa.
In our study the mean liver stiffness measurement in cirrhotic patients was 11.165 kPa (range 3.8
to 23 kPa) which is close to the result produced by Gomez –Domin-guez et al (23) which is 11
kPa (range from 5-16 kPa) and Fraquelli et al (24) who produce measurement of 10.3 kPa (range
from 7.9 to 11.93 kPa) .
our measurement is lower than that produced by Rigamonti et al (25) who produce measurement
of 12 kPa (range 7.8 to 19 kPa). Our study is higher than that produced by Ziol et al (26) which
produce measurement of 9.6 kPa (range 8.8 to 14.6 kPa) and castera et al (27) who produce
measurement of 9.5 kPa (range 7.1 to 12.5 kPa). The reason of differences in the reading may be
due to intra- and inter-observer variability, readings is higher in patient with hepatitis C; Acute
hepatitis can have false positives. In patients with a high body mass index, erroneous values may
be obtained. A very practical pitfall is confounding factors such as edema, inflammation,
cholestasis and congestion. All these must be put in context and a multidisciplinary clinical
approach used in the interpretation of the results (28).
Table 2: comparison of the measurement between our study and other study.
study Measurement (kPa) Range (kPa)
Our study 11.165 3.8 -23
Gomez-Domin-guez et al 11 5 - 16
Fraquelli et al 10.3 7.9 – 11.93
Rigamonti et al 12 7.8 - 19
Ziol et al 9.6 8.8 – 14.6
Castera et al 9.5 7.1 – 12.5
Interestingly, our study revealed that sex had an impact on liver stiffness measurements in
patient with liver cirrhosis, showing higher liver stiffness values in female which is differs from
Bende F Mulbecirovic a sporea I et al (29) which shows significantly higher liver stiffness
measurements in male participants. In contrast, we found no significant differences regarding sex
in healthy liver subjects similar to Mulbecirovic a sporea I et al. this finding could have been due
to the heterogenicity of this cohort because of the various underlying morbidities.
Therefore, on the basis of our data we can roll out cirrhosis in patients with normal liver stiffness
values but no cut off values for cirrhosis can be derived at present. Further studies with higher
numbers of patients had a homogenous etiology with histologic findings as the reference’s
standard are warranted.
http://annalsofrscb.ro 15212Annals of R.S.C.B., ISSN:1583-6258, Vol. 25, Issue 6, 2021, Pages. 15204 - 15215
Received 25 April 2021; Accepted 08 May 2021.
Our study had several limitations.First, we did not provide evidence of normal liver enzyme and
bilirubin levels in the healthy volunteer group, potentially missing asymptomatic liver disease.
Second, histologic conformation was only available for the liver cirrhosis cohort, whereas no
histologic findings were obtained for the healthy subjects.third, the investigator performing liver
stiffness measurement where aware of the cirrhotic status of the patients, introducing a potential
risk of bias.
Conclusion and recommendation
Shear wave elastography examination is a promising noninvasive method for the evaluation of
liver fibrosis, with good diagnostic performance.further studies in larger series of patients with
uniform underlying liver disease are needed to validate these results.
References
1. Sebastiani G. Castera L. Halfon P. Pol S, Mangia A, Di Marco V,pirisi M, Voiculesco M,
Bourliere M ,Alberti A . The impact of liver disease etiology and the stages of hepatic
fibrosis on the performance of non invasive fibrosis biomarkers . An international study
of 2411 cases . Aliment PharmacolTher2011 ;34;1202-1216.
2. Pinzani M, Rombouts K, liver fibrosis , from the bench to clinical targets . Dig Liver Dis
2004;36;231-242.
3. Bravo AA, Sheth SG, Chopra S. Liver biopsy . N Engl J Med 2001;344;495-500.
4. Bravo AA, Sheth SG, Chopra S. Liver Biopsy. N Engl J Med. 2001; 344(7):495–500.
https://doi.org/10. 1056/NEJM200102153440706 PMID: 11172192.
5. Seeff LB, Everson GT, Morgan TR, Curto TM, Lee WM, Ghany MG et al. Complication
rate of percutaneous liver biopsies among persons with advanced chronic liver disease in
the HALT-C trial. Clin Gastroenterol Hepatol. 2010; 8(10):877–883.
https://doi.org/10.1016/j.cgh.2010.03.025 PMID: 20362695.
6. Zaid Hamid Mahmoud. The Magnetic Properties of Alpha Phase for Iron Oxide NPs that
Prepared from its Salt by Novel Photolysis Method. Journal of Chemical and
Pharmaceutical Research, 2017, 9(8):29-33
7. Citation:Mancini M, SalomoneMegna A, Ragucci M, De Luca M, Marino Marsilia G,
NardoneG, et al. (2017) Reproducibility of shear wave elastography (SWE)in patients
with chronic liver disease. PLoS ONE 12(10):e0185391.https://doi.org/10.1371/
journal.pone.0185391.
8. Castera L. Non-invasive methods to assess liver disease in patients with hepatitis B or C.
Gastroenterology 2012;142(6):1293e4—302e4.
9. Imbert-Bismut F, Ratziu V, Pieroni L, Charlotte F, Benhamou Y, Poynard T.
Biochemical markers of liver fibrosis in patients with hepatitis C virus infection: a
prospective study. Lancet 2001;357(9262):1069—75.
10. Fujimoto K, Kato M, Tonomura A, Yada N, Tatsumi C, Oshita M, et al. Non-invasive
evaluation method of the liver fibrosis using real-time tissue elastograpy — usefulness of
judgment liver fibrosis stage by liver fibrosis index (LF index). Kanzo 2010;51:539—41.
11. Bota S, Sporea I, Sirli R, Popescu A, Danila M, Costachescu D. Intra- and interoperator
reproducibility of acoustic radiation force impulse (ARFI) elastography — preliminary
results. Ultrasound Med Biol 2012;38(7):1103—
http://annalsofrscb.ro 15213Annals of R.S.C.B., ISSN:1583-6258, Vol. 25, Issue 6, 2021, Pages. 15204 - 15215
Received 25 April 2021; Accepted 08 May 2021.
12. Muller M, Gennisson JL, Deffieux T, Tanter M, Fink M. Quantitative viscoelasticity
mapping of human liver using supersonic shear imaging: preliminary in vivo feasibility
study. Ultrasound Med Biol 2009; 35:219–229.
13. Tahmasebi S, El‐Esawi MA, Mahmoud ZH, et al. Immunomodulatory effects of
Nanocurcumin on Th17 cell responses in mild and severe COVID‐19 patients. J Cell
Physiol. 2020;1–14. https://doi.org/10.1002/jcp.30233
14. Yoneda M, Suzuki K, Kato S, Fujita K, Nozaki Y, Hosono K, et al. Nonalcoholic fatty
liver disease: US-based acoustic radiation force impulse elastography. Radiology
2010;256(2):640—7
15. Elastography in Chronic Liver Disease: Modalities, Techniques, Limitations, and Future
Directions. November-December 2016; 36(7): 1987–2006. Published online 2016 Sep 30.
doi: 10.1148/rg.2016160042
16. Garran Medical Imaging. Liver Elastography: What is liver elastography.
https://garranmedicalimaging.com.au/elastography-of-the-liver/. Accessed April 25,
2017.
17. Frulio N, Trillaud H. Ultrasound elastography in liver. DiagnInterv Imaging. 2013;
94(5):515–534. https://doi.org/10.1016/j.diii.2013.02.005 PMID: 23623211
18. Fraquelli M, Rigamonti C, Casazza G, Conte D, Donato MF, Ronchi G et al.
Reproducibility of transient elastography in the evaluation of liver fibrosis in patients
with chronic liver disease. Gut. 2007; 56 (7):968–973.
https://doi.org/10.1136/gut.2006.111302 PMID: 17255218
19. Roulot D, Czernichow S, Le Cle ´siau H, Costes JL, Vergnaud AC, Beaugrand M. Liver
stiffness values in apparently healthy subjects: influence of gender and metabolic
syndrome. J Hepatol. 2008; 48(4):606– 613. https://doi.org/10.1016/j.jhep.2007.11.020
PMID: 18222014
20. . Jeong WK, Lim HK, Lee HK, et al. Principles and clinical application of ultrasound
elastography for diffuse liver disease. Ultrasonography 2014; 33(3): 149-160.
21. Wang CZ, Zheng J, Huang ZP, et al. Influence of measurement depth on the stiffness
assessment of healthy liver with real-time shear wave elastography. Ultrasound Med Biol
2014; 40:461–469.
22. Sirli R, Bota S, Sporea I, et al. Liver stiffness measurements by means of SuperSonic
shear imaging in patients without known liver pathology. Ultrasound Med Biol 2013;
39:1362–1367.
23. Suh CH, Kim SY, Kim KW, Lim Ys, Lee SJ, Lee MG et al. Determination of normal
hepatic elasticity by using real-time shear-wave elastography. Radiology. 2014;
271(3):895–900. https://doi.org/10.1148/ radiol.14131251 PMID: 24555633
24. Fraquelli M, Rigamonti C, Casazza G, Conte D, Donato MF, Ronchi G, et al.
Reproducibility of transient elastography in the evaluation of liver fibrosis in patients
with chronic liver disease. Gut 2007;56(7):968—73
25. Rigamonti C, Donato MF, Fraquelli M, Agnelli F, Ronchi G, Casazza G, et al. Transient
elastography predicts fibrosis progression in patients with recurrent hepatitis C after liver
transplantation. Gut 2008;57(6):821—7
26. Ziol M, Handra-Luca A, Kettaneh A, Christidis C, Mal F, Kazemi F, et al. Noninvasive
assessment of liver fibrosis by measurement of stiffness in patients with chronic hepatitis
C. Hepatology 2005;41(1):48—54.
http://annalsofrscb.ro 15214Annals of R.S.C.B., ISSN:1583-6258, Vol. 25, Issue 6, 2021, Pages. 15204 - 15215
Received 25 April 2021; Accepted 08 May 2021.
27. Ultrasound shear wave elastography and liver fibrosis: A Prospective Multicenter Study.
2017 jan 8.9.
28. Castera L, Vergniol J, Foucher J, Le Bail B, Chanteloup E, Haaser M, et al. Prospective
comparison of transient elastography, Fibrotest, APRI, and liver biopsy for the
assessment of fibrosis in chronic hepatitis C. Gastroenterology 2005;128(2):343—50
29. Bende F, Mulabecirovic A, Sporea I, et al. Assessing liver stiffness by 2-D shear wave
elastography in a healthy cohort. Ultrasound Med Biol 2018; 44:332–341.
http://annalsofrscb.ro 15215You can also read