Diagnosis and mortality prediction of sepsis via lysophosphatidylcholine 16:0 measured by MALDi tof MS - Nature
←
→
Page content transcription
If your browser does not render page correctly, please read the page content below
www.nature.com/scientificreports
OPEN Diagnosis and mortality
prediction of sepsis
via lysophosphatidylcholine 16:0
measured by MALDI‑TOF MS
Eun Hye Lee1, Mi Hwa Shin2, Jong‑Min Park3, Sang‑Guk Lee4, Nam Su Ku5, Young Sam Kim2,
Moo Suk Park2, Jae‑Chul Pyun3* & Kyung Soo Chung2*
Sepsis remains a critical problem with high mortality worldwide, but there is still a lack of reliable
biomarkers. We aimed to evaluate the serum lysophosphatidylcholine (LPC) 16:0 as a biomarker of
sepsis using matrix-assisted laser desorption/ionization time-of-flight mass spectrometry (MALDI-
TOF MS). Patients admitted to intensive care unit at Severance Hospital from March 2017 through
June 2018 were prospectively enrolled. The inclusion criteria were the fulfillment of at least two
criteria of systemic inflammatory response syndrome (SIRS) or the presence of sepsis. Of the 127
patients, 14 had non-infectious SIRS, 41 had sepsis, and 72 had septic shock. The mean serum LPC
16:0 concentration (µmol/L) in non-infectious SIRS was significantly higher than in patients with
sepsis and septic shock (101.1 vs. 48.92, p < 0.05; 101.1 vs. 25.88, p < 0.001, respectively). The area
under the curve (AUC) predicting 28-day mortality using ΔLPC16:0 (D1-D0) levels was 0.7, which was
comparable with the APACHE II score (AUC 0.692) and SOFA score (AUC 0.67). Mechanical ventilation,
CRRT, lactate, Δ LPC16:0 (D1-D0) less than the cut-off value were significantly associated with 28-day
mortality in multivariable analysis. Our results suggest that LPC16:0 could be a useful biomarker for
sepsis diagnosis and mortality prediction in ICU patients.
Sepsis is a critical health problem and is one of the main causes of death in intensive care units (ICU) worldwide1,2.
Although the sepsis mortality rate has decreased recently, it is still estimated to be between 35 and 55%3. As clini-
cal information alone is rarely sufficient to detect sepsis, much effort has been expended to identify biomarkers
for the early detection of sepsis, risk stratification, and prognostic prediction4. C-reactive protein (CRP) and
procalcitonin (PCT) have been widely studied as sepsis biomarkers5,6, but it remains difficult to differentiate sepsis
from other non-infectious inflammatory diseases. Recent evidence suggests that cell surface markers associated
with immune d ysfunction7,8 and a peripheral blood-based molecular assay, designated as “SeptiCyte LAB,”
could be promising for discriminating sepsis from non-infectious systemic inflammation9,10. However, these
approaches may require considerable time, effort, and cost. Since matrix-assisted laser desorption/ionization
time-of-flight (MALDI-TOF) mass spectrometry (MS) was developed, it has been widely used for the analysis
of peptides, whole proteins, and nucleotides. The advantages of MALDI-TOF MS compared to those of other
analytical methods include easy sample preparation, sensitive detection (< fmol), wide detection range of up to
500 kDa, and short analysis t ime11,12.
In our previous s tudy12, we identified differentially abundant low molecular weight molecules in the serum
of healthy volunteers and sepsis patients using MALDI-TOF MS based on a parylene-matrix chip. The selected
mass peaks of m/z (mass-to-charge) were 496.3 and 518.3 and tandem mass spectrometry was then performed
1
Division of Pulmonology, Allergy and Critical Care Medicine, Department of Internal Medicine, Yongin Severance
Hospital, Yonsei University College of Medicine, Yongin‑si, Gyeonggi‑do, Republic of Korea. 2Division of
Pulmonary and Critical Care Medicine, Department of Internal Medicine, Institute of Chest Diseases, Severance
Hospital, Yonsei University College of Medicine, 50‑1 Yonsei‑ro, Seodaemun‑gu, Seoul 03722, Republic of
Korea. 3Department of Materials Science and Engineering, Yonsei University, 50 Yonsei‑ro, Seodaemun‑gu,
Seoul, Republic of Korea. 4Department of Laboratory Medicine, Severance Hospital, Yonsei University College
of Medicine, Seoul, Republic of Korea. 5Department of Internal Medicine and AIDS Research Institute, Yonsei
University College of Medicine, Seoul, Republic of Korea. *email: JCPYUN@YONSEI.AC.KR; CHUNGKS@yuhs.ac
Scientific Reports | (2020) 10:13833 | https://doi.org/10.1038/s41598-020-70799-0 1
Vol.:(0123456789)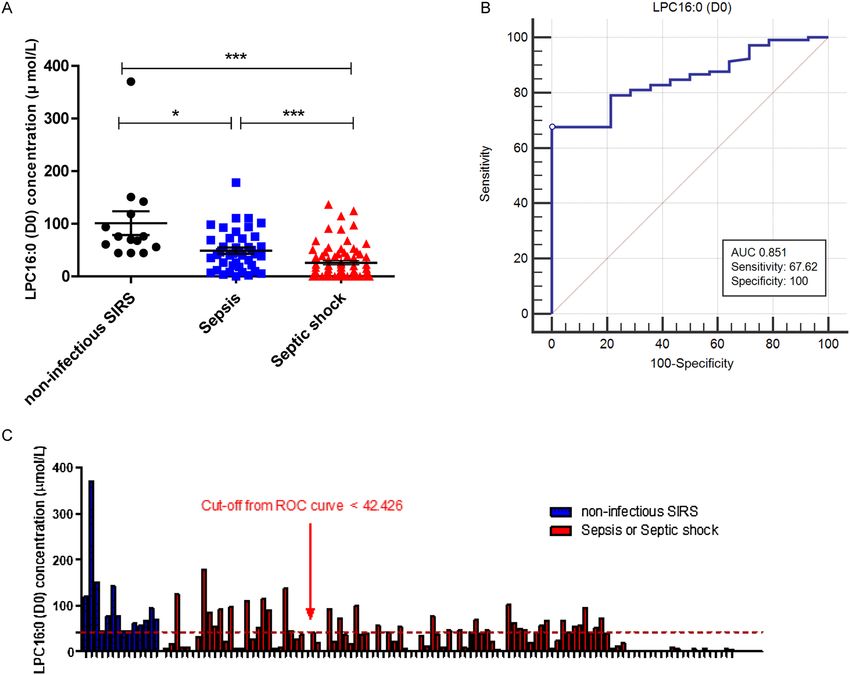
www.nature.com/scientificreports/
Figure 1. Study flowchart.
to identify these molecules as LPC16:0. The aim of this present study was to confirm our previous identified
LPC 16:0 associated with clinical outcome and evaluate its role as a biomarker for the diagnosis and mortality
prediction of ICU sepsis patients.
Methods
Study design and cohort. Patients admitted to medical ICU (MICU) were prospectively enrolled from
March 2017 through June 2018 at Severance Hospital, a 2,500-bed (30-bed medical ICU) university tertiary
referral hospital in Seoul, South Korea. The study protocol involved two cohorts (Cohort 1: ER sepsis cohort,
Cohort 2: MICU cohort). The inclusion criteria for the cohorts were an age > 19 years and fulfillment of at least
two criteria of systemic inflammatory response syndrome (SIRS) or the presence of sepsis within the first 24 h
after ICU admission. The definition of sepsis followed the revised sepsis 3 definition (infection + an increase ≥ 2
of a Sequential Organ Failure Assessment (SOFA) score)2. Septic shock was defined as sepsis with vasopres-
sors required to maintain a mean arterial pressure of 65 mmHg or greater and serum lactate levels greater than
2 mmol/L in the absence of hypovolemia2. Patients with chronic liver disease, patients who refused consent, and
patients whose blood specimens were lost were excluded from the study. All patients were observed for at least
28 days from the time of enrollment until death or discharge from the hospital.
The study ultimately included a total of 127 patients between cohort 1 and 2. Among these, 14 patients were
classified as non-infections SIRS, 41 as sepsis, and 72 as septic shock, according to the sepsis 3 definition. All
patients were treated with standard therapy for sepsis and septic shock, according to international g uidelines13.
Patients were classified as either survivors or non-survivors according to the 28-day post-enrollment outcome
(Fig. 1).
Data collection. Clinical and laboratory patient data were collected from the hospital medical records. The
following clinical data were collected: age, gender, Charlson Comorbidity index (CCI)14, source of infection,
microbiological blood culture results, and 28-day outcome. The Acute Physiology and Chronic Health Evalua-
tion II (APACHE II) and SOFA scoring systems were used to determine the severity of patient condition over
the first 24 h following admission (D0). Information regarding inflammatory markers, including white blood
cell (WBC) count, C-reactive protein (CRP), and procalcitonin (PCT), was also collected from medical records.
Blood sample collection and measurement of LPC16:0. Whole blood was collected on the day of
ICU admission (D0) and on day 1 (D1), day 3 (D3), and day 7 (D7) after admission. First, whole blood sam-
ples were vortexed for 30 s, and centrifuged at 12,700 × g for 5 min. For each sample, the pellet was discarded,
and 100 μL of serum was added to 400 μL of acetonitrile and vortexed for 30 s. The mixture was centrifuged
at 12,700 × g for 10 min. Finally, 300 μL of the supernatant was analyzed using a MALDI-TOF MS. An equal
volume of 0.1% trifluoroacetic acid aqueous solution was added to each serum extract prior to MALDI-TOF
MS analysis. Pure LPC16:0 solution was prepared for mass comparison and quantitative MALDI-TOF MS. For
measurement of LPC16:0 in patient serum, a MALDI-TOF MS with a Parylene matrix chip was used to measure
Scientific Reports | (2020) 10:13833 | https://doi.org/10.1038/s41598-020-70799-0 2
Vol:.(1234567890)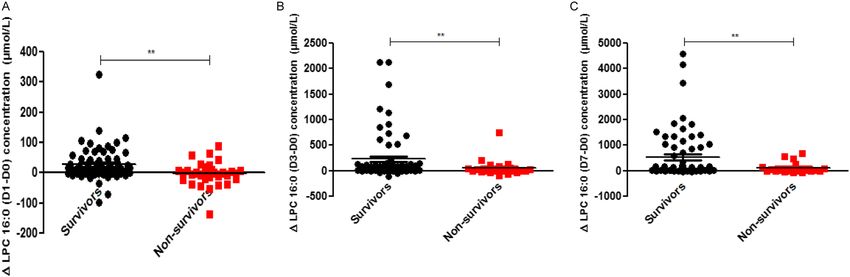
www.nature.com/scientificreports/
small molecules at m/z ratios of less than 500 Da15. The LPC16:0 standard and serum extracts were dispensed
onto Parylene matrix chip arrays (0.5 μL of sample per spot) and quantified using a Microflex mass spectrometer
(Bruker Daltonics; Bremen, Germany) equipped with a nitrogen laser (337 nm). Detailed methods for LPC
measurement were provided in our previous study12. Quantitative analysis of the LPC16:0 standard on a Par-
ylene matrix chip confirmed the linear relationship between the intensity and concentration for LPC16:0 (Sup-
plementary Figure S1). For the validation of the identity of the LPC16:0 peak in the clinical serum samples, MS/
MS analysis was carried out using a pure LPC16:0 standard solution. Measurement of LPC16:0 was performed
on D0, D1, D3, and D7 serum samples for each patient. All clinicians and patients participating in the study were
blinded to the LPC results.
Statistical analysis. Continuous variables are presented as mean ± standard deviation (SD) or median and
interquartile range (IQR). Continuous variables were compared using Student’s t-test or the Mann–Whitney U
test. Categorical variables were reported as a number and percentage and were compared using the chi-square
test or Fisher’s exact test. A non-parametric Kruskal–Wallis test was used to compare three or more groups for
qualitative parameters (followed by post-hoc analysis). The correlations between LPC levels and other variables
were determined using the Spearman correlation test. Multiple Cox-regression analysis was used to determine
whether LPC levels were independently associated with 28-day mortality outcomes. The Kaplan–Meier method
was used to generate survival curves that were analyzed using the log-rank test. In all tests, a p-value < 0.05 was
considered significant. SPSS v23.0 (IBM, Armonk, NY, USA) was used for statistical analysis and GraphPad
Prism 7 (Graph-Pad, San Diego, CA, USA) was used for graphical representations. ROC curves were generated
and AUC analysis was performed using the MedCalc software (version 16.4.3; MedCalc, Oostende, Belgium).
Ethics. The research protocol was approved by the Institutional Review Board (IRB) of Severance Hospital
(ER cohort IRB number: 4-2016-0605, MICU cohort IRB number: 4-2017-0654). Written informed consent was
obtained from patients or their guardians. All methods were carried out in accordance with relevant guidelines
and regulations.
Results
Baseline characteristics of study patients. A total of 127 patients were enrolled in the present study.
Among these, 14 fulfilled at least 2 SIRS criteria that suggest non-infectious SIRS, 41 were classified as having
sepsis and 72 were classified as having septic shock. Of the 113 patients who met the sepsis diagnostic criteria, 73
survived and 40 had died at 28 days after ICU admission (Fig. 1). The clinical and laboratory characteristics of
sepsis and septic shock patients admitted to the ICU are shown in Table 1. We compared the clinical and labora-
tory features of 28-day survivors and non-survivors. The median age was 70 overall, and more participants were
male than female (70/113, 61.9%). The most common site of infection was pulmonary in both groups. Urinary
tract infections were more common in survivors (19.2% vs. 2.5%, p = 0.018), while the proportion of abdominal
infections was significantly higher in non-survivors (11.0% vs. 32.5%, p = 0.006). The proportion of septic shock
and bacteremia did not differ significantly between survivors and non-survivors, but mechanical ventilation
(46.6% vs. 77.5%, p = 0.003) and continuous renal replacement therapy (CRRT) (27.4% vs. 52.5%, p = 0.002)
were more frequently performed in non-survivors. The SOFA (8 [IQR, 6–10] vs. 9 [IQR, 8–13], p = 0.003) and
APACHE II scores (23 [IQR, 16–32] vs. 31 [IQR, 23–35], p = 0.001), as well as serum lactate levels (2.1 [IQR,
1.4–3.3] vs. 3.7 [IQR, 1.7–8.9]; p = 0.002) obtained in the initial laboratory test were lower for survivors com-
pared to those for non-survivors. Baseline characteristics of 14 non-infectious SIRS patients were shown in
Supplementary Table S1.
LPC16:0 (D0) concentration in patients with non‑infectious SIRS, sepsis, and septic shock. The
baseline LPC16:0 concentration (µmol/L) at ICU admission (D0) is shown in Fig. 2. The mean serum LPC con-
centration in septic shock patients was significantly lower than in that in those with non-infectious SIRS (25.88
vs. 101.1, p < 0.001) and sepsis (25.88 vs. 48.92, p < 0.001). The mean serum LPC concentration in sepsis patients
was also significantly lower than that in non-infectious SIRS patients (48.92 vs. 101.1, p < 0.05). Figure 2B shows
ROC curve of LPC16:0 (D0) for diagnosis of sepsis. The AUC was 0.851 with sensitivity 67.62% and specificity
100% using LPC16:0 cut off value < 42.426 µmol/L.
Comparison of LPC16:0 concentration between 28‑day survivors and non‑survivors among
sepsis and septic shock patients. The concentration of LPC16:0 measured on D0, D1, D3, and D7 in
both survivors (n = 73) and non-survivors (n = 40) was determined using MALDI-TOF MS (Fig. 3). There was
no significant difference in LPC16:0 concentration at ICU admission (D0) between the two groups. On D1, D3,
and D7, the concentration of LPC was lower in non-survivors than in survivors (p < 0.05) (Fig. 4). The survivor
group showed a statistically significant (P < 0.01) increase in the amount of LPC16:0 over time compared to the
non-survivor group.
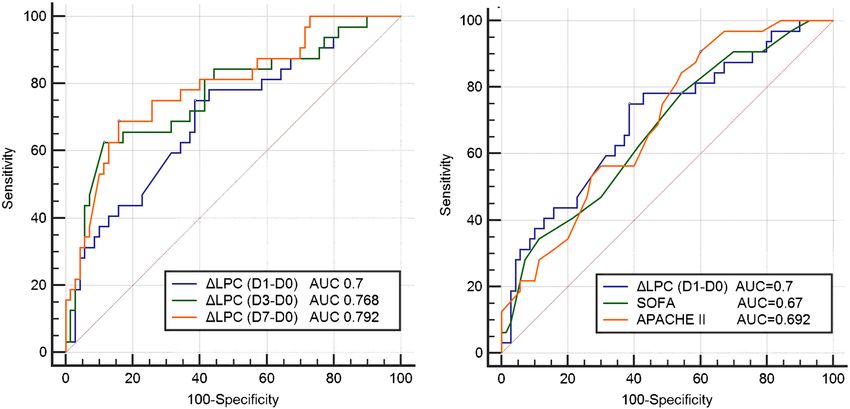
Association between changes in serum LPC16:0 levels and 28‑day mortality. Receiver oper-
ating characteristic (ROC) curves were generated to compare changes in LPC16:0 concentration and clinical
severity index for prediction of 28-day mortality (Fig. 5). The area under the curve (AUC) for ΔLPC16:0 (D1-
D0) was 0.7 (95% confidence interval [CI] 0.602–0.787), while the AUCs for the APACHE II score and SOFA
score were 0.692 (95% CI 0.593–0.780) and 0.67 (95% CI 0.570–0.766), respectively. According to this compari-
son, the AUC of ΔLPC16:0 (D1-D0) is higher than that of the APACHE II score (AUC 0.7 vs. 0.692, p = 0.916)
Scientific Reports | (2020) 10:13833 | https://doi.org/10.1038/s41598-020-70799-0 3
Vol.:(0123456789)www.nature.com/scientificreports/
All patients (N = 113) Survivors (N = 73) Non-survivors (N = 40) P-value
Variables
Age (years), median, [IQR] 70 [60.5–77.5] 70 [58.8–77.2] 69 [61–78] 0.989
Gender, male, N (%) 70 (61.9) 44 (60.3) 26 (65.0) 0.479
BMI (kg/m2) 21.8 [19.2–25.1] 22.3 [18.8–25.3] 21.4 [19.3–24.4] 0.501
Site of infection, N (%)
Pulmonary 65 (57.5) 43 (58.9) 22 (55.0) 0.676
Urinary tract 15 (13.3) 14 (19.2) 1 (2.5) 0.018
Abdomena 21 (18.6) 8 (11.0) 13 (32.5) 0.006
Skin and soft tissue 5 (4.4) 3 (4.1) 2 (5.0) 1.0*
Othersb 7 (6.2) 5 (6.8) 2 (5.0) 1.0*
Charlson comorbidity index 5 (4–7) 5 (4–6) 5 (4–8) 0.061
Major comorbidities
Malignancy 29 (25.7) 16 (21.9) 13 (32.5) 0.079
DM 46 (40.7) 28 (38.4) 18 (45.0) 0.158
CKD or ESRD 30 (26.5) 18 (24.7) 12 (30.0) 0.262
CHF 13 (11.5) 7 (9.6) 6 (15.0) 0.339*
Clinical parameters
Sepsis 41 (36.3) 29 (39.7) 12 (30.0) 0.149
Septic shock 72 (63.7) 44 (60.3) 28 (70.0) 0.149
Bacteremia 36 (31.9) 23 (31.5) 13 (32.5) 0.663
Mechanical ventilation 65 (57.5) 34 (46.6) 31 (77.5) 0.003
CRRT 41 (36.3) 20 (27.4) 21 (52.5) 0.002
Clinical severity score, D0
APACHE II score 26 [19–32.5] 23 [16–32] 31 [23–35] 0.001
SOFA score 8 [7–11] 8 [6–10] 9 [8–13] 0.003
Laboratory parameters, D0
Leukocytes (× 106/mL) 13.7 [7.1–19.2] 13.2 [7.7–19.0) 14.1 [6.1–19.5] 0.783
Platelets (× 106/mL) 144 [78.5–239] 160 [87.3–239.0] 132 [45–239] 0.305
CRP (mg/L) 171.7 [89.7–281.2] 212.2 [116.8–288.6] 158.9 [72.5–217.9] 0.034
Procalcitonin (ng/mL) 4.1 [1.1–26.6] 3.7 [0.9–29.6] 5.6 [1.7–21.4] 0.755
Lactate (mmol/L) 2.3 [1.6–4.6] 2.1 [1.5–3.2] 3 [1.9–8.9] 0.002
Albumin (g/dL) 2.5 [2.1–2.8] 2.6 [2.1–2.8] 2.4 [2.1–2.8] 0.072
Total Bilirubin (mg/dL) 0.6 [0.3–1.2] 0.6 [0.3–0.9] 0.7 [0.4–2.0] 0.079
BUN (mg/dL) 32.8 [20.0–50.8] 30.4 [19.9–49.3] 34.8 [23.4–52.6] 0.329
Creatinine (mg/dL) 1.7 [0.8–2.8] 1.4 [0.7–2.8] 2.1 [0.9–3.0] 0.19
Table 1. Comparison of characteristics of sepsis and septic shock patients according to 28-day mortality.
BMI body mass index, DM diabetes mellitus, CKD chronic kidney disease, ESRD end stage renal disease,
CHF congestive heart failure, CRRTcontinuous renal replacement therapy, APACHE Acute Physiology and
Chronic Health Evaluation, SOFA Sequential Organ Failure Assessment, CRP C-reactive protein, BUN Blood
urea nitrogen, ABGA arterial blood gas analysis. Values are expressed as n (%) or median [interquartile
range] unless otherwise indicated. *Fisher exact test. a Abdomen: gastrointestinal and hepatobiliary infection,
peritonitis. b Others: meningitis, spinal abscess, septic arthritis, primary unknown infection.
and SOFA score (AUC 0.7 vs. 0.67, p = 0.712), although this difference is not statistically significant. Patients were
divided into two groups according to this cut-off value and subjected to a cox proportional hazard model analy-
sis involving several demographic and clinical characteristics (Table 2). According to univariate analysis, the
Charlson Comorbidity Index (CCI), abdominal origin of sepsis, mechanical ventilation, application of CRRT,
lactate level, and ΔLPC D1 were associated with 28-day mortality. According to multivariate analysis, mechani-
cal ventilation (HR 12.415; 95% CI 2.113–72.947), CRRT (HR 4.236; 95% CI 1.029–17.435), lactate (D0) (HR
1.455; 95% CI 1.035–2.045), ΔLPC D1 less than the cut-off value (Δ LPC16:0 (D1–D0) ≤ 7.288; HR 6.491; 95%
CI 1.614–26.100) were significantly associated with an increased 28-day mortality. Figure 6 shows the Kaplan–
Meier survival analysis of the patient groups classified according to the ΔLPC (D1–D0) cut-off, and these 28-day
survival rates differed significantly (P < 0.001).
Discussion
In the present study, we found that the changes in LPC16:0 concentration over time were closely associated with
28-day mortality in sepsis patients under intensive care. Patients with persistently low LPC16:0 have shown an
increased risk of death whereas those who have recovered LPC16:0 had better prognosis.
Scientific Reports | (2020) 10:13833 | https://doi.org/10.1038/s41598-020-70799-0 4
Vol:.(1234567890)www.nature.com/scientificreports/
Figure 2. (A) LPC 16:0 (D0) concentration in patients with non-infectious SIRS (n = 14), Sepsis (n = 41)
and Septic shock (n = 72). (B) ROC curve of LPC16:0 (D0) for diagnosis of sepsis. (C) Analysis results of the
LPC16:0 (D0) concentration (µmol/L) from non-infectious SIRS (n = 14), sepsis and septic shock patients
(n = 113). Data provided are the mean ± SEM, *P < 0.05, **P < 0.01 ***P < 0.001, analyzed by one-way ANOVA
with Bonferroni’s post hoc test.
Figure 3. Comparison of LPC16:0 (D0–D7) concentration between survivors and non-survivors in sepsis
patients (number of survivors and non-survivors; D0 73:40, D1 73:37, D3 73:28, D7 73:23, respectively). Data
provided are the mean ± SEM, *P < 0.05, **P < 0.01, ***P < 0.001 analyzed by Student’s unpaired two-tailed t test.
Previous studies have found that bioactive lipids have significant effects on immune and inflammatory cells,
and are regarded as mediators during the development of s epsis16–19. In septic condition, activation of hepatic
de nove lipogenesis lead to elevation of phosphatidylcholine (PC), triglycerides (TGs), free fatty acid16,17. LPC
is produced by the action of phospholipase A2 (PLA2) on PC and can be transported back to the liver and con-
verted to PC by lysophosphatidylcholine acyltransferase (LPCAT)20. LPC has been known to play a role in the
immune regulation and stimulation of immune cells, including monocytes, macrophages, T lymphocytes, and
neutrophils21–23. Several studies have reported that the serum concentrations of LPC subtypes 16:0, 18:0, 18:1,
and 18:2, as well as total LPC were lower in sepsis patients compared to those in healthy c ontrols21,24 and another
recent study suggested that LPC16.0 predicts 28 day and 90-day mortality better than other LPC subtypes25.
Impaired metabolic homeostasis is thought to be the cause of sustained low levels of LPC in sepsis patients20.
Scientific Reports | (2020) 10:13833 | https://doi.org/10.1038/s41598-020-70799-0 5
Vol.:(0123456789)www.nature.com/scientificreports/
Figure 4. Comparison of Δ LPC16:0 concentration (D1–D0, D3–D0, D7–D0) between survivors and non-
survivors in sepsis patients (number of survivors and non-survivors; D0 73:40, D1 73:37, D3 73:28, D7 73:23,
respectively), Data provided are the mean ± SEM, *P < 0.05, **P < 0.01, ***P < 0.001 analyzed by Student’s
unpaired two-tailed t test.
Figure 5. (A) ROC curve of Δ LPC (D1–D0, D3–D0, D7–D0) for predicting 28-day mortality (B) ROC curve
of Δ LPC (D1–D0) compared to SOFA, APACHE II score. In ROC curve comparisons, the AUC of ΔLPC (D1–
D0) was higher than SOFA (AUC 0.7 vs. 0.67, p = 0.712) or APACHE II score (AUC 0.7 vs. 0.692, p = 0.916) for
predicting 28-day mortality, although there is no statistical difference.
In our previous study, we identified LPC16:0 as a useful biomarker for diagnosis of sepsis via novel technique
using MALDI-TOF MS based on a parylene-matrix c hip12. The sensitivity and selectivity of LPC16:0 to sepsis
diagnosis was estimated to be 97.9% and 95.5%, respectively by using MALDI-TOF M S12. However, our previ-
ous study had limitation in comparing healthy control and sepsis patients. Many previous studies have been
conducted to distinguish between sepsis and S IRS9, which continues to be a difficult c hallenge26. Furthermore,
biomarkers that not only diagnose sepsis but also predict prognosis are more difficult to find. In this current study,
the significant difference in LPC16:0 levels in patients with non-infectious SIRS and sepsis on day0 suggested
that LPC16:0 could be a useful diagnostic biomarker of sepsis (101.1 vs. 48.92, p < 0.05) (Fig. 2). We also found
that the change in LPC levels over time with sepsis was an important prognostic tool for predicting mortality in
ICU. The AUC value for the 28-day mortality prediction of the ΔLPC (D1-D0) value was comparable to those
for the APACHE II and SOFA scores, which are well-known severity indexes in ICU patients [ΔLPC (D1–D0)
AUC = 0.7, APACHE II AUC = 0.692, SOFA AUC = 0.670]. Our study also found that ΔLPC (D3–D0) and ΔLPC
(D7–D0) had predictive value for 28-day mortality [ΔLPC (D3–D0) AUC = 0.768, ΔLPC (D7–D0) AUC = 0.792].
According to these results, if the LPC16:0 concentration does not increase beyond a cut-off during the course of
treatment for 7 days after the diagnosis of sepsis, the risk of mortality significantly increases. The differences in
mortality risk predicted by changes in LPC concentration were also significant at initial 24 h after sepsis diag-
nosis (Fig. 6). Considering the dynamic clinical course of sepsis, which occurs over a short period of time, this
finding is clinically significant because measuring changes in LPC concentration between D1 and D3 compared
Scientific Reports | (2020) 10:13833 | https://doi.org/10.1038/s41598-020-70799-0 6
Vol:.(1234567890)www.nature.com/scientificreports/
Univariable analysis Multivariable analysis
Variable HR 95% CI P-value Adjusted HR 95% CI P-value
Age (year) 1.001 0.974–1.028 0.967
Sex (male) 1.356 0.583–3.155 0.480
BMI (kg/m2) 1.008 0.928–1.095 0.843
Charlson comorbidity index 1.196 1.010–1.417 0.038 1.269 0.958–1.681 0.097
Site of infection
Pulmonary 1 1
Urinary tract 0.154 0.019–1.259 0.081 0.213 0.014–3.291 0.268
Abdomena 3.391 1.137–10.112 0.028 9.074 1.443–57.073 0.019
Skin and soft tissue 1.439 0.222–9.335 0.703 10.469 0.680–161.090 0.092
Othersb 0.863 0.153–4.858 0.867 0.001 0.000–5.119 0.999
Septic shock 1.926 0.786–4.719 0.152
Mechanical ventilation 3.784 1.511–9.476 0.003 12.415 2.113–72.947 0.005
CRRT 3.750 1.599–8.793 0.002 4.236 1.029–17.435 0.046
Bacteremia 1.208 0.517–2.819 0.663
Lactate 1.388 1.163–1.658 < 0.001 1.455 1.035–2.045 0.031
Procalcitonin 0.993 0.980–1.007 0.347
Δ LPC16:0 (D1–D0) ≤ 7.288 4.778 1.878–12.155 < 0.001 6.491 1.614–26.100 0.008
Table 2. Cox proportional hazard model of 28-day mortality. HR hazard ratio, CI confidence interval, BMI
body mass index, CRRTcontinuous renal replacement therapy, SOFA Sequential Organ Failure Assessment,
APACHE Acute Physiology and Chronic Health Evaluation. a Abdomen: gastrointestinal, hepatobiliary
infection, peritonitis. b Others: meningitis, spinal abscess, septic arthritis, primary unknown infection.
Figure 6. Kaplan–Meier survival analysis showed that the 28-day mortality of patients with plasma ΔLPC (D1–
D0) > 7.288 was higher than that of patients with ΔLPC (D1–D0) < 7.288 (p < 0.001).
to D0 is as effective as D7 for predicting mortality. Park DW et al. also reported that changes in LPC levels were
associated with mortality; however, they used changes in LPC concentration in combination with those in other
ortality27.
clinical markers, such as procalcitonin, for predicting patient m
In the present study, we found no significant correlation between LPC levels or changes in LPC levels and
the established clinical severity indexes APACHE II and SOFA. This apparent lack of correlation might be
due to the biological properties of LPC as an immunoregulatory ligand for cells of the innate and adaptive
immune systems22,28. Previous studies have reported that LPC treatment in an experimental animal sepsis model
decreased the level of pro-inflammatory cytokines23,29, and, in the present study, we observed that the LPC level
was inversely correlated with the levels of the inflammatory markers procalcitonin and lactate (Supplementary
Figure S2). Clinical severity indexes, such as APACHE II and SOFA scores could have limited value in clas-
sifying the immunologic and inflammatory status of sepsis, which is representative of organ failure. Therefore,
monitoring LPC recovery together with clinical indices may be the best way to examine the course of disease
for predicting the prognosis of sepsis.
The present study has several limitations. It was conducted at a single center and only included sepsis patients
admitted to the ICU; it may, thus, have associated bias. Other inflammatory cytokines that might be related to
changes in LPC levels were not monitored. The value of LPC16:0 for diagnosing sepsis were not sufficient due
to small number and high severity of the control group and the absolute value of LPC 16:0 at initial day was
Scientific Reports | (2020) 10:13833 | https://doi.org/10.1038/s41598-020-70799-0 7
Vol.:(0123456789)www.nature.com/scientificreports/
not able to discriminate survivors and non-survivors. Despite these limitations, our study highlights the power
of MLLDI-TOF MS of analytes on a Parylene matrix chip15,30 for facilitating the analysis of subtypes of LPC
accurately and without interference from organic matrix mass peaks. By performing the serial analysis of patient
samples over the course of sepsis, we were able to understand the association between changes in LPC levels and
disease prognosis and mortality, which can enable the better classification of patients in early stages of sepsis. A
large, multicenter population study, however, is needed to verify these results in sepsis patients.
Conclusions
In the present study, we used MALDI TOF MS to measure the levels of serum LPC16:0 in sepsis patients requiring
ICU care and found that changes in the concentration of LPC16:0 had predictive potential for determining the
prognosis and mortality. Sustained low levels of LPC were associated with poor prognosis and high mortality
risk, and these patients are, therefore, candidates for intensive care and a more rigorous treatment plan.
Data availability
All datasets generated and analysed during this study are available from the corresponding author on reason-
able request.
Received: 16 May 2020; Accepted: 4 August 2020
References
1. Kaukonen, K. M., Bailey, M., Suzuki, S., Pilcher, D. & Bellomo, R. Mortality related to severe sepsis and septic shock among criti-
cally ill patients in Australia and New Zealand, 2000–2012. JAMA 311, 1308–1316 (2014).
2. Singer, M. et al. The third international consensus definitions for sepsis and septic shock (Sepsis-3). JAMA 315, 801–810 (2016).
3. Liu, V. et al. Hospital deaths in patients with sepsis from 2 independent cohorts. JAMA 312, 90–92 (2014).
4. Pierrakos, C. & Vincent, J. L. Sepsis biomarkers: A review. Crit. Care 14, R15 (2010).
5. Luzzani, A. et al. Comparison of procalcitonin and C-reactive protein as markers of sepsis. Crit. Care Med. 31, 1737–1741 (2003).
6. Tang, B. M., Eslick, G. D., Craig, J. C. & McLean, A. S. Accuracy of procalcitonin for sepsis diagnosis in critically ill patients:
Systematic review and meta-analysis. Lancet Infect. Dis. 7, 210–217 (2007).
7. Morris, A. C. et al. Cell-surface signatures of immune dysfunction risk-stratify critically ill patients: INFECT study. Intensive Care
Med. 44, 627–635 (2018).
8. Shankar-Hari, M. et al. Early PREdiction of sepsis using leukocyte surface biomarkers: The ExPRES-sepsis cohort study. Intensive
Care Med. 44, 1836–1848 (2018).
9. McHugh, L. et al. A molecular host response assay to discriminate between sepsis and infection-negative systemic inflammation
in critically ill patients: Discovery and validation in independent cohorts. PLoS Med. 12, e1001916 (2015).
10. Miller, R. R. et al. Validation of a host response assay, Septicyte™ LAB, for discriminating sepsis from SIRS in the ICU. Am. J. Respir.
Crit. Care Med. 198, 903–913 (2018).
11. Glish, G. L. & Vachet, R. W. The basics of mass spectrometry in the twenty-first century. Nat. Rev. Drug Discov. 2, 140–150 (2003).
12. Park, J. M. et al. MALDI-TOF mass spectrometry based on parylene-matrix chip for the analysis of lysophosphatidylcholine in
sepsis patient sera. Anal. Chem. 91, 14719–14727 (2019).
13. Rhodes, A. et al. Surviving sepsis campaign: International Guidelines for Management of Sepsis and Septic Shock: 2016. Intensive
Care Med. 43, 304–377 (2017).
14. Charlson, M. E. & Sax, F. L. The therapeutic efficacy of critical care units from two perspectives: A traditional cohort approach vs
a new case–control methodology. J. Chronic Dis. 40, 31–39 (1987).
15. Kim, J. I., Park, J. M., Kang, M. J. & Pyun, J. C. Parylene-matrix chip for small molecule analysis using matrix-assisted laser desorp-
tion/ionization time-of-flight mass spectrometry. Rapid Commun. Mass Spectr. RCM 28, 274–280 (2014).
16. Rival, T. et al. Alteration of plasma phospholipid fatty acid profile in patients with septic shock. Biochimie 95, 2177–2181 (2013).
17. Wendel, M., Paul, R. & Heller, A. R. Lipoproteins in inflammation and sepsis. II. Clinical aspects. Intensive Care Med. 33, 25–35
(2007).
18. Rogers, A. J. et al. Metabolomic derangements are associated with mortality in critically ill adult patients. PLoS ONE 9, e87538
(2014).
19. Lee, S. H. et al. Prognostic implications of serum lipid metabolism over time during sepsis. Biomed. Res. Int. 2015, 789298 (2015).
20. Law, S. H. et al. An updated review of lysophosphatidylcholine metabolism in human diseases. Int. J. Mol. Sci. 20, 1149 (2019).
21. Drobnik, W. et al. Plasma ceramide and lysophosphatidylcholine inversely correlate with mortality in sepsis patients. J. Lipid Res.
44, 754–761 (2003).
22. Kabarowski, J. H., Xu, Y. & Witte, O. N. Lysophosphatidylcholine as a ligand for immunoregulation. Biochem. Pharmacol. 64,
161–167 (2002).
23. Yan, J. J. et al. Therapeutic effects of lysophosphatidylcholine in experimental sepsis. Nat. Med. 10, 161–167 (2004).
24. Cho, W. H. et al. Clinical significance of enzymatic lysophosphatidylcholine (LPC) assay data in patients with sepsis. Eur. J. Clin.
Microbiol. Infect. Diseases Off. Publ. Eur. Soc. Clin. Microbiol. 31, 1805–1810 (2012).
25. Ferrario, M. et al. Mortality prediction in patients with severe septic shock: A pilot study using a target metabolomics approach.
Sci. Rep. 6, 20391 (2016).
26. Jensen, J. U. & Bouadma, L. Why biomarkers failed in sepsis. Intensive Care Med. 42, 2049–2051 (2016).
27. Park, D. W. et al. Impact of serial measurements of lysophosphatidylcholine on 28-day mortality prediction in patients admitted
to the intensive care unit with severe sepsis or septic shock. J. Crit. Care 29(882), e885–e811 (2014).
28. Graler, M. H. & Goetzl, E. J. Lysophospholipids and their G protein-coupled receptors in inflammation and immunity. Biochim.
Biophys. Acta 1582, 168–174 (2002).
29. Murch, O. et al. Lysophosphatidylcholine reduces the organ injury and dysfunction in rodent models of gram-negative and gram-
positive shock. Br. J. Pharmacol. 148, 769–777 (2006).
30. Kim, J. I., Park, J. M., Noh, J. Y., Kang, M. J. & Pyun, J. C. Matrix-assisted laser desorption/ionization time-of-flight mass spec-
trometry of small volatile molecules using a parylene-matrix chip. Rapid Commun. Mass Spectrom. 28, 2301–2306 (2014).
Acknowledgements
This study was supported by a Grant from the Ministry of Health & Welfare, Republic of Korea [Grant number:
HI14C1324].
Scientific Reports | (2020) 10:13833 | https://doi.org/10.1038/s41598-020-70799-0 8
Vol:.(1234567890)www.nature.com/scientificreports/
Author contributions
Study Conception and Design, E.H.L., M.S.P., and K.S.C.; Acquisition of Data and experiments, E.H.L., J.M.P.,
M.H.S., S.G.L., N.S.K., K.S.C., Y.S.K.; Analysis and Interpretation of Data, E.H.L., J.M.P., M.S.P., J.C.P., and K.S.C.;
Drafting of Manuscript, E.H.L., K.S.C.; Technical Support and consulting, J.M.P., J.C.P.; All authors have read
and approved the final manuscript.
Competing interests
The authors declare no competing interests.
Additional information
Supplementary information is available for this paper at https://doi.org/10.1038/s41598-020-70799-0.
Correspondence and requests for materials should be addressed to J.-C.P. or K.S.C.
Reprints and permissions information is available at www.nature.com/reprints.
Publisher’s note Springer Nature remains neutral with regard to jurisdictional claims in published maps and
institutional affiliations.
Open Access This article is licensed under a Creative Commons Attribution 4.0 International
License, which permits use, sharing, adaptation, distribution and reproduction in any medium or
format, as long as you give appropriate credit to the original author(s) and the source, provide a link to the
Creative Commons licence, and indicate if changes were made. The images or other third party material in this
article are included in the article’s Creative Commons licence, unless indicated otherwise in a credit line to the
material. If material is not included in the article’s Creative Commons licence and your intended use is not
permitted by statutory regulation or exceeds the permitted use, you will need to obtain permission directly from
the copyright holder. To view a copy of this licence, visit http://creativecommons.org/licenses/by/4.0/.
© The Author(s) 2020
Scientific Reports | (2020) 10:13833 | https://doi.org/10.1038/s41598-020-70799-0 9
Vol.:(0123456789)You can also read