Vartalaap: What Drives #AirQuality Discussions: Politics, Pollution or Pseudo-science? - Urban Emissions
←
→
Page content transcription
If your browser does not render page correctly, please read the page content below
Vartalaap: What Drives #AirQuality Discussions: Politics,
Pollution or Pseudo-science?
RISHIRAJ ADHIKARY, IIT Gandhinagar, India
ZEEL B PATEL, IIT Gandhinagar, India
TANMAY SRIVASTAVA, IIT Gandhinagar, India
NIPUN BATRA, IIT Gandhinagar, India
MAYANK SINGH, IIT Gandhinagar, India
UDIT BHATIA, IIT Gandhinagar, India
SARATH GUTTIKUNDA, UrbanEmissions.info, India
Air pollution is a global challenge for cities across the globe. Understanding the public perception of air pollution
can help policymakers engage better with the public and appropriately introduce policies. Accurate public
perception can also help people to identify the health risks of air pollution and act accordingly. Unfortunately,
current techniques for determining perception are not scalable: it involves surveying few hundred people with
questionnaire-based surveys. Using the advances in natural language processing (NLP), we propose a more
scalable solution called Vartalaap to gauge public perception of air pollution via the microblogging social
network Twitter. We curated a dataset of more than 1.2M tweets discussing Delhi-specific air pollution. We
find that (unfortunately) the public is supportive of unproven mitigation strategies to reduce pollution, thus
risking their health due to a false sense of security. We also find that air quality is a year-long problem, but
the discussions are not proportional to the level of pollution and spike up when pollution is more visible. The
information required by Vartalaap is publicly available and, as such, it can be immediately applied to study
different societal issues across the world.
CCS Concepts: • Human-centered computing → Social and Behavioral Science.
Additional Key Words and Phrases: social media; air pollution; perception
ACM Reference Format:
Rishiraj Adhikary, Zeel B Patel, Tanmay Srivastava, Nipun Batra, Mayank Singh, Udit Bhatia, and Sarath
Guttikunda. 2021. Vartalaap: What Drives #AirQuality Discussions: Politics, Pollution or Pseudo-science?.
Proc. ACM Hum.-Comput. Interact. 5, CSCW1, Article 96 (April 2021), 29 pages. https://doi.org/10.1145/3449170

1 INTRODUCTION
Ambient fine particulate (PM2.5 ) is the most significant risk factor for premature death, shortening
life expectancy at birth by 1.5 to 1.9 years [7]. 91% of the world’s population lives in areas where
air pollution exceeds safety limits1 . 99% of the people in countries like India, Pakistan, Nepal, and
Bangladesh experience ambient exposures of PM2.5 exceeding 75 / 3 to 100 / 3 [8]. India is
among the top 13 countries with the highest number of death (82 per million in 2016) attributable to
1 https://www.who.int/health-topics/air-pollution Last accessed: 8 October 2020

Authors’ addresses: Rishiraj Adhikary, IIT Gandhinagar, India; Zeel B Patel, IIT Gandhinagar, India; Tanmay Srivastava,
IIT Gandhinagar, India; Nipun Batra, IIT Gandhinagar, India; Mayank Singh, IIT Gandhinagar, India; Udit Bhatia, IIT
Gandhinagar, India; Sarath Guttikunda, UrbanEmissions.info, New Delhi, India.

Permission to make digital or hard copies of all or part of this work for personal or classroom use is granted without fee
provided that copies are not made or distributed for profit or commercial advantage and that copies bear this notice and
the full citation on the first page. Copyrights for components of this work owned by others than ACM must be honored.
Abstracting with credit is permitted. To copy otherwise, or republish, to post on servers or to redistribute to lists, requires
prior specific permission and/or a fee. Request permissions from permissions@acm.org.
© 2021 Association for Computing Machinery.
2573-0142/2021/4-ART96 $15.00
https://doi.org/10.1145/3449170

 Proc. ACM Hum.-Comput. Interact., Vol. 5, No. CSCW1, Article 96. Publication date: April 2021.
 96
96:2 Rishiraj Adhikary et al.

ambient air pollution2 . Previous studies show that timely and informed action against air pollution
can help policymakers make informed decisions to reduce health risk [15, 49]. The successful
implementation of mitigation strategies depends on public participation and response. Both public
participation and response are highly dependent on the public’s perception of air pollution and
its associated health effects. For instance, studies show that people are less likely to go outdoors
when perceived pollution is high [61]. Understanding public perception in social media is an active
research area [24, 36].

Understanding the public perception of air pollution and its associated health effects can help
policymakers engage with the public, appropriately educate and introduce mitigation strategies,
understand public participation and pain points, and estimate the odds of success for a mitigation
strategy. Further, in an ideal case, the threat perception from air pollution should be proportional
to the severity of air pollution [2, 3]. Effective communication and education strategies can po-
tentially help the public understand the health impacts of air pollution better. Thus, accurately
understanding perception can inform policymakers and potentially save millions of lives [22, 28, 68].

Existing techniques, like questionnaire-based surveys, are not scalable to understand air pollution
perception. They do not incorporate temporal reaction changes in opinions and involve a few,
tens to a hundred participants only. In this paper, we leverage the advances in natural language
processing (NLP) and the volume, variety, and velocity of data [51] to propose a scalable approach
called Vartalaap3 to gauge public perception of air pollution via the microblogging platform Twitter.

We focus our study on air pollution in the capital city of Delhi, India. We choose Delhi as our
testbed because i) We have local expertise about air pollution in Delhi; ii) Delhi is often called the
most polluted city in the world; iii) Delhi has a dense population, and thus potentially millions of
people are at health risk; iv) Various mitigation strategies have been proposed so far in Delhi, and
people extensively discuss these strategies in social media. In this work, we have collected more
than 1.2M tweets reflecting Twitter discussions on Delhi’s air pollution from more than 26K in-
dividual users based on 34 search queries and hashtags on air pollution (January 2016 to March 2020).

This paper broadly discusses four intertwined research questions
 (1) What is the public sentiment towards different mitigation strategies?
 (2) Does air pollution ‘cause’ Twitter discussions in proportion to pollution levels?
 (3) Who are the air quality protagonists, and how do they influence the discussion?
 (4) What are the set of topics discussed, and how do the topics evolve?
First, we evaluate the sentiment associated with untested mitigation strategies on air pollution.
Untested mitigation strategies can give the public a false sense of security besides wasting taxpay-
ers’ money. We manually labelled a set of 1523 tweets representing two particular air polluting
mitigation strategies. We also trained a sentiment classifier and demonstrate its state-of-the-art
performance gain. Overall, we found that sentiment towards both the strategies is supportive, albeit
unscientific.

Most of the tweets on mitigation strategies are event-driven, which let us presume a relationship
between pollution levels and Twitter discussion. Thus we propose our second research question
i.e, whether air pollution is a year-long problem in Delhi and does it ‘Granger-cause’ [30] Twitter
2 https://www.who.int/gho/phe/outdoor_air_pollution/burden/en/ Last accessed: 8 October 2020
3 Vartalaap means conversation in Hindi

Proc. ACM Hum.-Comput. Interact., Vol. 5, No. CSCW1, Article 96. Publication date: April 2021.
Vartalaap 96:3

discussion? We first show that air pollution remains above the World Health Organisation (WHO)
standard for more than 90% of the time. To verify ‘Granger-causality’, we ensure that the two time
series (PM2.5 and number of tweets) are stationary. We found that PM2.5 ‘Granger-causes’ Twitter
discussion only in winter months while pollution is above WHO limits throughout the year, thus
harming health. This finding suggests the need for a sustained conversation throughout the year.

Having understood the awry discussion throughout the year, we apply topic modelling to under-
stand the discussed topics and their evolution. Topic modelling helps to understand if the public
has a good understanding of causes, implications, and remedies for air pollution. We categorise
the observed topics into i) event specific such as short-term mitigation strategies, fog v/s smog,
world health day, climate change, and; ii) event agnostic such as lung health, and road traffic. A
significant amount of air quality discussion comes from event-specific topics. The discussion is
limited to a few months and a small set of users. Lastly, we address our third research question, i.e. is
the air quality discussion dominated by a small group of users who follow power-law characteristics?

Our research can significantly improve the scalability of air quality perception (and similar societal
issues) studies by mining social media data. Our work on air pollution perception is over an ex-
tended time, involves 1.2M tweets from 26.4K users, and hence more extensive in scale compared
to questionnaire-based surveys. To the best of our knowledge, this is the first large scale study
in terms of dataset and analysis performed to understand the air pollution perception. Our study
can be replicated to any other part of the world, and our techniques can be adapted for real-time
information via a dashboard to policymakers.

Reproducibility and Dataset release: We believe that our work is fully reproducible, and we
publish ‘Tweet IDs’ of tweets used in our work adhering to the Twitter ToS (Terms of Service) in
our project repository4 . Archiver tools such as DocNow’s twarc5 can be used to archive the tweets’
metadata from ‘Tweet IDs’. All our tables and figures are reproducible with the code shared in the
same URL.

We now discuss the paper organisation. Section 2 describes the related work. Section 3 explains the
dataset curation process. Section 4 motivates all the research questions and lays down the approach
to validating them. Section 5 evaluates the research questions and Section 5.3 evaluates the topic
model. We discuss the limitation and future direction of our work in Section 6 and conclude in
Section 7.

2 RELATED WORK
We can categorise the related work in air quality perception into two categories: i) Questionnaire-
based surveys, and ii) Social media sentiment and topic analysis. We now describe the perception
studies based on questionnaire-based surveys.

2.1 Perception studies using questionnaire-based surveys
Traditionally, researchers have used questionnaire surveys to collect data on perceived air quality
level and public displeasure with air pollution. Egondi et al. [28] performed a cross-sectional study
of 5,317 individuals aged 35+ years in Nairobi in the year 2013. The study established levels and
associations between perceived pollution and health risk perception among slum residents. They
4 https://github.com/rishi-a/Vartalaap
5 https://github.com/DocNow/twarc Last accessed: 8 October 2020

 Proc. ACM Hum.-Comput. Interact., Vol. 5, No. CSCW1, Article 96. Publication date: April 2021.
96:4 Rishiraj Adhikary et al.

found a mismatch between air pollution and its perceived levels. A similar mismatch was reported
by Peng et al. [44]. They used social survey data from over 5000 respondents and statistical data
from the Ministry of Environment Protection of China. In Canada, Atari et al. [9] conducted a
similar survey and observed a significant correlation between odour annoyance scores and modelled
ambient pollution. In another study, Semenza et al. [56] revealed that only ∼ 10-15% of one-third of
the participants claimed to have reduced outdoor activities during high pollution as per government
advisory. Thus, the advisory may not lead to behaviour change as much as air quality perception
does. Bickerstaff et al. [13] interviewed members of the public and demonstrated the need to
understand air pollution perception if the objectives of environmental are to be achieved. On the
policy front, Huang et al. [34] conducted surveys on three cities of China and revealed a gap in
China’s policy objective and public acceptable risk level from air pollution.

Questionnaire-based surveys have focused more on finding a relationship between actual air quality
and its perceived levels. There is a need to study the causal analysis between air pollution and its
perception. There is also a need to understand what changes public opinion. In contrast, our work
scales to a much larger population and is not limited to a one-time survey.

2.2 Social media for sentiment analysis
Social media is now used as the largest ubiquitous sensor. It has been used to understand public
sentiments on climate change [1, 6, 23], air quality [27, 31, 63], and finding correlation between
air quality index (AQI) and volume of social media messages [37]. Abbar et al. [1] analysed con-
versations and sensed public awareness of climate change. They examined the discourse in 36K
tweets which talk about climate change. In another work, An et al. [6] attempts to understand
whether Twitter data mining can complement and supplement insights about climate change
perception. They showed how Twitter data could be used to illustrate the change in opinions over
time after specific events. Dahal et al. [23] performed topic modelling and sentiment analysis on
geotagged tweets to conclude that climate change discussion on Twitter concerning USA residents
is less focused on policy-related topics than other countries. Deteriorating air quality is a primary
concern for countries like India and China. In China, Tao et al. [63] collected 27,500 comments from
a Chinese microblog regarding the air quality of primary tourist destinations in China. Results
indicated that tourists’ perceptions of air quality were mainly positive, and they had a poor air
pollution crisis awareness. Dong et al. [27] used data from another Chinese microblog and explored
the relationship between the actual level of air pollution and residents concern about air pollution.
They found out that residents perceived the deprivation of air quality and expressed their interest
in air pollution within a day after the pollution level rose. There is a need to extend such studies to
one of the most polluted and densely populated cities of the world, i.e. Delhi (India).

In India, Basu et al. [11] tried to understand the public perception of a Government policy targeting
air pollution mitigation. Gurajala et al. [31] collected Twitter data for nearly two years and analysed
these data for three major cities, namely, Paris, London and New Delhi. They identified three
hashtags that best determine people response to air quality and also conclude that health-related
discussions spike up when air quality indices deteriorate. Furthermore, topic modelling analysis
revealed topics associated with sporadic air quality events, such as fireworks during festivals.
Pramanik et.al. [46] tailored an algorithm to identify the users who actively tweet about air pol-
lution events in Delhi, India. They curated a dataset of 166K tweets using six keywords and hashtags.

The studies on climate change and air quality perception have so far been small in scale either
concerning data collection or for the data being finally analysed.

Proc. ACM Hum.-Comput. Interact., Vol. 5, No. CSCW1, Article 96. Publication date: April 2021.
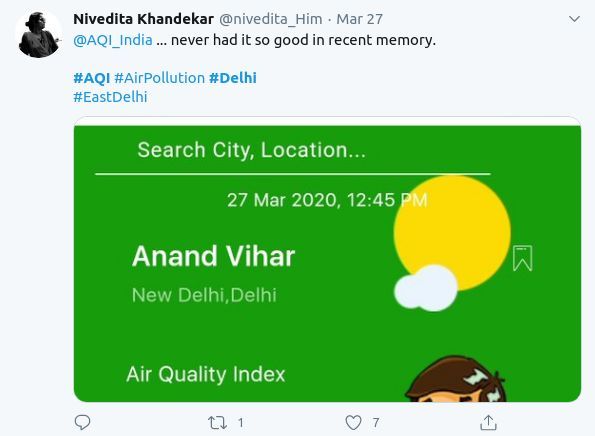
Vartalaap 96:5

3 DATASET
The current study curates rich time-stamped datasets from two different sources. The first dataset
comprises air quality real-time readings. The second dataset contains tweets discussing the air
quality and its significant repercussions. Table 1 shows an overview.

3.1 The PM2.5 Dataset
The PM2.5 dataset comprises near real-time information on particulate matter of size less than
2.5 microns in diameter from the majority of locations in Delhi. The data is curated from Central
Pollution Control Board6 , India sourced via OpenAQ7 . OpenAQ posts raw files on PM2.5 values. The
data is available at every 10 minutes interval from different stations across the city. We define Delhi
PM2.5 data as a mean aggregate of the data from all the stations. Since there can be deviations in
PM2.5 readings across different locations in the city, we averaged across locations to create a single
representative reading for the city. We removed data points which were missing and outside the
measurement range6 of 0 / 3 ≤ PM2.5 < 1000 / 3 . After data cleaning, we took the average
of all PM2.5 values on a single day. Thus, we have a PM2.5 value for every day from 2016 to 2019 for
the entire city of Delhi.

3.2 The Tweet Dataset
We collect publicly available Twitter data using a Python library named ‘GetOldTweets-python’8 .
We have 1.2 Million tweets on Delhi air pollution from 26.4K unique users. We use the queries
mentioned in Table 2, which includes keywords and hashtags. We chose these specific queries by: i)
consulting with air quality experts; ii) studying trending queries; iii) initial exploratory analysis; iv)
studying hashtags and text used by a few sets of accounts that exclusively talk about air quality, and
v) Snowball sampling, i.e. using keywords that appear in the tweets retrieved from other queries.
For example, while investigating tweets retrieved using the query ‘delhi air quality’, we found that
the queries ‘delhi smog’ and ‘delhi fog’ were interchangeably used to discuss Delhi’s air pollution.
The data set also contains meta-information, including username, follower count, and likes.

Verifying if the collected data is about Delhi air pollution: We found that there were several
irrelevant tweets whenever we used a more general query. For example, the query ‘air pollution’
returned tweets specific to China, Germany, UK and Delhi. To choose Delhi relevant tweets, we
changed our query (‘delhi air pollution’) and re-evaluated 200 random tweets from that query.
We iterated this procedure for other queries as well. We used lookahead and look behind regular
expressions in conjunction with these queries. We finally curated a list of 34 Delhi specific queries.
Finally, we manually investigated 1000 random tweets from the final 1.2 M tweets (curated using
34 queries) and found 2.4% of them to be irrelevant to Delhi air pollution. Most of the unrelated
tweets were advertisements which used air pollution-related hashtag.

4 APPROACH
In this section we state our research questions and explain our approach to address them.
6 https://cpcb.nic.in/Last accessed: 8 October 2020
7 https://openaq.org Last accessed: 8 October 2020
8 https://github.com/Jefferson-Henrique/GetOldTweets-python Last accessed: 8 October 2020 (such web-crawling is allowed

under Twitter ToS adhering to terms and conditions)

 Proc. ACM Hum.-Comput. Interact., Vol. 5, No. CSCW1, Article 96. Publication date: April 2021.
96:6 Rishiraj Adhikary et al.

 Time-period Jan’16 to Dec’19

 PM2.5
 Locations 13

 Granularity level 1 Hour
 Time-period Jan’16 to Apr’20
 Twitter Total Tweets 1,252,999

 User Profiles 2,645,61
 Table 1. Salient statistics of the curated datasets.

Queries
delhiagainstpollution, delhi against pollution, delhipollution, delhi pollution, smogtower, smog tower,
delhi air, delhiair, delhi air emergency, delhiairemergency, delhichokes, delhi chokes, delhi air quality,
delhiairquality, delhi smog, delhismog, oddeven, odd even, delhi fog, delhifog, air lodhi garden,
air sarojini nagar, air chandni chowk, air gurgaon, delhincr, air ncr, air noida, air punjab, air haryana,
air vehicle delhi, air road delhi, air school delhi, air children delhi, stubble burning delhi
 Table 2. List of 34 queries used to identify Delhi based tweets

4.1 RQ1: What is the public sentiment associated with untested mitigation strategies?
4.1.1 Background. Governments across the world have proposed and implemented several strate-
gies for reducing air pollution. In Germany renewable energy investment and expansion of public
transport is being promoted9 . The Netherland government has industrial emissions policy to com-
bat air pollution10 . Various mitigation strategies are also being adopted in India. These strategies
include, but, are not limited to: i) using higher-grade fuel for vehicles11 ; ii) cutting emissions from
power plants12 . However, some of the proposed and implemented strategies have not yet been
proven to work. In fact, several studies [20, 43] suggest that these strategies will not help reduce air
pollution. One such highly debated strategy is installing outdoor air purifiers called “Smog Tower”
[17]. These “Smog Towers” have been piloted in China in 201813 . In India, a “Smog Tower” was
installed by a member of parliament and inaugurated in the first week of January 2020. A recent
paper outlines the basics of atmospheric sciences to show that installing “Smog Towers” is an
unrealistic solution [32]. Such solutions may give the public a false sense of security and harm their
health besides not reducing air pollution. Experts suggest that the best strategy is to cut emissions
from the sources such as household [19] and industrial emissions [33].

9 https://www.unenvironment.org/resources/policy-and-strategy/air-quality-policies-germany Last accessed: 8 October
2020
10 https://ec.europa.eu/environment/air/pdf/reduction_napcp/NL%20final%20NAPCP%201Apr19%20EN.pdf Last accessed: 8

October 2020
11 https://www.thehindubusinessline.com/economy/policy/smoggy-delhi-to-get-bsvi-fuel-from-april-oil-ministry/

article9961764.ece Last accessed: 8 October 2020
12 https://www.thehindu.com/news/national/other-states/rajghat-badarpur-coal-plants-to-close/article7950494.ece Last

accessed: 8 October 2020
13 https://www.businessinsider.com/china-builds-worlds-biggest-air-purifier-2018-12?IR=T Last accessed: 8 October 2020

Proc. ACM Hum.-Comput. Interact., Vol. 5, No. CSCW1, Article 96. Publication date: April 2021.
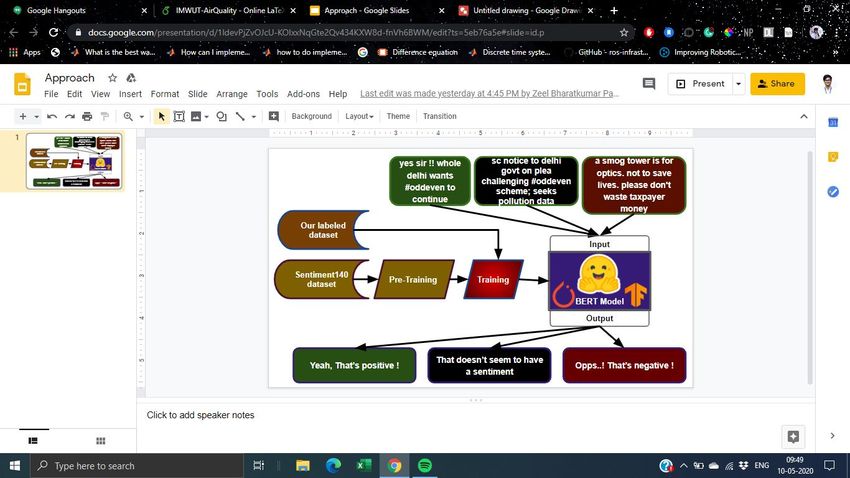
Vartalaap 96:7

Another rigorously discussed solution is a vehicle rationing scheme called “Odd-Even”. Vehicles
having number plates ending with even numbers are allowed to operate on even dates, while those
with odd numbers are allowed on odd dates. Two-wheelers, women, and private vehicles carrying
school children are exempted in the scheme. A study by Chowdhury et al. [20] shows that the
average reduction in PM2.5 concentration was about 4-6% during Jan-2016 implementation, which is
within the uncertainty range of satellite-based estimates. Thus, the jury is still out on the efficacy of
the “Odd-Even” scheme. Therefore, it is important to know the public perception of such solutions.
We try to analyse the same in the subsequent sections.

We chose these two mitigation strategies for our analysis because i) “Odd-Even” was implemented
four times in the last four and half years in Delhi and has received significant attention on social
media. ii) Although it is now proven [32], we knew that “Smog Tower” is a pseudo-scientific solution
while working closely with air quality experts. Hence, we wanted to understand how people
perceive their effectiveness. Other mitigation strategies including but not limited to restricting
stubble burning [42], regulating industrial pollution [58], and increasing the number of electric
vehicles [66] do not gather much social media attention or out of the actionable region of the local
government.
4.1.2 Problem Statement. Our goal is to measure the public sentiment towards the untested mitiga-
tion strategies by classifying the pertinent tweets into three classes: i) supportive ii) unsupportive,
and iii) neutral. By supportive, we mean supportive towards untested mitigation strategies and
vice versa.
4.1.3 Approach. We require an accurate and diverse language model to represent the semantics of
the tweet text. Bidirectional Encoder Representation from Transformers (BERT) [26] is a state-of-
the-art language model. BERT contains bidirectional representations of words in all layers on the
unlabelled text as shown in Figure 1. However, BERT is trained on Wikipedia data and retraining it
directly on social-media data is a challenging task due to resource requirements. The Wikipedia
documents are different from Twitter tweets in the following ways,
 • Subjective nature of Twitter data differs completely from the objective nature of Wikipedia
 documents. Certain tweets can show different sentiments by changing the context.
 • Use of slang and informal language is common on Twitter. However, Wikipedia uses a more
 formal and structured language.
 • Length of documents in Wikipedia is larger than tweet-length limited to 280 characters. Thus,
 contextual continuation is lengthier in Wikipedia documents compared to Twitter tweets.
 • Hashtags and mentions are specific features of Twitter and not visible in Wikipedia documents.
 • Tweets are more conversational in nature, and a significant proportion of tweets are replies.
Adding to that, BERT models can not be used directly for sentiment predictions as they are trained
on unlabeled datasets to learn the linguistic features automatically. We fine-tune the weights of
its hidden layers for specific tasks (sentence classification task in our case). In this variant, we
use our tweet dataset to fine-tune the BERT layers as described in Figure 2. During the process,
all the attention layers try to learn a representation with a specific context. In the end, we have
a fully connected softmax layer to output the prediction probability of each of the three classes
(supportive, unsupportive, and neutral).

 Proc. ACM Hum.-Comput. Interact., Vol. 5, No. CSCW1, Article 96. Publication date: April 2021.
96:8 Rishiraj Adhikary et al.

 BERT BERT
 BERT BERT
 Sentence Attention Output
 Tokenizer Embedding
 layers layer
 Variable Maximum length (Max length, (Max length, Number of
 Size
 length of sentence 768) 768) Class

 Fig. 1. Simplified architecture of language model BERT.

 OUR
 DATASET

 FINE-TUNING

 Predicted
 Input tweet
 sentiment
 1.5 hrs of Odd Positive 0.75
 Even reduced Neutral 0.2
 aqi from 1197
 to 576 Negative 0.05

 Fig. 2. Representation of BERT fine-tuned model

4.2 RQ2: Is Air pollution an year-long problem and does it ‘Granger-cause’ Twitter
 discussions?
We believe that events like visible smog or policy announcement bring about an episodic concern
among people about air pollution. Episodic discussions are ignored as they are short-lived. An
ongoing concern about air pollution in social media contributes to political and social enthusiasm
for the enforcement of mitigation policies. We hypothesise that air pollution is a year-long problem,
but it does not ‘Granger-cause’ twitter discussion [30].

There are two steps required in addressing this research question. First, we need to validate that air
pollution is a year-long problem. We will use the WHO specified categorisation of PM2.5 values by
their severity (shown in Table 3). We hypothesise that air pollution would be a year-long problem
as per the WHO norms. For validating the same, we will be “aggregating” the hourly PM2.5 values
into 24 hours. We then visualise the PM2.5 values and compare it with the WHO standard and
Indian standard of air quality.

Next, we need to validate that Air pollution (PM2.5 ) does not ‘Granger-causes’ Twitter discussion
as follows.
 (1) We would aggregate the the total number of tweets for each day from 2016 to 2019. We also
 have PM2.5 value for each day as explained in Section 3.
 (2) We would check if both these time series are mean and variance stationary. If, not we apply the
 difference operation − −1 and make them stationary. We perform Kwiatkowski–Phillips
 –Schmidt–Shin (KPSS) statistical test [39] to confirm that data is stationary.
 (3) Next, we compute the rolling ‘Granger-causality’ [64] value of PM2.5 causes Twitter discussion
 over each month of all the years.
 (4) We next compute the value statistic and check if the magnitude is significant.
 (5) For our hypothesis to be true, we would expect, to be less than 0.05.

Proc. ACM Hum.-Comput. Interact., Vol. 5, No. CSCW1, Article 96. Publication date: April 2021.
Vartalaap 96:9

 PM2.5 Level Basis for the selected level
 These levels are associated with about a 15% higher
 35
 long-term mortality risk relative to the AQG
 In addition to other health benefits, these levels
 25 lower the risk of premature mortality by
 approximately 6%
 In addition to other health benefits, these levels
 15
 reduce the mortality risk by approximately 6%
 These are the lowest levels at which total,
 cardiopulmonary and lung cancer mortality has
 10
 been shown to increase with more than 95%
 confidence in response to long-term exposure to PM
Table 3. WHO air quality guidelines and interim targets for particulate matter: annual mean concentrations.

4.3 Topic Modelling

 Ѱ

 Fig. 3. A representative diagram of LDA for topic modelling.

Previously we have talked about sentiment towards mitigation strategies and ‘Granger-causality’
between PM2.5 and twitter discussion. It is also important to reveal the topics of air pollution
discussion on social media to understand the public’s awareness and perception. An important
aspect of air pollution is to understand i) what topics of air pollution does each tweet represent
and ii) how do the most common topics evolve. It is practically impossible to look into each tweet
and assign a topic label due to the dataset size. We can apply an unsupervised machine learning
technique known as topic modelling [14] to determine the topics for each tweet. Suppose, the entire
tweet corpus consists of topics, then each of the tweets will belong to all the topics with some
probability score. The topics produced per tweet are a probabilistic mixture of words. A good topic
model would provide topics that are human-interpretable and are distinct from each other.

Latent Dirichlet Allocation (LDA): Among several topic modelling techniques, LDA is a popular
topic modelling technique created by Blei et al. [14]. We feed the tweets (documents), where
each tweet has number of words and the number of topics ( ) is feed into the LDA model. The

 Proc. ACM Hum.-Comput. Interact., Vol. 5, No. CSCW1, Article 96. Publication date: April 2021.
96:10 Rishiraj Adhikary et al.

model returns topics where each topic is a cluster of words. is the probability distribution of
words in a topic. is the probability distribution of topics per document. Concentration parameter
 represent topic density per document, and represent word density per topic. We feed our tweet
corpus into the LDA and evaluate the output topics. Figure 3 demonstrates the process, and more
details can be found in the appendix. The choice of initialisation parameters: number of topics ( )
and number of iterations ( ) can be made using topic coherence measure [5, 52], explained in the
experimental settings in Section 5.3.

4.4 RQ3: Is the air quality discussion dominated by a small set of users who follow
 power-law characteristics?
Efforts to inform the scientific basis of air pollution can influence opinion and thereby influence
policy-making. An endorser’s Twitter post could positively impact attitude towards air pollution
mitigation effort [47]. When it comes to air pollution in Delhi, we hypothesise that a small set
of users dominate Twitter posts [38] and the number of tweets follow a Pareto distribution. To
address this research question, we aggregate the total number of tweets by every user and sort
them in decreasing order. We then try to validate if the probability distribution of the number of
tweets by each user follow the form ( ) ∝ − , where is the user number.

5 EVALUATION
We now evaluate our hypotheses with various experiments and analyse them in the subsequent
sections.

5.1 Addressing Research Question 1
“RQ1: What is the public sentiment associated with untested mitigation strategies?”.
5.1.1 Dataset filtering and labelling. We test the sentiment towards two untested mitigation strate-
gies “Smog Tower” and “Odd-Even”. We discussed these mitigation strategies in Section 4.1.1. Thus,
we need to filter the dataset for “Smog Tower” and “Odd-Even” tweets, and annotate the individual
tweets. We use the same strategy used in Section 3.2 to ensure that there is least number of false
positives or false negatives present in the filtered dataset. There is a subset of tweets (around 20%) in
regional languages in our dataset. For this analysis, we have considered only the English tweets as
the BERT model is pre-trained on English text only. We used Textblob14 for detecting the language
of each tweet in our dataset [48]. After removing non-English tweets, we have 516 and 80,343
tweets for “Smog Tower” and “Odd-Even”, respectively. We use the BERT model to account for
scalability in the future despite a lower number of tweets on “Smog Tower”. For “Odd-Even” we
have enough tweet to gauge the perception. For annotation, we consider all 516 tweets for “Smog
Tower” and randomly sampled 1100 tweets over time for “Odd Even”. Multiple tweets with the
same text do not add any value to the sentiment detection task. Thus, we remove duplicate tweets.

Three authors annotated these tweets after referring to experts in air quality analysis. We annotated
each tweet into one of the three classes: Supportive, Neutral, or Unsupportive, signifying their
nature of support for these mitigation strategies. In these datasets, we have less than 2% tweets that
are difficult to annotate because of subjectivity, satire or multiple sentiments present in a single
tweet. The Cohen’s kappa score15 , which is a statistic that measures inter-annotator agreement, was
0.98 and 0.97 for “Smog Tower” and “Odd-Even”, respectively. A Cohen’s kappa score greater than
0.9 is sufficiently good value for confirming inter-annotator agreement[41]. We finally annotated
14 https://textblob.readthedocs.io/en/dev/ Date accessed: 8 October 2020
15 https://en.wikipedia.org/wiki/Cohen%27s_kappa Last accessed: 8 October 2020

Proc. ACM Hum.-Comput. Interact., Vol. 5, No. CSCW1, Article 96. Publication date: April 2021.
Vartalaap 96:11

 Mitigation strategies
 Sentiment
 Odd-Even Smog Tower
 Supportive 238 285
 Neutral 668 82
 Unsupportive 187 63
 Total 1093 430
 Table 4. Class distribution for sentiment towards untested mitigation strategies in our labelled data set.

430 and 1093 unique tweets for “Smog Tower” and “Odd-Even”, respectively. We found that for each
tweet at least two annotators have given the same labels thus we get the final labels via majority
voting among all annotators. We prepossessed the tweets to remove URLs. We do not remove
hashtags as hashtags can present important contextual cues in tweets. As an example, “Say NO
to #FossilFuel. Adopt #OddEven , #Solarand #OrganicFarming all over the world”. We observe that
without hashtags the preceding sentence would be incomplete. Another example is a sarcastic tweet,
“What’s to fear? We have #SmogTower now. #SmogTowerSoGood #Sarcasm #MyRightToBreathe”. We
can notice that ‘#Sarcasm’ and ‘#SmogTowerSoGood’ hashtags indicate the nature of tweet, which
is sarcastic. The class distribution for each untested mitigation strategy in our labelled dataset is
shown in Table 4.

5.1.2 Baseline Approaches. We compare the performance of our approach against three baseline
approaches. We use preprocessed dataset discussed in section 5.1.1 for each of the following
baselines:
 • Naive Bayes Classifier: Naive Bayes Classifier is a generative classifier commonly used as a
 baseline in sentiment analysis [54, 55, 65]. The first step is to tokenise the preprocessed tweets.
 Once we have the tokens, we create a bag of words16 . Each token in this representation has a
 certain probability of belonging to one of the three classes. We ignore the order of occurrence
 of tokens and focus only on the number of occurrences of the tokens in this baseline. We
 maximise P(t|c) for token t with respect to class c using Bayes’ theorem, (t|c) = ( | ( )
 ) ( )
 .
 • BiLSTMs (Bidirectional Long Short Term Memory): Sequential neural network models
 have made great strides in the semantic composition methods for sentiment analysis [40, 67].
 In recent years, LSTMs have overcome the problem of vanishing gradients in RNNs. BiLSTMs
 connects two hidden LSTM layers to the same output, such that one of the LSTM layers
 is on the input sequence and other on the reverse of the input sequence. BiLSTM helps in
 understanding the context concerning both preceding and succeeding tokens.
 • Classifiers with BERT embeddings: In this baseline approach, the pre-trained BERT model
 generates the sentence embeddings for the tweets. The feature vector serves as input for
 different classifiers shown in Table 9, which predict the tweet’s sentiment17 .
5.1.3 Evaluation Metric. We use macro averaged F1 score as the evaluation metric based on its
usage in prior work [10, 45]. The F1 score takes both precision and recalls into account, is computed
 precision · recall
by the following equation, 1 = 2 · precision + recall . The macro averaged F1 score tells about
the overall performance of the baselines and BERT twice fine-tuned for a multi-class classification,
is given by: 1 =1 , where Fn is the F1 score for nth class and N is total number of classes.
 Í

16 https://en.wikipedia.org/wiki/Bag-of-words_model Last accessed: 8 October 2020
17 http://jalammar.github.io/a-visual-guide-to-using-bert-for-the-first-time/Last accessed: 8 October 2020

 Proc. ACM Hum.-Comput. Interact., Vol. 5, No. CSCW1, Article 96. Publication date: April 2021.
96:12 Rishiraj Adhikary et al.

 0.89 0.90
 Macro Averaged F1 Score

 0.8 0.71
 0.67 Naive Bayes
 (Higher is Better)

 0.59 Classifier with BERT embeddings
 0.6 0.50 0.50
 0.46 BiLSTM
 BERT fine-tuned
 0.4

 0.2

 0.0
 Odd-Even Smog Tower
Fig. 4. BERT fine-tuned model performs with a better macro averaged F1 score than baseline approaches
across both mitigation strategies under evaluation.

5.1.4 Experimental Setup. In this section, we describe the training and hyperparameter tuning
of baseline approaches and our model. For all of our models, we split our annotated dataset into
five stratified folds18 . We used nested cross-validation19 for tuning hyperparameters via grid search.
We select the best performing set of hyperparameters with the highest macro averaged F1 score
obtained. We have used the following set of hyperparameters for the baselines and our approach:
 • Naive Bayes: We tune smoothing parameter , which is known as pseudo-count and makes
 sure that probability is never zero. Another hyperparameter fit_prior is also tuned, which
 determines whether to learn class prior probabilities or not. We used the following hyperpa-
 rameter space : ∈ {0.01, 0.05, 0.1, 0.5, 1} and fit_prior ∈ {True, False}
 • Bidirectional LSTMs: We have used two Bidirectional LSTM layers followed by a dense layer
 as output. We tune the embedding size, the number of neurons in the second hidden layer, epochs
 and the batch size. We have the number of neurons in the first hidden layer to a constant
 32. The following hyperparameter space was used: embedding size ∈ {32, 64, 128}, neurons
 ∈ {8, 16, 32, 64}, batch size ∈ {16, 32, 64} and epochs ∈ {20, 30, 50, 100}
 • Classifiers with BERT embeddings: We use pre-trained BERT to get embeddings for each
 tweet from the annotated dataset. These embeddings serve as input for classifiers. We tune
 the hyperparameter of the classifiers, logistic regression, SVC (Support Vector Classifier), and
 a neural network. The hyperparameters for these classifiers is given in Table 9 (Appendix).
 • BERT fine-tuned: We only tune the epochs and batch size for the BERT keeping the dropout
 rate as 0.3 as suggested by previous literature [25] on the annotated dataset. The following
 hyperparameter space was used based on [25]: batch size ∈ {16, 32} and 10 epochs with
 early-stopping enabled based on validation loss.
5.1.5 Results. Using BERT fine-tuned, we achieve 0.90 and 0.89 macro averaged F1 score on
“Smog Tower” and “Odd-Even” datasets, respectively, which is better than other state of the art
methods [10, 57]. Figure 4 shows the comparison among all approaches. The models with BERT
outperform other approaches as BERT utilises the bidirectional training of transformer, a popular
attention model, for language modelling in contrast to previous methods which look at text sequence
from either left or right. While BERT is similar to LSTMs in bidirectional training but BERT has
a sufficiently robust language model. Naive Bayes does not account for sequential nature. The
classifiers in Table 9 with BERT embeddings does not achieve comparable performance compared
to our approach which goes through end-to-end learning.
18 https://scikit-learn.org/stable/modules/generated/sklearn.model_selection.StratifiedKFold.html
 Last accessed: 8 October
2020
19 https://scikit-learn.org/stable/auto_examples/model_selection/plot_nested_cross_validation_iris.html Last accessed: 8

October 2020

Proc. ACM Hum.-Comput. Interact., Vol. 5, No. CSCW1, Article 96. Publication date: April 2021.
Vartalaap 96:13 Unsupportive 0.81 0.13 0.06 0.87 0.05 0.08 Ground Truth Neutral 0.01 0.98 0.01 0.04 0.79 0.17 Supportive 0.01 0.17 0.82 0.00 0.01 0.99 Unsupportive Neutral Supportive Unsupportive Neutral Supportive Predicted Class Predicted Class (a) (b) Fig. 5. Confusion matrices for untested mitigation strategies: (a) BERT fine-tuned for “Odd-Even”; (b) BERT fine-tuned for “Smog Tower” Ground Sentiment ID Tweet Truth Predicted day 7: #hatersgonnahate but our #smogtower doing its job. fabricated news about rains and wind bringing relief. tomorrow, 1 when weather reverses, even then smog tower will stand. -1 1 #smogtowersogood that we are breathing. in your face , haters #myrighttobreathe #Saracsm I came to know about smog tower in delhi. appreciate work of gautam gambhir with some private investors in making this possible. 2 -1 1 this 20ft tall filter is not the ultimate solution but yes it will work for 10 to 15 % in a locality. nice step. #airpollution Wow clean Air in Delhi... Reason.. #OddEven no.. Thank you Nature for cleaning Delhi Air so that we can breath now.. 3 @ArvindKejriwal sir please stop this odd even business and -1 1 do something to stop stubble burning in adjoining states.. People will appreciate your efforts.. TYpic.twitter.com/ILtw1QQYio @VijayGoelBJP I can make out from a distant place that #OddEven is a small contribution to deal with a large problem. 4 Now, Sir, you and your colleagues are making it a Centre versus 1 -1 State issue caring little about public health of millions of people https://twitter.com/ANI/status/1191248747302252545 Table 5. Tweets from the “Odd-Even” and “Smog Tower” dataset. These tweets can be tough to classify correctly because of their ambiguity, subjectivity, and presence of multiple sentiment in same tweet. While our results outperform the SOTA baseline, there are several reasons behind the imperfect sentiment classification. First, there is instance of irony in the tweet to show disapproval for a mitigation strategy like the first tweet in Table 5. There are also instances of multiple sentiments present in a single tweet like the second and third tweet in Table 5. The second tweet appreciates the concern of policymaker towards air pollution levels but is not in support of the mitigation strategy. Similarly, the third tweet has a supportive sentiment towards natural phenomenon mitigating the pollution levels but opposes the mitigation scheme started by the Government. Such challenges are not unique to our data set and known in the NLP literature [35]. Proc. ACM Hum.-Comput. Interact., Vol. 5, No. CSCW1, Article 96. Publication date: April 2021.
96:14 Rishiraj Adhikary et al.

 1100
 Macro averaged F1 Score

 0.98 0.98 Macro averaged
 1050
 (Higher is better)

 420 F1 Score
 0.96 0.96 1000

 Support
 950 Support
 0.94 0.94
 400 900
 0.92 0.92 850
 0.90 380 0.90 800

 0.4 0.6 0.8 0.4 0.6 0.8
 Threshold Threshold
 (a) BERT fine-tuned for Smog Tower (b) BERT fine-tuned for Odd-Even

Fig. 6. Variation of Macro averaged F1 score and support with probability of predicted class (X-axis). At 0.6
confidence, BERT fine-tuned model’s macro averaged F1 score increases from 0.9 to 0.93 and from 0.89 to 0.94
with dropping support of 3% and 8% for “Smog Tower” and “Odd-Even”, respectively.

5.1.6 Analysis. We now use our approach for sentiment classification on the larger unlabelled
dataset and analyse the sentiment. However, before classification, we analyse the sensitivity of the
model’s macro averaged F1 score to the confidence in the predictions. We have a softmax output
layer, which gives a probability score for each class (supportive, unsupportive, neutral). We take the
class having the highest probability into account for a particular tweet. We now apply a threshold on
the probability of a predicted class, that is we consider only those samples for evaluation for which
the probability of predicted class is above a certain value. We do so to predict only when our model
is confident. This may lead to a reduction in predicted samples, but, the predictions will likely be
more accurate. We look at the trade-off between increasing threshold and corresponding support in
Figure 6. We find that at 0.6 confidence, BERT fine-tuned model’s macro averaged F1 score increases
from 0.9 to 0.93 with 3% drop in support for “Smog Tower”. For “Odd-Even”, at 0.6 confidence,
macro averaged F1 score increases from 0.89 to 0.94 with 8% drop in support. We do further anal-
ysis on unlabaled data with 0.6 confidence as there is significant increase in macro averaged f1 score.

We use BERT fine-tuned model to obtain sentiment around “Odd-Even”. We use a class probability
threshold of 0.6 and are able to predict 78, 597 out of 80, 343 samples. We then apply a 60 day moving
average to smoothen the predictions over time, as shown in Figure 7. Between 2016 and 2019,
“Odd-Even” scheme was implemented multiple times. We indicate these instances by vertical lines
with ‘A’ tag in Figure 7. We found that for most of the timeline under consideration, the percentage
distribution of supportive tweets is comparable to unsupportive. Before every implementation of
“Odd-Even”, the percentage of supportive tweets rises.

There are some driving events towards increment in unsupportive sentiment, as shown in Figure 7.
Nearly six months later the second implementation of “Odd-Even”, the National Green Tribunal of
India (NGT) reported that “Odd-Even” did not help in reducing the air pollution20 . The sentiment
of people became unsupportive for some time after this news. In February 2018, the Delhi Chief
Minister (CM) said that “Odd-Even” scheme is not a permanent solution to Delhi pollution21 . After
the CM’s statement, there is a huge rise in unsupportive sentiment. Six months later, in November
2018, the Supreme Court of India allowed two-wheelers to be exempted from the future imple-
mentation of “Odd-Even” to reduce the burden on the public transport system. Twitter discussion
reflecting the negative sentiment became more prominent (Figure 7) after the Supreme Court’s
20 https://indianexpress.com/article/cities/delhi/ngt-aap-odd-even-scheme-delhi-3089838/ Last accessed: 8 October 2020
21 https://twitter.com/timesofindia/status/962369979424432129 Last accessed: 8 October 2020

Proc. ACM Hum.-Comput. Interact., Vol. 5, No. CSCW1, Article 96. Publication date: April 2021.
Vartalaap 96:15

Tweet Associated sentiment
It’s about time you guys move ahead of #OddEven and #publichealth
emergency.. Do something concrete. Arrest culprits, control industrial
 Unsupportive
pollution, stop crop burning Even trying to get an artificial rain will b
more impact full What ur doing is just public gimmick
I care for my family’s health. I care for Delhi’s health I care for every
child’s health Ipledge to reduce pollution I promise to follow #OddEven
 Supportive
Do you ??? Those who care forDelhi’s Health please share your msgs.
Friends, #LetsUniteAgainstPollution
Delhi CM Says Odd-Even Scheme Can Be Extended #Delhi #OddEven
#arvindkejriwal #DelhiCM#oddevenscheme #WednesdayWisdom
 Neutral
#DelhiAirPollution #viralbake
www.viralbake.com/delhi-cm-says-odd-even-scheme-can-be-extended
 Table 6. Table showing tweets with different sentiments for “Odd-Even” Scheme.

 A A B A C D A Unsupportive
 Neutral
 Sentiment distribution

 80
 Supportive
 (in percentage)

 60 A: Odd-Even
 Scheme Impemented
 B: NGT and CPCB says
 40 Odd-Even has no impact
 C: Delhi CM says Odd-Even
 is not a permenant solution
 20
 D: Supreme Court stays NGT order
 refusing exemption to two-wheelers
 0
 2016-01 2016-07 2017-01 2017-07 2018-01 2018-07 2019-01 2019-07 2020-01 2020-07
 Timeline

Fig. 7. Evolution of sentiment around “Odd-Even” scheme over time. The vertical lines with ‘A’ tag, signify
the instances when scheme was implemented, January of 2016 and November of 2017 and 2019. ‘B’ and ‘C’
are two driving events for change in public sentiments.

verdict.

We now analyse the sentiment of the people for “Smog Tower”. For this analysis, the timeline is
from September 2016 to April 2020. We have annotated the entire set of tweets, and we use ground
truth for analysis. In the future, when there will be more discussion around “Smog Tower”, then
our model could be used for predicting sentiment and further analysis.

Due to the lesser number of tweets on “Smog Tower”, we show the sentiment over time in Figure 8 for
the cumulative tweets. We observe from the plot that at any point in time, the supportive sentiment
associated with the “Smog Tower” is more than unsupportive. There are five key events related
to the “Smog Tower”, which are shown by vertical lines in the plot. People in Delhi exchanged
Twitter interactions about “Smog Tower” for the first time when a print media tweeted about
its installation in Netherlands22 . There was a significant increase in the number of supportive
22 http://atlasofthefuture.org/project/smog-free-tower/ Last accessed: 8 October 2020

 Proc. ACM Hum.-Comput. Interact., Vol. 5, No. CSCW1, Article 96. Publication date: April 2021.
96:16 Rishiraj Adhikary et al.

 Tweet Associated Sentiment
 Smog towers are white elephants that will not fix
 Delhi’s air pollution crisis. Unsupportive
 #Delhiairpollution #cleanair #Mission808080
 Intent combined with action will always yield results!
 Sharing initial readings of Supportive
 the prototype air purifier installed last week!
 On lines of China, Delhi may get anti-smog tower by next winter.
 China has recently installed an anti-smog tower that is 100m in height Neutral
 and cleans up to about 75M m3 air per day.
Table 7. Table showing tweets with different sentiments for “Smog Tower”. The supportive tweet was by local
politician had nearly 25,500 likes and 4,000 retweets while the unsupportive tweet was by the organisation
which conducted study on “Smog Tower” had 61 likes and 48 retweets. The neutral tweets is by a leading
media house in India with 108 likes and 24 retweets.

and neutral sentiment after a smog tower was installed in Beijing, China. People became highly
supportive after India got the first working prototype. Supportive sentiments skyrocketed after
a local politician’s tweet went viral, which was in favour of smog tower. The sentiment towards
“Smog Tower” continues to remain positive. Positive sentiment could be attributed to the higher
social outreach of local politicians being vocal in favour of “Smog Tower”. Famous politicians usually
have a much higher follower count as compared to twitter handles of think-tanks who tweet on
debunking the myth about air pollution. Examples of few tweets regarding the “Smog Tower”
are given in Table 7. While there are few exceptions, the conclusion holds that the overall public
sentiment towards untested mitigation strategies is supportive, giving a false sense of security.

 A B C D E
 Unsupportive
 300 Neutral
 Number of tweets

 Supportive
 A: AtlasFuture magazine
 200 post on ”Smog Tower”.
 B: Daan Roosegaarde installed
 a prototype in Beijing.
 100 C: Kurin systems, India, got a
 six foot tall prototype
 D: Viral tweet: 106 crore
 for 53 ”Smog Towers” in Delhi
 0 E: The first ”Smog tower”
 installed at Lajpat nagar
 2017-01 2017-07 2018-01 2018-07 2019-01 2019-07 2020-01
 Timeline

Fig. 8. Cumulative sum of supportive, neutral and unsupportive tweets for “Smog Tower” over time. The rate
of increase in number of supportive and neutral tweets is significantly greater than unsupportive tweets.

5.2 Addressing Research Question 2
“RQ2: Is Air pollution an year-long problem and does it ‘Granger-cause’ Twitter discussions?”.

5.2.1 Experiment 1. To answer if air pollution is a year-long problem, we plot the daily mean of
PM2.5 for the territory of Delhi, India, as shown in Figure 9. The data of PM2.5 was from January

Proc. ACM Hum.-Comput. Interact., Vol. 5, No. CSCW1, Article 96. Publication date: April 2021.
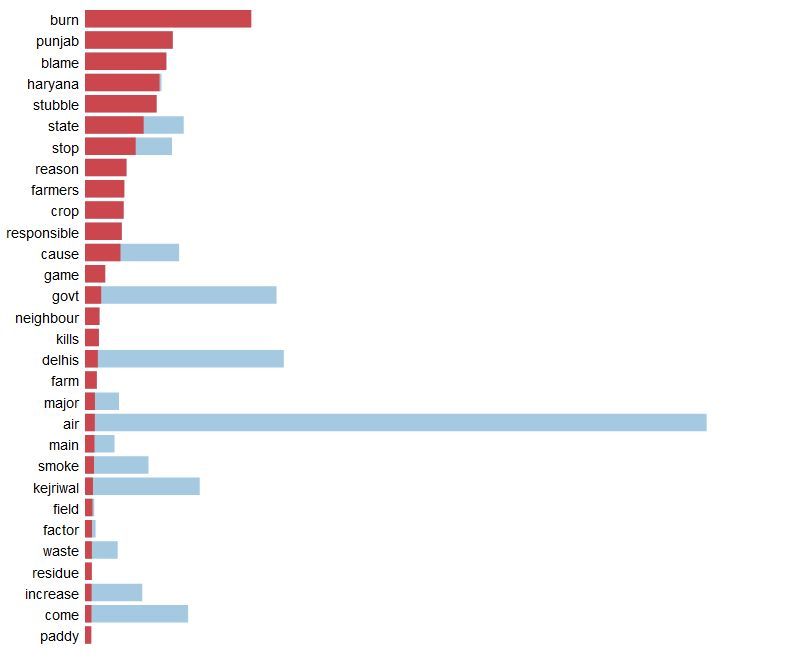
Vartalaap 96:17

 PM2.5 Satisfactory
 WHO Limit Moderately polluted
 India Limit Poor
 600 Good Very Poor

 500
 PM2.5 in µg/m3

 400

 300

 200

 100

 0
 Jul Jan Jul Jan Jul Jan Jul
 2017 2018 2019
 Time

Fig. 9. Yearly PM2.5 Level In Delhi. Colours corresponds to Indian air quality standards. The WHO and India
limit on PM2.5 is also shown.

 PM2.5 Granger Causes Tweets
 p-value

 p-value = 0.05
 0.5

 0.0
 Jan Mar May Jul Sep Nov
 Months

Fig. 10. PM2.5 ‘Granger-cause’ twitter discussion only for the month of October, November and December.

2016 to December 2019. It was observed that 92% of the time, PM2.5 levels breached the World
Health Organisation (WHO) threshold on PM2.5 , which is 25 / 3 . It violated the Indian standard
(60 / 3 ) 66.5% of the time. It is thus, imperative that air pollution is a year-long problem in Delhi.
The colour-coding in Figure 9 refers to different intervals of Indian air quality standard from good
to very poor.

5.2.2 Experiment 2. Now, we evaluate if PM2.5 ‘Granger-causes’ Twitter discussions. For this test,
we follow the steps outlined in previous literature [64] and as mentioned in Section 4.2. One critical
step is to make the time-series stationery by taking the difference operation as − −1 . If the p-
value of the ‘Granger-causality’ test is less then the significance level (0.05), then the corresponding
time series (PM2.5 ) causes the other time-series (Number of tweets).

Result: We found out that, for most months of the year (January to September), PM2.5 does not
‘Granger-cause’ Twitter discussion on air pollution (Figure 10). During October, November and
December ‘Granger-causality’ holds and it is at this time that air pollution becomes visible as
smog. Consequently, the public reacts to it via social media. Public’s reaction represented as the
density of discussion in Figure 13 also shows a similar result. Almost all the discussion about air
pollution happens during the end of a year (winter months) when pollution becomes visible as
smog. While evaluating the evolution of ‘Delhi Smog’ topic over time, we observe that its density
is high only during the winter months. The correlation between the total number of tweets (on
October, November and December) and the number of tweets under the topic ‘Delhi Smog’ is 0.91.
This seasonal increase in PM2.5 value (Figure 11) becomes extremely hazardous, and public health

 Proc. ACM Hum.-Comput. Interact., Vol. 5, No. CSCW1, Article 96. Publication date: April 2021.
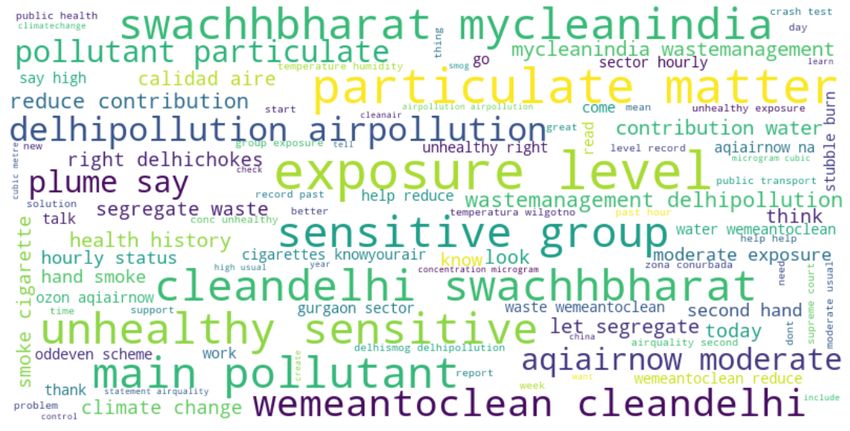
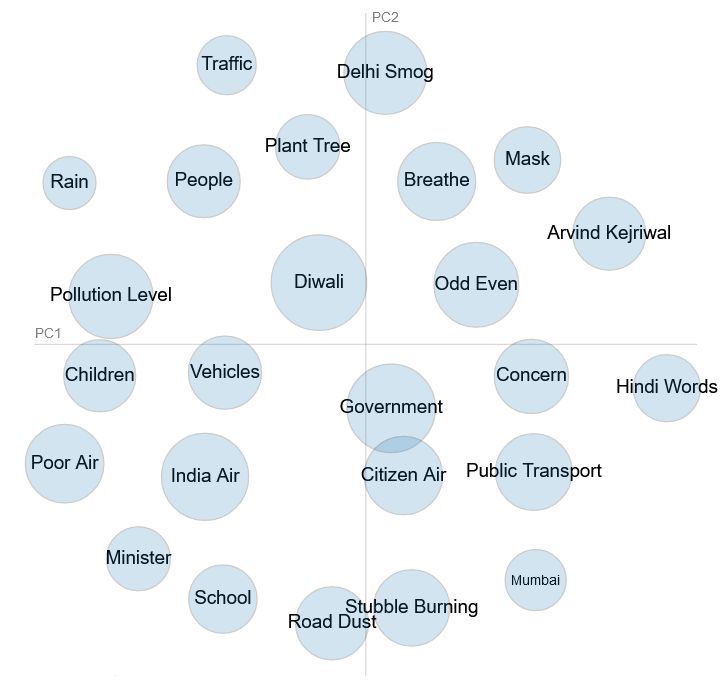
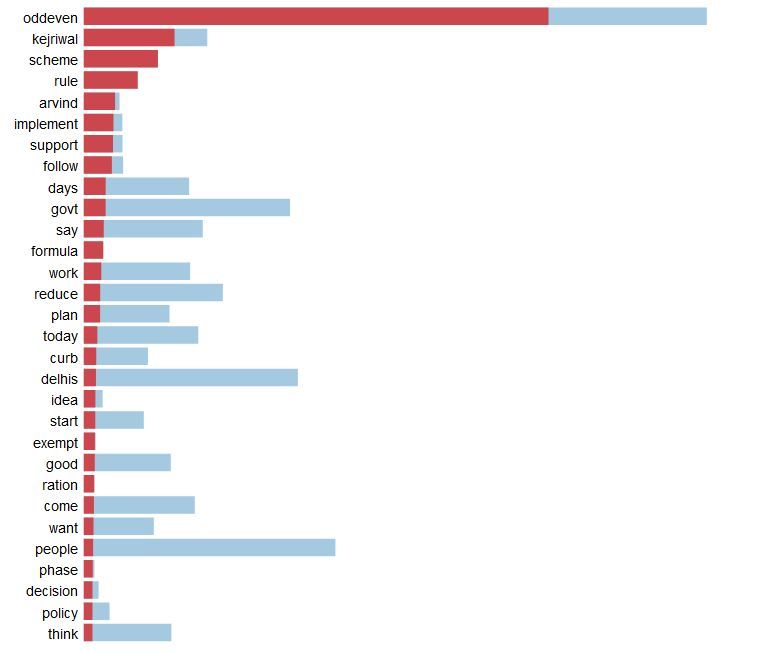
96:18 Rishiraj Adhikary et al.

 Number of Tweets
 Number of Tweets
 600 PM2.5 levels
 40000

 PM2.5 Level
 400
 20000
 200

 0 0

 6-05 6- 11 7- 05 7-11 8- 05 8- 11 9-0
 5
 9-11
 201 201 201 201 201 201 201 201
 Year and Month

Fig. 11. The frequency of tweet and PM2.5 value for the year 2016 to 2019. There were specific episodes when
both PM2.5 and frequency of tweet rise rapidly.

goes for a toss when nothing can be done to control emissions. While air pollution is a year-long
problem (Figure 9) in Delhi but discussions are sparse and episodic. The next Section will reveal
one of the primary reason for high pollution during winter months.

World Environment Day: We observe in Figure 10 that ‘Granger-causality’ approaches the
significance level between May and July. On analysis, we found that the volume of tweets on air
pollution increases abruptly on June 5th 2016, i.e. World Environment Day. Besides this event, we
observe the topic ‘Plant Tree’ in Figure 12, which evolved in the first week of June 2016.

5.3 Evaluating The Topic Model
We use LDA to observe the topics about air quality discussion. We feed the entire tweet corpus
(1.2M) to the LDA model. We explained about LDA in Section 4.3. We pre-processed our tweet cor-
pus by removing punctuation, hyperlinks and other non-ASCII characters. A frequently occurring
word might appear in all the topic, whereas words that appear in a few tweets might add up as
noise to an otherwise good topic. Thus, as a common practice we removed words that appeared
more than 80% of the time, and less than 15% of the time (Threshold Noise Filtering [16]). Post text
cleaning, we converted the pre-processed tweet corpus into a Bag-of-words (BoW) representation
where each tweet is the one-hot encoding of the whole corpus.

We feed the Bag of Word (BoW) representation in the LDA model. The most critical parameter of
LDA is the number of topics ( ). A small value of could potentially merge distinct topics into one.
A large value of could result in several topics that are individually confusing. To find the optimal
value of , we calculated the topic coherence [52] using different topic models by varying [5].
The optimal value of is where the topic coherence score is the highest.

The result of finding the optimal topic model is in Figure 15 (in Appendix). We found that the optimal
value of is 25 with 100 iterations of the algorithm. The value of the per-document topic distri-
bution, and per topic word distribution, was as per the default settings in the gensim [50] library.

Visualising Topics in LDA: Topics inferred by LDA are not always easily interpretable by hu-
mans [18]. The visualisation makes it easy to interpret the topics. Therefore, we used a web-based
interactive visualisation tool called LDAvis [59] that visualises the topic estimated by LDA. LDAvis
provides a view of how topics differ from each other while at the same time allowing for deep
inspection of the terms most highly associated with each topic. On the left of Figure 12, the topics
are plotted as circles in the two-dimensional plane whose centres are determined by computing
the distance between topics, and then by using multidimensional scaling to project the inter-topic
distances onto two dimensions. The right panel of the visualisation depicts a horizontal bar-chart

Proc. ACM Hum.-Comput. Interact., Vol. 5, No. CSCW1, Article 96. Publication date: April 2021.
You can also read