VCTC Intercity Ventura County Transportation Commission - moore & associates
←
→
Page content transcription
If your browser does not render page correctly, please read the page content below
FINAL REPORT
                                                     APRIL 2020

             VCTC Intercity
Ventura County Transportation Commission
   Triennial Performance Audit for FY 2017 - FY 2019

                                         moore
                                           & associates
Ventura County Transportation Commission – VCTC Intercity Bus
Triennial Performance Audit, FY 2017 – FY 2019
Final Report

                                                           Table of Contents

Chapter 1: Executive Summary ........................................................ 01

Chapter 2: Audit Scope and Methodology ....................................... 03

Chapter 3: Program Compliance ...................................................... 07

Chapter 4: Prior Recommendations ................................................. 13

Chapter 5: Performance Analysis ..................................................... 15

Chapter 6: Functional Review .......................................................... 23

Chapter 7: Findings and Recommendations ..................................... 31

Moore & Associates, Inc. | 2020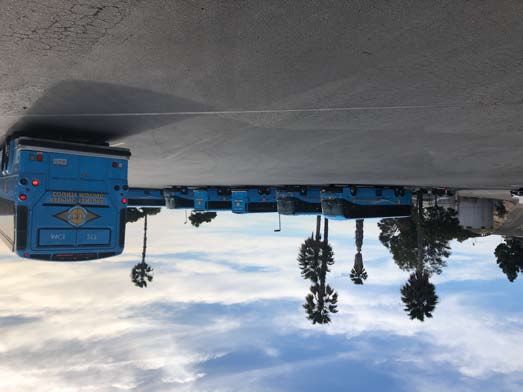
Ventura County Transportation Commission – VCTC Intercity Bus
Triennial Performance Audit, FY 2017 – FY 2019
Final Report

                                    This page intentionally blank.

Moore & Associates, Inc. | 2020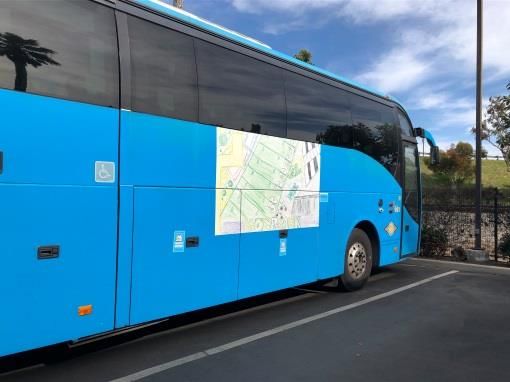
Ventura County Transportation Commission – VCTC Intercity Bus
Triennial Performance Audit, FY 2017 – FY 2019
Final Report
Chapter 1
Executive Summary
In 2019, the Ventura County Transportation Commission (VCTC) selected Moore & Associates, Inc. to
prepare Triennial Performance Audits of itself as the RTPA as well as the nine public transit programs to
which it allocates TDA funding. As one of the six statutorily designated County Transportation
Commissions in the SCAG region, VCTC also functions as the respective county RTPA.
The California Public Utilities Code requires all recipients of Transit Development Act (TDA) Article 4
funding to complete an independent audit on a three-year cycle in order to maintain funding eligibility.
The Triennial Performance Audit is designed to be an independent and objective evaluation of the Ventura
County Transportation Commission (VCTC) as operator of the VCTC Intercity public transit service,
providing operator management with information on the economy, efficiency, and effectiveness of its
programs across the prior three fiscal years. In addition to assuring legislative and governing bodies (as
well as the public) that resources are being economically and efficiently utilized, the Triennial Performance
Audit fulfills the requirement of PUC Section 99246(a) that the RTPA designate an entity other than itself
to conduct a performance audit of the activities of each operator to whom it allocates funds.
This chapter summarizes key findings and recommendations developed during the Triennial
Performance Audit (TPA) of VCTC’s public transit program for the period:
Fiscal Year 2016/17,
Fiscal Year 2017/18, and
Fiscal Year 2018/19.
VCTC Intercity Transit bus service provides six fixed routes linking the cities of Ventura County and
providing connections to neighboring Santa Barbara and Los Angeles counties. VCTC Intercity fixed-
route hours of operation vary by route starting as early as 4:10 a.m. and running as late as 11:15 p.m.,
Monday through Friday. Saturday service is offered between 7:00 a.m. and 8:00 p.m. on five of the six
routes, and Sunday service is limited to three routes: Route 60/62, Highway 126; Route 80/89, Coastal
Express; and Route 99, Channel Islands (Oxnard-CSUCI-Camarillo). VCTC Intercity Transit does not
operate on designated holidays.
This performance audit was conducted in accordance with generally accepted government auditing
standards. Those standards require that the audit team plans and performs the audit to obtain
sufficient, appropriate evidence to provide a reasonable basis for its findings and conclusions based on
the audit objectives. Moore & Associates believes the evidence obtained provides a reasonable basis for
our findings and conclusions.
This audit was also conducted in accordance with the processes established by the California
Department of Transportation (Caltrans), as outlined in the Performance Audit Guidebook for Transit
Operators and Regional Transportation Planning Entities.
Moore & Associates, Inc. | 2020 PAGE 1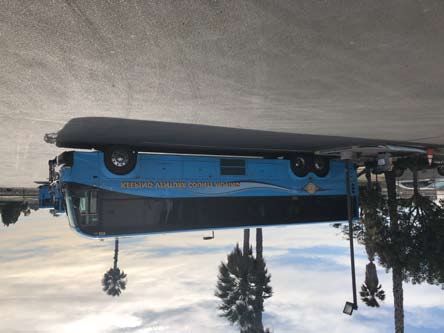
Ventura County Transportation Commission – VCTC Intercity Bus
Triennial Performance Audit, FY 2017 – FY 2019
Final Report
The Triennial Performance Audit includes five elements:
Compliance requirements,
Follow-up of prior report recommendations (where applicable),
Analysis of program data reporting,
Performance Audit, and
Functional review.
Test of Compliance
The Ventura County Transportation Commission met the test of compliance with respect to
Transportation Development Act (TDA) regulations.
Status of Prior Recommendations
The prior audit – completed in 2017 by Moore & Associates, Inc./Ma and Associates for the three fiscal
years ending June 30, 2016 – prescribed one recommendation for VCTC Intercity Bus:
1. Monitor the progress of TDA fiscal audits to ensure they are prepared and submitted within
the designated timeframe.
Status: Implemented.
Findings and Recommendations
Based on discussions with VCTC staff, analysis of program performance, and a review of program
compliance and function, the audit team submits no compliance or functional findings for the Ventura
County Transportation Commission.
Moore & Associates, Inc. | 2020 PAGE 2
Ventura County Transportation Commission – VCTC Intercity Bus
Triennial Performance Audit, FY 2017 – FY 2019
Final Report

                                                                                           Chapter 2
                                            Audit Scope and Methodology
The Triennial Performance Audit (TPA) of the Ventura County Transportation Commission’s Intercity Bus
program covers the three-year period ending June 30, 2019. The California Public Utilities Code requires
all recipients of Transit Development Act (TDA) funding to complete an independent review on a three-
year cycle in order to maintain funding eligibility.

In 2019, the Ventura County Transportation Commission selected Moore & Associates, Inc. to prepare
Triennial Performance Audits of itself as the RTPA, the five transit operators to which it allocates TDA
Article 4 funding, and four additional transit operators that do not receive TDA Article 4 funding. Moore
& Associates is a general consulting firm specializing in public transportation. Selection of the consultant
followed a competitive procurement process.

The Triennial Performance Audit is designed to be an independent and objective evaluation of VCTC as a
public transit operator. Direct benefits of a Triennial Performance Audit include providing operator
management with information on the economy, efficiency, and effectiveness of its programs across the
prior three years; helpful insight for use in future planning; and assuring legislative and governing bodies
(as well as the public) that resources are being economically and efficiently utilized. Finally, the Triennial
Performance Audit fulfills the requirement of PUC Section 99246(a) that the RTPA designate an entity
other than itself to conduct a performance audit of the activities of each operator to whom it allocates
funds.

This performance audit was conducted in accordance with generally accepted government auditing
standards. Those standards require that the audit team plans and performs the audit to obtain
sufficient, appropriate evidence to provide a reasonable basis for its findings and conclusions based on
the audit objectives. We believe the evidence obtained provides a reasonable basis for our findings and
conclusions.

The audit was also conducted in accordance with the processes established by the California
Department of Transportation (Caltrans), as outlined in the Performance Audit Guidebook for Transit
Operators and Regional Transportation Planning Entities, as well as Government Audit Standards
published by the U.S. Comptroller General.

Objectives
A Triennial Performance Audit has four primary objectives:

        1.   Assess compliance with TDA regulations;
        2.   Review improvements subsequently implemented as well as progress toward adopted goals;
        3.   Evaluate the efficiency and effectiveness of the transit operator; and
        4.   Provide sound, constructive recommendations for improving the efficiency and functionality
             of the transit operator.

Moore & Associates, Inc. | 2020                                                              PAGE 3
Ventura County Transportation Commission – VCTC Intercity Bus
Triennial Performance Audit, FY 2017 – FY 2019
Final Report
Scope
The TPA is a systematic review of performance evaluating the efficiency, economy, and effectiveness of
the transit operator. The audit of VCTC included four tasks:
1. A review of compliance with TDA requirements and regulations.
2. An assessment of the implementation of recommendations contained in prior
performance audits.
3. A verification of the methodology for calculating performance indicators including
the following activities:
Assessment of internal controls,
Test of data collection methods,
Calculation of performance indicators, and
Evaluation of performance.
4. Examination of the following functions:
General management and organization;
Service planning;
Scheduling, dispatching, and operations;
Personnel management and training;
Administration;
Marketing and public information; and
Fleet maintenance.
5. Conclusions and recommendations to address opportunities for improvement based
upon analysis of the information collected and the audit of the transit operator’s
major functions.
Methodology
The methodology for the Triennial Performance Audit of VCTC included thorough review of documents
relevant to the scope of the audit, as well as information contained on VCTC’s website. The documents
reviewed included the following (spanning the full three-year period):
Monthly performance reports;
State Controller Reports;
Annual budgets;
TDA fiscal audits;
Transit marketing collateral;
Fleet inventory;
Preventive maintenance schedules and forms;
California Highway Patrol Terminal Inspection reports;
National Transit Database reports;
Accident/road call logs;
Short Range Transit Plan; and
Organizational chart.
Moore & Associates, Inc. | 2020 PAGE 4Ventura County Transportation Commission – VCTC Intercity Bus
Triennial Performance Audit, FY 2017 – FY 2019
Final Report
The methodology for this review included a site visit to VCTC’s offices (950 County Square Drive in
Ventura) on January 29, 2020. The audit team met with Martin Erickson (Transit Director), Aaron
Bonfilio (Program Manager), and Jeni Eddington (Transit Specialist); and reviewed materials germane to
the triennial performance audit. The audit team also visited the RATP Dev operations and maintenance
facility located at 240 South Glenn Drive in Camarillo. The audit team met with contractor
representatives Syed Shadab (General Manager), Virgilio Ziranhua (Operations Manager), June Martinez
(Safety Manager), and Jeff Brown (Maintenance Manager).
This report is comprised of seven chapters divided into three sections:
1. Executive Summary: A summary of the key findings and recommendations developed
during the Triennial Performance Audit process.
2. TPA Scope and Methodology: Methodology of the review and pertinent background
information.
3. TPA Results: In-depth discussion of findings surrounding each of the subsequent
elements of the audit:
Compliance with statutory and regulatory requirements,
Progress in implementing prior recommendations,
Performance measures and trends,
Functional audit, and
Findings and recommendations.
Moore & Associates, Inc. | 2020 PAGE 5Ventura County Transportation Commission – VCTC Intercity Bus
Triennial Performance Audit, FY 2017 – FY 2019
Final Report
This page intentionally blank.
Moore & Associates, Inc. | 2020 PAGE 6Ventura County Transportation Commission – VCTC Intercity Bus
Triennial Performance Audit, FY 2017 – FY 2019
Final Report
Chapter 3
Program Compliance
This section examines the VCTC’s compliance with the Transportation Development Act as well as
relevant sections of the California Code of Regulations. An annual certified fiscal audit confirms TDA
funds were apportioned in conformance with applicable laws, rules, and regulations. The Ventura
County Transportation Commission considers full use of funds under California Code of Regulations
(CCR) 6754(a) as referring to operating funds but not capital funds. The TPA findings and related
comments are delineated in Exhibit 3.1.
Compliance was determined through discussions with VCTC staff as well as a physical inspection of
relevant documents including the fiscal audits for each year of the triennium, TDA claim forms, State
Controller annual filings, California Highway Patrol terminal inspections, year-end performance reports,
and other compliance-related documentation.
The Ventura County Transportation Commission met the test of compliance with respect to
Transportation Development Act (TDA) regulations.
Recent Changes Regarding Compliance
Several changes specific to the TDA and TDA funding went into effect beginning July 1, 2016, and were in
full effect throughout the audit period. The first was a policy approved by VCTC which mandated
funding originally received through the TDA would be classified as TDA funding even after being passed
through to another entity. This disallowed the use of TDA funds passed from one claimant to another
agency to be used as local support in the calculation of the farebox recovery ratio.
The second change was an amendment to the Public Utilities Code specific to the definition of operating
cost and what costs can be excluded. It should be noted that many of the exclusions pertain only to
changes in certain costs, either over the prior year or beyond the change in the Consumer Price Index.
They do not apply to all costs related to specified exclusion categories.
Senate Bill 508, dated October 9, 2015, amended Section 99268.17 to read as follows:
99268.17 (a) Notwithstanding subdivision (a) of Section 99247, the following costs shall
be excluded from the definition of “operating cost” for the purposes of calculating any
required ratios of fare revenues to operating cost specified in this article:
(1) The additional operating costs required to provide comparable complementary
paratransit service as required by Section 37.121 of Title 49 of the Code of
Federal Regulations, pursuant to the federal Americans with Disabilities Act of
1990 (42 U.S.C. Sec. 120101 et seq.), as identified in the operator’s paratransit
plan pursuant to Section 37.139 of Title 49 of the Code of Federal Regulations
that exceed the operator’s costs required to provide comparable paratransit
service in the prior year as adjusted by the Consumer Price Index.
Moore & Associates, Inc. | 2020 PAGE 7Ventura County Transportation Commission – VCTC Intercity Bus
Triennial Performance Audit, FY 2017 – FY 2019
Final Report
(2) Cost increases beyond the change in the Consumer Price Index for all of the
following:
(A) Fuel.
(B) Alternative fuel programs.
(C) Power, including electricity.
(D) Insurance premiums and payments in settlement of claims arising out of the
operator’s liability.
(E) State and federal mandates.
(3) Startup costs for new services for a period of not more than two years.
(b) The exclusion of costs from the definition of operating costs in subdivision (a) applies
solely for the purpose of this article and does not authorize an operator to report an
operating cost other than as defined in subdivision (a) of Section 99247 or a ratio of fare
revenue to operating cost other than as that ratio is described elsewhere in this article,
to any of the following entities:
(1) The Controller pursuant to Section 99243.
(2) The entity conducting the fiscal audit pursuant to Section 99245.
(3) The entity conducting the performance audit pursuant to Section 99246.
Reporting forms for the State Controller for FY 2016/17 were not updated to reflect these exclusions.
Reporting forms were updated and in place for FY 2017/18 and FY 2018/19. However, it is important for
agencies to ensure any exclusions from operating cost are clearly itemized within TDA audits or other
farebox revenue ratio calculations so that compliance can be clearly assessed.
The third change, also contained within Senate Bill 508, related to the type of funds that can be used to
supplement farebox revenue. Prior to this bill, “local funds” was defined as “revenues derived from
taxed imposed by the operator or by a county transportation commission.” S.B. 508 amended Section
99268.19 to read:
99268.19 If fare revenues are insufficient to meet the applicable ratio of fare revenues to
operating cost required by this article, an operator may satisfy that requirement by
supplementing its fare revenues with local funds. As used in this section, “local funds”
means any nonfederal or nonstate grant funds or other revenues generated by, earned
by, or distributed to an operator.
This expanded definition opened up new revenue sources that can be used to offset farebox shortfalls.
Applicable revenues include funds received through advertising, interest income, sale of surplus
vehicles, and other such sources. While these funds are no longer limited to those generated by local
taxes, they cannot be state or federal funds.
Moore & Associates, Inc. | 2020 PAGE 8Ventura County Transportation Commission – VCTC Intercity Bus
Triennial Performance Audit, FY 2017 – FY 2019
Final Report
The Future of the Transportation Development Act1
In the nearly 50 years since the introduction of the Transportation Development Act, there have been
many changes to public transportation in California. Many operators face significant challenges in
meeting the farebox recovery ratio requirement, and it calls into question whether that remains the
best measure for TDA compliance. In 2018, the chairs of California’s state legislative transportation
committees requested the California Transit Association spearhead a policy task force to examine the
TDA.
Numerous meetings were conducted with the TDA task force across a full year. Other efforts included
input from state-level stakeholders as well as transit agencies. It also reviewed the results of two
research projects requested by legislative leaders and conducted by the UCLA Institute of Transportation
Studies. Two particularly important conclusions were:
The state’s goals for transit have changed and broadened considerably since 1971 when the TDA
became law and 1978 when the farebox recovery requirement was added; and
A survey of California transit and regional agency professionals reveals the current TDA
requirements appear to influence agency management decisions in ways that do not align with
the state’s current goals for transit.
The task force then set forth a draft framework for TDA reform that maintained the farebox recovery
requirement but significantly changed how it would be applied. The draft framework:
1. Retains TDA’s current farebox recovery requirements as an important data set for policymakers
at all levels. The ratios would be targets that all transit agencies should try to hit.
2. Removes financial penalties associated with missing farebox recovery requirements for all
agencies.
3. Requires agencies that miss their required farebox recovery for three years in a row be given the
option in year four to either 1) develop and submit an action plan to the RTPA that details the
steps it will take to meet its farebox recovery requirement; or 2) develop new targets, in
collaboration with the RTPA, that monitor the transit agency’s contribution to local, community,
regional, or statewide goals.
4. Adjusts some aspects of the farebox recovery ratio definitions for the numerator and
denominator, and lower the basic targets, to better reflect current goals and objectives for
public transit, and to more realistically accommodate today’s most pressing transit challenges
and unfunded mandates.
While these proposed changes to the TDA legislation have yet to be finalized and enacted, it is very likely
the TDA will undergo significant revisions during the next audit period. As a result, the test of
compliance may look quite different in subsequent triennial performance audits.
1
Letter from Rick Ramacier, State Legislative Committee Chair, California Transit Association, and Joshua W. Shaw, Executive
Director, California Transit Association to California Transit Association members, RTPAs, and other public transit systems.
Subject: Transportation Development Act Reform – A Draft Framework (inclusive of Attachment 1, Draft Framework). Dated
January 8, 2020.
Moore & Associates, Inc. | 2020 PAGE 9Ventura County Transportation Commission – VCTC Intercity Bus
Triennial Performance Audit, FY 2017 – FY 2019
Final Report
Exhibit 3.1 Transit Development Act Compliance Requirements
Compliance Element Reference Compliance Comments
FY 2016/17: December 18, 2017
State Controller Reports submitted on time. PUC 99243 In compliance FY 2017/18: November 18, 2018
FY 2018/19: January 28, 2020
Fiscal and compliance audits submitted within FY 2016/17: December 14, 2017
180 days following the end of the fiscal year (or PUC 99245 In compliance FY 2017/18: November 15, 2018
with up to 90-day extension). FY 2018/19: November 25, 2019
August 20, 2015
Operator’s terminal rated as satisfactory by September 16, 2016
CHP within the 13 months prior to each TDA PUC 99251 B In compliance March 30, 2017
claim. March 14, 2018
March 27, 2019
Operator’s claim for TDA funds submitted in
compliance with rules and regulations adopted PUC 99261 In compliance
by the RTPA.
If operator serves urbanized and non-
urbanized areas, it has maintained a ratio of
fare revenues to operating costs at least equal PUC 99270.1 Not applicable
to the ratio determined by the rules and
regulations adopted by the RTPA.
An operator receiving allocations under Article
8(c) may be subject to regional, countywide, or
VCTC-Intercity does not receive
subarea performance criteria, local match PUC 99405 Not applicable
Article 8(c) funding.
requirements, or fare recovery ratios adopted
by resolution of the RTPA.
The operator’s operating budget has not
increased by more than 15% over the FY 2016/17: + 0.37%
preceding year, nor is there a substantial FY 2017/18: -9.40%
increase or decrease in the scope of operations FY 2018/19: +11.89%
PUC 99266 In compliance
or capital budget provisions for major new
fixed facilities unless the operator has Source: VCTC Annual Budgets, FY
reasonably supported and substantiated the 2017 – FY 2019.
change(s).
The operator’s definitions of performance
measures are consistent with the Public PUC 99247 In compliance
Utilities Code Section 99247.
FY 2016/17: 34.12%
If the operator serves an urbanized area, it has FY 2017/18: 31.53%
maintained a ratio of fare revenues to PUC 99268.2, FY 2018/19: 31.65%
In compliance
operating cost at least equal to one-fifth (20 99268.4, 99268.1
percent). Source: TDA Fiscal Audits, FY
2017 – FY 2019.
If the operator serves a rural area, it has
maintained a ratio of fare revenues to PUC 99268.2,
Not applicable
operating cost at least equal to one-tenth (10 99268.4, 99268.5
percent).
For a claimant that provides only services to
elderly and handicapped persons, the ratio of PUC 99268.5, CCR
Not applicable
fare revenues to operating cost shall be at least 6633.5
10 percent.
Moore & Associates, Inc. | 2020 PAGE 10Ventura County Transportation Commission – VCTC Intercity Bus
Triennial Performance Audit, FY 2017 – FY 2019
Final Report
Compliance Element Reference Compliance Comments
The current cost of the operator’s retirement
system is fully funded with respect to the
VCTC staff are eligible for
officers and employees of its public
CalPERS. Operations staff are
transportation system, or the operator is PUC 99271 In compliance.
employed by a third-party
implementing a plan approved by the RTPA,
contractor.
which will fully fund the retirement system for
40 years.
If the operator receives State Transit
Assistance funds, the operator makes full use
of funds available to it under the Urban Mass CCR 6754 (a) (3) In compliance
Transportation Act of 1964 before TDA claims
are granted.
In order to use State Transit Assistance funds
for operating assistance, the operator’s total
operating cost per revenue hour does not
exceed the sum of the preceding year’s total
plus an amount equal to the product of the
percentage change in the CPI for the same
period multiplied by the preceding year’s total
PUC 99314.6 In compliance
operating cost per revenue hour. An operator
may qualify based on the preceding year’s
operating cost per revenue hour or the average
of the three prior years. If an operator does
not meet these qualifying tests, the operator
may only use STA funds for operating purposes
on a sliding scale.
A transit claimant is precluded from receiving
monies from the Local Transportation Fund
and the State Transit Assistance Fund in an
amount which exceeds the claimant's capital
and operating costs less the actual amount of
fares received, the amount of local support CCR 6634 In compliance
required to meet the fare ratio, the amount of
federal operating assistance, and the amount
received during the year from a city or county
to which the operator has provided services
beyond its boundaries.
Moore & Associates, Inc. | 2020 PAGE 11Ventura County Transportation Commission – VCTC Intercity Bus
Triennial Performance Audit, FY 2017 – FY 2019
Final Report
This page intentionally blank.
Moore & Associates, Inc. | 2020 PAGE 12Ventura County Transportation Commission – VCTC Intercity Bus
Triennial Performance Audit, FY 2017 – FY 2019
Final Report
Chapter 4
Prior Recommendations
This section reviews and evaluates the implementation of prior Triennial Performance Audit
recommendations. This objective assessment provides assurance the Ventura County Transportation
Commission has made quantifiable progress toward improving both the efficiency and effectiveness of
its public transit program.
The prior audit – completed in 2017 by Moore & Associates, Inc./Ma and Associates for the three fiscal
years ending June 30, 2016 – prescribed one recommendation for VCTC Intercity Bus:
1. Monitor the progress of TDA fiscal audits to ensure they are prepared and submitted within
the designated timeframe.
Discussion: PUC Section 99245 requires the RTPA ensure all claimants to which it allocated
TDA funds submit to it and to the State Controller an annual certified fiscal and compliance
audit within 180 days after the end of the fiscal year (or 270 days if a 90-day extension is
granted). The VCTC Intercity TDA fiscal audit for FY 2014/15 was submitted well past the
allowable 90-day extension. However, since the FY 2015/16 audit was submitted on time,
this does not appear to be an ongoing problem.
Progress: During the current audit period, all TDA fiscal audits were submitted within the
designated timeframe.
Status: Implemented.
Moore & Associates, Inc. | 2020 PAGE 13Ventura County Transportation Commission – VCTC Intercity Bus
Triennial Performance Audit, FY 2017 – FY 2019
Final Report
This page intentionally blank.
Moore & Associates, Inc. | 2020 PAGE 14Ventura County Transportation Commission – VCTC Intercity Bus
Triennial Performance Audit, FY 2017 – FY 2019
Final Report
Chapter 5
Performance Analysis
Performance indicators are typically employed to quantify and assess the efficiency of a transit
operator’s activities. Such indicators provide insight into current operations as well as trend analysis of
operator performance. Through a review of indicators, relative performance as well as possible inter-
relationships between major functions is revealed.
The Transportation Development Act (TDA) requires recipients of TDA funding to track and report five
performance indicators:
Operating Cost/Passenger,
Operating Cost/Vehicle Service Hour,
Passengers/Vehicle Service Hour,
Passengers/Vehicle Service Mile, and
Vehicle Service Hours/Employee.
To assess the validity and use of performance indicators, the audit team performed the following
activities:
Assessed internal controls in place for the collection of performance-related
information,
Validated collection methods of key data,
Calculated performance indicators, and
Evaluated performance indicators.
The procedures used to calculate TDA-required performance measures for the current triennium were
verified and compared with indicators included in similar reports to external entities (i.e., State
Controller and Federal Transit Administration).
Operating Cost
The Transportation Development Act requires an operator to track and report transit-related costs
reflective of the Uniform System of Accounts and Records developed by the State Controller and the
California Department of Transportation. The most common method for ensuring this occurs is through
a compliance audit report prepared by an independent auditor in accordance with California Code of
Regulations Section 66672. The annual independent financial audit should confirm the use of the
Uniform System of Accounts and Records. Operating cost – as defined by PUC Section 99247(a) –
excludes the following:
2
CCR Section 6667 outlines the minimum tasks which must be performed by an independent auditor in conducting the annual
fiscal and compliance audit of the transit operator.
Moore & Associates, Inc. | 2020 PAGE 15Ventura County Transportation Commission – VCTC Intercity Bus
Triennial Performance Audit, FY 2017 – FY 2019
Final Report
Cost in the depreciation and amortization expense object class adopted by the State
Controller pursuant to PUC Section 99243,
Subsidies for commuter rail services operated under the jurisdiction of the
Interstate Commerce Commission,
Direct costs of providing charter service, and
Vehicle lease costs.
Vehicle Service Hours and Miles
Vehicle Service Hours (VSH) and Miles (VSM) are defined as the time/distance during which a revenue
vehicle is available to carry fare-paying passengers, and which includes only those times/miles between
the time or scheduled time of the first passenger pickup and the time or scheduled time of the last
passenger drop-off during a period of the vehicle's continuous availability.3 For example, demand-
response service hours include those hours when a vehicle has dropped off a passenger and is traveling
to pick up another passenger, but not those hours when the vehicle is unavailable for service due to
driver breaks or lunch. For both demand-response and fixed-route services, service hours will exclude
hours of "deadhead" travel to the first scheduled pick-up, and will also exclude hours of "deadhead"
travel from the last scheduled drop-off back to the terminal. For fixed-route service, a vehicle is in
service from first scheduled stop to last scheduled stop, whether or not passengers board or exit at
those points (i.e., subtracting driver lunch and breaks but including scheduled layovers).
Passenger Counts
According to the Transportation Development Act, total passengers is equal to the total number of
unlinked trips (i.e., those trips that are made by a passenger that involve a single boarding and
departure), whether revenue-producing or not.
Employees
Employee hours is defined as the total number of hours (regular or overtime) which all employees have
worked, and for which they have been paid a wage or salary. The hours must include transportation
system-related hours worked by persons employed in connection with the system (whether or not the
person is employed directly by the operator). Full-Time Equivalent (FTE) is calculated by dividing the
number of person-hours by 2,000.
Fare Revenue
Fare revenue is defined by California Code of Regulations Section 6611.2 as revenue collected from the
farebox plus sales of fare media.
TDA Required Indicators
To calculate the TDA indicators for VCTC, the following sources were employed:
Operating Cost was not independently calculated as part of this audit. Operating Cost data
were obtained via NTD reports for each fiscal year covered by this audit. Operating Cost
from the reports was compared against that reported to the State Controller as well as in
3
A vehicle is considered to be in revenue service despite a no-show or late cancellation if the vehicle remains available for
passenger use.
Moore & Associates, Inc. | 2020 PAGE 16Ventura County Transportation Commission – VCTC Intercity Bus
Triennial Performance Audit, FY 2017 – FY 2019
Final Report
VCTC’s audited financial reports and was determined to be consistent with TDA guidelines
and accurately reflects the costs for VCTC’s transit services. In accordance with PUC Section
99247(a), the reported costs excluded depreciation and other allowable expenses.
Fare Revenue was not independently calculated as part of this audit. Fare Revenue data
were obtained via NTD reports submitted to the FTA for each fiscal year covered by this
audit. Fare revenue from the reports is consistent with TDA guidelines.
Vehicle Service Hours (VSH) data were obtained via NTD reports submitted to the FTA for
each fiscal year covered by this audit. Data from these reports were then compared with
information included within the City’s monthly performance data summary reports. VCTC
calculates VSH using schedule hours reconciled with driver trip sheets. VCTC’s calculation
methodology is consistent with PUC guidelines.
Vehicle Service Miles (VSM) data were obtained via NTD reports submitted to the FTA for
each fiscal year covered by this audit. Data from these reports were then compared with
information included within VCTC’s monthly performance data summary reports. The City
calculates VSM by subtracting deadhead and out-of-service miles subtracted from total
vehicle mileage (as noted on each vehicle’s odometer). This methodology is consistent with
PUC guidelines.
Unlinked trip data were obtained from Transit Operators Financial Transaction Reports
submitted to the State Controller for each fiscal year covered by this review. Data from
these reports was then compared with information included within VCTC’s monthly
performance data summary reports. VCTC’s calculation methodology is consistent with PUC
guidelines.
Full-Time Equivalent (FTE) methodology was provided by VCTC and is consistent with the
TDA definition.
System Performance Trends
System operating cost saw a 96.4 percent increase across the past six years. During the audit period,
however, operating cost increased 9.3 percent. Fare revenue saw a significant net increase across the
past six years (89.7 percent) but declined a net 6.1 percent during the audit period.
Changes to vehicle service hours (VSH) and vehicle service miles (VSM) were much less dramatic than
changes to finance-related metrics. VSH experienced a 17 percent net increase between FY 2013/14 and
FY 2018/19 and a 14 percent net increase during the audit period. VSM saw a net 1.1 percent increase
across the six-year period, but decreased a net 1.7 percent during the audit period. While system
ridership experienced a net 20.5 percent decrease between FY 2013/14 and FY 2018/19, there was a net
9.5 percent decrease during the audit period.
Cost-related performance indicators were mixed during the audit period, with operating cost/VSH
declining while operating cost/passenger and operating cost/VSM increasing. Passenger-related
indicators decreased during the audit period, indicating a decline in productivity. Unsupplemented
farebox recovery ratio decreased by 14.1 percent during the audit period, generally due to increases in
operating cost and decreases in fare revenue, but remained above 20 percent each year.
Moore & Associates, Inc. | 2020 PAGE 17Ventura County Transportation Commission – VCTC Intercity Bus
Triennial Performance Audit, FY 2017 – FY 2019
Final Report
Exhibit 5.1 System Performance Indicators
System-wide
Performance Measure
FY 2013/14 FY 2014/15 FY 2015/16 FY 2016/17 FY 2017/18 FY 2018/19
Operating Cost (Actual $) $5,074,011 $7,763,339 $6,624,552 $9,115,899 $9,158,975 $9,965,179
Annual Change 53.0% -14.7% 37.6% 0.5% 8.8%
Fare Revenue (Actual $) $1,252,361 $1,212,058 $1,733,653 $2,528,741 $2,205,508 $2,375,531
Annual Change -3.2% 43.0% 45.9% -12.8% 7.7%
Vehicle Service Hours (VSH) 56,771 57,267 57,222 58,274 57,789 66,418
Annual Change 0.9% -0.1% 1.8% -0.8% 14.9%
Vehicle Service Miles (VSM) 1,548,346 1,539,247 1,585,460 1,591,629 1,471,359 1,564,942
Annual Change -0.6% 3.0% 0.4% -7.6% 6.4%
Passengers 823,001 782,381 786,754 723,221 640,121 654,595
Annual Change -4.9% 0.6% -8.1% -11.5% 2.3%
Employees 66 68 79 79 79 71
Annual Change 3.0% 16.2% 0.0% 0.0% -10.1%
Performance Indicators
Operating Cost/VSH (Actual $) $89.38 $135.56 $115.77 $156.43 $158.49 $150.04
Annual Change 51.7% -14.6% 35.1% 1.3% -5.3%
Operating Cost/Passenger (Actual $6.17 $9.92 $8.42 $12.60 $14.31 $15.22
Annual Change 60.9% -15.1% 49.7% 13.5% 6.4%
Passengers/VSH 14.50 13.66 13.75 12.41 11.08 9.86
Annual Change -5.8% 0.6% -9.7% -10.7% -11.0%
Passengers/VSM 0.53 0.51 0.50 0.45 0.44 0.42
Annual Change -4.4% -2.4% -8.4% -4.3% -3.9%
Farebox Recovery 24.7% 15.6% 26.2% 27.7% 24.1% 23.8%
Annual Change -36.7% 67.6% 6.0% -13.2% -1.0%
Hours/Employee 860.2 842.2 724.3 737.6 731.5 935.5
Annual Change -2.1% -14.0% 1.8% -0.8% 27.9%
TDA Non-Required Indicators
Operating Cost/VSM $3.28 $5.04 $4.18 $5.73 $6.22 $6.37
Annual Change 53.9% -17.2% 37.1% 8.7% 2.3%
VSM/VSH 27.27 26.88 27.71 27.31 25.46 23.56
Annual Change -1.4% 3.1% -1.4% -6.8% -7.5%
Fare/Passenger $1.52 $1.55 $2.20 $3.50 $3.45 $3.63
Annual Change 1.8% 42.2% 58.7% -1.5% 5.3%
Source: Data for FY 2013/14 – FY 2015/16 from prior Triennial Performance Audit.
Data for FY 2016/17 – FY 2018/19 from State Controller Reports.
Moore & Associates, Inc. | 2020 PAGE 18Ventura County Transportation Commission – VCTC Intercity Bus
Triennial Performance Audit, FY 2017 – FY 2019
Final Report
Exhibit 5.2 System Ridership Exhibit 5.3 System Operating Cost/VSH
900,000 $180.00
$156.43 $158.49
800,000 $160.00 $150.04
823,001 $135.56
700,000 782,381 786,754 $140.00
723,221
600,000 654,595 $120.00
640,121
500,000 $100.00 $115.77
400,000 $80.00 $89.38
300,000 $60.00
200,000 $40.00
100,000 $20.00
0 $0.00
FY 2013/14 FY 2014/15 FY 2015/16 FY 2016/17 FY 2017/18 FY 2018/19 FY 2013/14 FY 2014/15 FY 2015/16 FY 2016/17 FY 2017/18 FY 2018/19
Exhibit 5.4 System Operating Cost/VSM Exhibit 5.5 System VSM/VSH
$7.00 $6.37 29.00
27.71
$6.00 28.00 27.27 27.31
$5.04 $6.22
$5.73 27.00
$5.00
26.88
26.00 25.46
$4.00
$4.18 25.00
$3.00
$3.28 24.00
$2.00 23.56
23.00
$1.00 22.00
$0.00 21.00
FY 2013/14 FY 2014/15 FY 2015/16 FY 2016/17 FY 2017/18 FY 2018/19 FY 2013/14 FY 2014/15 FY 2015/16 FY 2016/17 FY 2017/18 FY 2018/19
Moore & Associates, Inc.| 2020 PAGE 19Ventura County Transportation Commission – VCTC Intercity Bus
Triennial Performance Audit, FY 2017 – FY 2019
Final Report
Exhibit 5.6 System Operating Cost/Passenger Exhibit 5.7 System Passengers/VSH
$16.00 $15.22 16.00
$14.31
$14.00 $12.60 14.00
14.50
13.66 13.75
$12.00 12.00
$9.92 12.41
$10.00 10.00 11.08
9.86
$8.00 8.00
$8.42
$6.00 6.00
$6.17
$4.00 4.00
$2.00 2.00
$0.00 0.00
FY 2013/14 FY 2014/15 FY 2015/16 FY 2016/17 FY 2017/18 FY 2018/19 FY 2013/14 FY 2014/15 FY 2015/16 FY 2016/17 FY 2017/18 FY 2018/19
Exhibit 5.8 System Passengers/VSM Exhibit 5.9 System VSH/FTE
0.60 1000 935.5
900
0.50
0.53 800 860.2
0.51 0.50 842.2
0.45 700
0.40 0.44 724.3 737.6 731.5
0.42 600
0.30 500
400
0.20
300
200
0.10
100
0.00 0
FY 2013/14 FY 2014/15 FY 2015/16 FY 2016/17 FY 2017/18 FY 2018/19 FY 2013/14 FY 2014/15 FY 2015/16 FY 2016/17 FY 2017/18 FY 2018/19
Moore & Associates, Inc.| 2020 PAGE 20Ventura County Transportation Commission – VCTC Intercity Bus
Triennial Performance Audit, FY 2017 – FY 2019
Final Report
Exhibit 5.10 System Farebox Recovery Exhibit 5.11 System Fare/Passenger
30.0% 27.7% $4.00
26.2% $3.50
24.7% 24.1% $3.50
23.8%
25.0% $3.63
$3.45
$3.00
20.0%
$2.50
15.0% $2.00
15.6% $2.20
$1.50
10.0%
$1.52 $1.55
$1.00
5.0%
$0.50
0.0% $0.00
FY 2013/14 FY 2014/15 FY 2015/16 FY 2016/17 FY 2017/18 FY 2018/19 FY 2013/14 FY 2014/15 FY 2015/16 FY 2016/17 FY 2017/18 FY 2018/19
Moore & Associates, Inc.| 2020 PAGE 21Ventura County Transportation Commission – VCTC Intercity Bus
Triennial Performance Audit, FY 2017 – FY 2019
Final Report
This page intentionally blank.
Moore & Associates, Inc. | 2020 PAGE 22Ventura County Transportation Commission – VCTC Intercity Bus
Triennial Performance Audit, FY 2017 – FY 2019
Final Report
Chapter 6
Functional Review
A functional review of the Ventura County Transportation Commission’s public transit program is
intended to assess the effectiveness and efficiency of the operator. Following a general summary of
VCTC’s transit services, this chapter addresses seven functional areas. The list, taken from Section III of
the Performance Audit Guidebook published by Caltrans, reflects those transit services provided by VCTC
through its transit program:
General management and organization;
Service planning;
Scheduling, dispatch, and operations;
Personnel management and training;
Administration;
Marketing and public information; and
Fleet maintenance.
Service Overview
VCTC Intercity Transit bus service provides six
fixed routes linking the cities of Ventura County
and providing connections to neighboring Santa
Barbara and Los Angeles counties. VCTC
Intercity fixed-route hours of operation vary by
route, starting as early as 4:10 a.m. and running
as late as 11:15 p.m., Monday through Friday.
Saturday service is offered between 7:00 a.m.
and 8:00 p.m. on five of the six routes, and
Sunday service is limited to three routes: Route
60/62, Highway 126; Route 80/89, Coastal
Express; and Route 99, Channel Islands (Oxnard-
CSUCI-Camarillo). VCTC Intercity Transit does
not operate on designated holidays.
In October 2016, VCTC launched a new route, the Oxnard-Camarillo connector, linking South Oxnard to
the Camarillo Premium Outlets. In May 2017, the Oxnard-Camarillo connector was combined with the
Oxnard and Camarillo CSUCI routes, some non-productive trips were eliminated, and service to Piru on
the Highway 126 route was eliminated. In December 2017, the Thomas Fire and subsequent mudslide
impacted VCTC Intercity operation, and increased transit’s role in emergency management.
VCTC utilizes a zonal fare structure. Zone 1 includes routes traveling within Ventura County, while Zone
2 includes routes traveling beyond Ventura County. In November 2018, the Board approved a two-
phase fare increase to address the rising costs of operation. This was the first fare adjustment since
2011. The first fare increase was effective January 14, 2019, which increased the base one-way cash
Moore & Associates, Inc. | 2020 PAGE 23Ventura County Transportation Commission – VCTC Intercity Bus
Triennial Performance Audit, FY 2017 – FY 2019
Final Report
fare from $1.25 to $1.50. The second phase of the fare increase went into effect January 20, 2020. The
current fare schedule is provided in Exhibit 6.1.
Exhibit 6.1 VCTC Intercity Bus Fare Structure
Zone 1 Zone 2
Cash Fares
Full fare (one-way) $1.75 $4.00
Reduced fare (senior 65+/Medicare/ADA) $0.80 $2.00
Child under 5 (with fare-paying customer) Free Free
10-Ride Ticket
Full fare $15.00 $36.00
Reduced fare (senior 65+/Medicare/ADA) $7.00 $18.00
VCTC 5-Day Pass (cash only)
Full fare $10.00 N/A
Reduced fare (senior 65+/Medicare/ADA) $5.00 N/A
VCTC 31-Day Pass
Full fare $50.00 $130.00
Reduced fare (senior 65+/Medicare/ADA) $25.00 $65.00
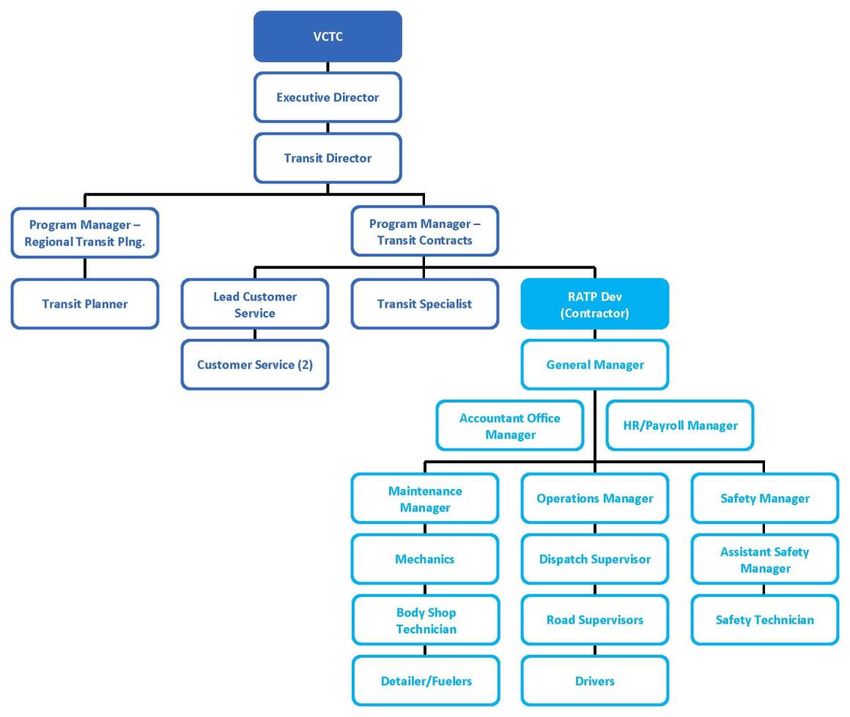
General Management and Organization
VCTC’s Executive Director manages four departments: Finance, Planning and Technology, Programming,
and Transit. The Transit Director oversees a department which includes two Program Managers, a
Transit Planner, a Transit Specialist, a Customer Service Lead, and two additional Customer Service
personnel. The operations contractor reports to the Transit Director as well. VCTC’s organizational
chart specific to VCTC - Intercity Bus is presented in Exhibit 6.2.
Moore & Associates, Inc. | 2020 PAGE 24Ventura County Transportation Commission – VCTC Intercity Bus
Triennial Performance Audit, FY 2017 – FY 2019
Final Report
Exhibit 6.2 VCTC Organizational Chart FY 2019/20
Source: VCTC.
Vehicles are owned by VCTC and operated by RATP Dev (formerly Roadrunner Management Services,
Inc.), which is based in Camarillo. VCTC monitors performance via monthly report packets submitted
with contractor invoices, as well as with in-field monitoring and operations meetings held quarterly (and
monthly as needed). Dispatch updates VCTC if service falls 10 minutes behind. VCTC also works with the
contractor to address customer complaints and issues. Onboard cameras provide the ability for live
looks and spot checks.
In April 2017, the Board voted to approve a settlement and contract termination agreement with
Roadrunner Management Services, the contracted operator of the VCTC Intercity Bus. Roadrunner had
the option of selling its company and requesting assignment of its VCTC Intercity contract to a qualified
buyer. In January 2018, RATP Dev submitted a letter to VCTC outlining its intent to purchase Roadrunner
and expressed its interest in assuming the VCTC Intercity Bus contract. Effective May 2018, Roadrunner
continued operating the VCTC Intercity service as a fully owned subsidiary of RATP Dev. The current
base contract ends in FY 2023/24.
Moore & Associates, Inc. | 2020 PAGE 25Ventura County Transportation Commission – VCTC Intercity Bus Triennial Performance Audit, FY 2017 – FY 2019 Final Report RATP Dev has been responsive, although this has been an evolution. VCTC reported seeing immediate process improvements as well as changes in driver morale. RATP Dev has been bringing its own resources in. Staff noted it expects to be able to focus more on RATP Dev contract management moving forward, since it has now completed the second phase of a two-phase fare increase. Syncromatics was installed in FY 2018/19 and provides a variety of reports, including onboard passenger counts (APC) and GPS (AVL). Nightly probes download data from fareboxes and cameras. The Transit Division is currently fully staffed. However, VCTC recently had two retirements of senior personnel, which has had an impact on the organization overall. The Transit Division includes multiple staff members focused on regional transit—including fareboxes, fare media, Nextbus, and regional trip planning. VCTC oversees or participates in numerous committees, including the Transportation Technical Advisory Committee and Transcom for transit operators. Recently, VCTC has been interested in promoting service accessibility to different population groups. VCTC recently instituted its College Ride program, providing free rides to students enrolled at California Lutheran University, California State University – Channel Islands, Moorpark College, Oxnard College, and Ventura College. It is also monitoring Assembly Bill 1350, which proposes free bus service for youth, and has provided Veterans promotions as well. The VCTC Board has undergone significant changes in personnel since the prior audit. The Board would like to see mobility’s role enhanced, but understands the challenges. The Board is supportive of the recent fare increase. Service Planning A county-wide Short Range Transit Plan (SRTP) was updated in Fall 2015, providing strategies for improved regional coordination and connectivity. VCTC expects to update the SRTP in 2021. During the audit period, there has been sub-regional planning done, but not a lot of regional planning. VCTC would like the SRTP to be more developed, with more financial details. VCTC has conducted several surveys during the audit period. In FY 2017/18, VCTC conducted a fare survey of VCTC Intercity Bus customers to ensure compliance with Title VI prior to implementing a fare increase. This survey was fielded in September 2017, garnering responses from nearly 1,650 riders. In FY 2018/19, VCTC conducted origin/destination, transfer, and customer surveys. The origin/destination survey was conducted on 18 routes across six different Ventura County transit operators. The transfer survey included 12 different transfer locations. The customer satisfaction surveys were conducted on VCTC Intercity Bus and Valley Express services. Specific to VCTC Intercity Bus, 588 origin/destination surveys and 348 customer satisfaction survey responses were collected. Staff noted they would like to do more frequent surveys, possibly every two to three years. During VCTC’s annual unmet needs process, it also conducts an online survey (which has been the most successful method of gathering input) as well as conducts community meetings. In 2020, meetings were conducted in five communities (Thousand Oaks, Camarillo, Santa Paula, Fillmore, and Moorpark). Staff noted rider comments are received fairly regularly. Moore & Associates, Inc. | 2020 PAGE 26
Ventura County Transportation Commission – VCTC Intercity Bus
Triennial Performance Audit, FY 2017 – FY 2019
Final Report

Prior to the 2020 fare increase, VCTC conducted significant community outreach, including social media,
public hearings, the aforementioned fare survey, and outreach in Spanish.

VCTC, in conjunction with Santa Barbara County Association of Governments, has also been in the
process of preparing a Transportation Emergency Plan, which has included outreach to stakeholder
groups and community meetings.

Scheduling, Dispatch, and Operations
Drivers bid for their work assignments three times annually (at the CSUCI break, in June, and at the
beginning of the year), as well as prior to a major schedule change. Awards are based on seniority.
Drivers are rotated among routes only if they choose as part of the bid process.

Part-time drivers are not eligible for vacation or insurance; they do receive sick leave. RATP Dev
currently employs 40 drivers, eight of which are part-time. Full-time drivers are eligible for health
insurance, 401(k) retirement accounts, paid time off, and sick leave. Part-time drivers who work 32 or
more hours per week are considered full-time, even though they may work a part-time bid.

RATP Dev finds it hard to maintain a part-time extra board. As a result, road supervisors and dispatchers
may be assigned to cover call-outs. Vacation time is scheduled in advance and cover drivers are
scheduled for the route. RATP Dev has a clear communicated policy on absences and sick leave that
requires notice prior to the driver’s report time.

Personnel Management and Training
Roadrunner’s Safety and Training Manager left before the company was bought by RATP Dev. RATP Dev
subsequently hired a staffer with broader experience, including police and CHP officer experience. RATP
Dev also employs an Assistant Safety Manager.

RATP Dev is facing challenges in hiring a sufficient number of drivers. ZipRecruiter and “word of mouth”
have been the most successful recruitment tools. RATP Dev also hires through an agency, which has the
down side of having to employ the recruits through the hiring agency for a minimum period. VCTC also
raised driver wages in conjunction with its contract renegotiation in FY 2017/18. Most recruits require
initial training, and all recruits receive full training even if they have a commercial license. VCTC Intercity
Bus is the only operator in Ventura County with an in-house testing program that does not require DMV
testing.

RATP Dev’s training program offers more than the minimum training. It includes 15 hours of
classroom/VTT training, 15 hours of policies and procedures training, 20 hours of behind-the-wheel
training, and 15 hours of pre-trip time. RATP Dev will not use a driver that is not ready or a good “fit”
for the job. When RATP Dev assumed the operations contract, it revised Roadrunner’s policies and
memos to be up to date with current legislation.

RATP Dev prides itself on promoting safety, not just “telling” about it. It does this through a notice board
with safety topics (provided through the corporate office) and quarter safety meetings (which feature 99
percent attendance). In addition, the management team attends safety meetings so as to set an
example. Ongoing safety monitoring takes place with the Samsara app. Through the Samsara platform,
management can monitor a log of on-time performance and review events that are logged on video.

Moore & Associates, Inc. | 2020                                                               PAGE 27
Ventura County Transportation Commission – VCTC Intercity Bus
Triennial Performance Audit, FY 2017 – FY 2019
Final Report

When a driver is going too fast, the app warns the driver to lower their speed. In addition, facial
recognition helps to enforce hours of service maximums.

Drivers are rewarded for good performance with luncheons, gift cards, twice-annual driver appreciation
events, and rewarded for reporting incidents under a “See something, prevent it” campaign. RATP Dev
has reduced turnover by being very truthful up front about what drivers can expect on the job, though
they do lose a driver about once every two months. Turnover typically happens due to higher pay rates
at other agencies.

Performance evaluations are conducted every six months. Drivers are subject to counseling, warnings,
suspension, and termination depending upon the severity of infraction.

Administration
VCTC’s annual budget includes transit funding for both VCTC Intercity Bus and the Valley Express. The
budget is developed and approved via the VCTC Finance subcommittee. Budget development begins
with the receipt of annual FTA revenue projections. VCTC also goes through the Program of Projects and
tracks farebox revenue. VCTC Intercity Bus is currently operating at a good level, so budgeting activities
focus on maintaining the program, rather than planning for significant changes. The VCTC Intercity Bus
budget is constrained by the size of the fleet.

Given it is a program-based budget, it is very transparent. A lot of information is available to the public,
and there are good internal controls. The budget is adopted in June. VCTC monitors expenses and
revenue monthly against budgeted projections. VCTC programs a contingency fund each year.

VCTC’s Programming Department works with Transit on grant applications, management, and
compliance. VCTC has not lost any grants due to neglected or mismanaged opportunities.

The Program Manager is responsible for contract management. During the audit period, this has
included the operations contract, maintenance inspection contract, GFI (maintenance), MCI, UTA (APC
provider), and video system (maintenance). The Transit Specialist addresses related operational issues.
The marketing/outreach contract was previously managed by the Public Information Officer, but has
been managed by the Executive Director since the PIO’s retirement.

VCTC utilizes GFI fareboxes. Only certain contractor staff are able to unlock fareboxes. Vaults are taken
to a secure key-controlled count room at the operations facility, where a two-person team of contractor
personnel handles counting and reconciliation. The final count is handled by the contractor’s Finance
Department. Each month, an adjustment is made if there is any variance between what is reported and
what is received (which usually does not amount to more than seven dollars per day).

Procurement procedures are guided by a manual updated in 2016, per recommendation from an FTA
Triennial Review. Procurement practices conform to all applicable requirements.

Moore & Associates, Inc. | 2020                                                            PAGE 28
Ventura County Transportation Commission – VCTC Intercity Bus
Triennial Performance Audit, FY 2017 – FY 2019
Final Report
Marketing and Public Information
A marketing contractor functions as an extension of VCTC staff, providing the following services across
all VCTC programs, including VCTC Intercity Bus:
Community outreach Fare media
Employer outreach/ETC engagement Social media management
Digital outreach Email blasts
Media relations Website design
Event planning Translations
Education programs Brand management
Student outreach Crisis communications
Senior outreach Service promotions
Ridership generation Event staffing
Real-time service alerts Media buying
Brochures/rider information Printing and collateral
Marketing for Intercity Bus comprises approximately 19 percent
of VCTC’s marketing budget; the overall marketing budget
comprises less than one percent of VCTC’s overall budget.
Recent campaigns included a launch of Shopify to enable online
fare media purchases, promotion of the College Ride program,
and promotion of service and fare changes. VCTC is currently
featuring student artwork on the exterior of its buses, and has
shifted its youth outreach to have more of a college (rather than
teen) focus. Despite this level of effort, VCTC Intercity Bus
ridership declined nearly 10 percent during the audit period.
VCTC Intercity has two dedicated customer service representatives (CSRs), plus one part-time CSR.
During business hours, all calls come through VCTC. After 6:00 p.m., calls roll over to the operations
contractor. Any complaint or fare call gets routed back to VCTC. Customer service data is reported to
VCTC as part of the contractor’s monthly reporting packet.
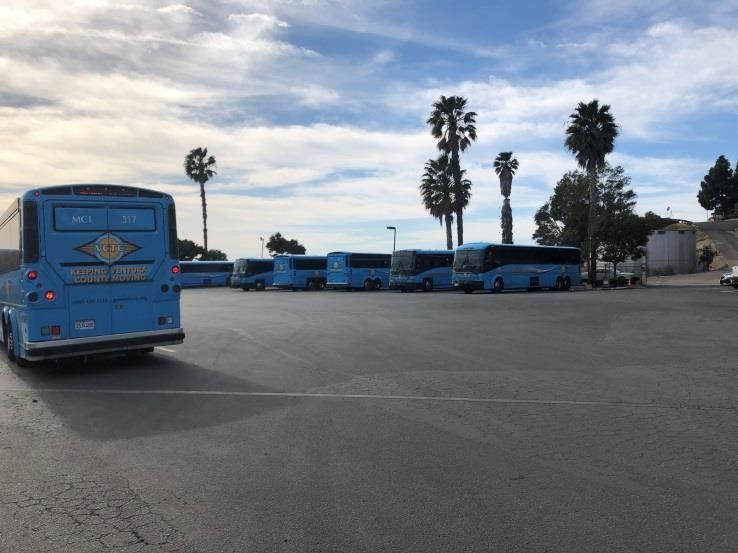
Maintenance
The contractor has a dedicated yard for VCTC
operations, vehicle storage, and maintenance at 240
South Glenn Drive in Camarillo, adjacent to the
Camarillo Metrolink Station. During the audit period,
the facility was expanded by extending the
maintenance bays so that the vehicle will fit fully
within the maintenance bays.
Preventive maintenance is conducted every 5,000
miles, and all preventive maintenance is delivered on
time. FleetMate software helps generate a list of
needed maintenance and repairs. Repairs still
covered by warranty are identified.
Moore & Associates, Inc. | 2020 PAGE 29You can also read