Voice of the Visitor 2020 - Annual Outlook on the Attractions Industry - PGAV Destinations
←
→
Page content transcription
If your browser does not render page correctly, please read the page content below
2020
Voice of the Visitor
 Annual Outlook on the Attractions Industry

TABLE OF CONTENTS
 The Magnetism of Home              5
 Home Basing                        9
 Luggage Not Required              13
 The Great(er) Outdoors            19
 Harder to Please                  21
 The Traveler Tracker              25
 Welcoming Diversity               29
 The Sense in Cents                37
 When Politics & Mission Collide   39
 AKA Generation Z                  43
 Smartly Starting the Decade       49

THE RESEARCH FOR VOICE OF THE VISITOR 2020
           WAS CONDUCTED IN THE FALL OF 2019.
   This year’s report was written during the first week of 2020,
before the COVID-19 pandemic was publicly and widely known
in the western world. Therefore, many of our forecasts about this
 year’s economy and attraction visitation rates simply no longer
 apply. However, 2019’s data provides a critical baseline for
 when the tourism industry reopens and we strive to understand
    “the new normal” of guest behavior and attraction health.
  Additionally, many of the demographic insights and strategic
recommendations will maintain their importance into the future.
The Magnetism
 of Home
 “A relaxing atmosphere where we
  can all be together. Plus FREE”
 - Consumer Survey Response

2020 Voice of the Visitor

We live in sticky times.
There’s certainly the blur of the 24-hour news cycle, and how
headlines complicate our professional and personal strategic
decisions, but the real headline is that those who were once
eager attraction visitors are now becoming more stuck
to their couches.
Only a decade ago, your key competitors were the other
regional zoos, museums, theme parks, and historic sites,
which jockeyed – or at times collaborated - for residents’
and tourists’ weekend time. In 2020’s high-tech world, oft-
predicted by futurists of centuries-past, the comfort and
familiarity of home – and binge-worthy TV series, movies-
on-demand, video games, and voice-assisted entertainment
and education – are alluring prospects that are more and
more keeping people at home with their friends and family,
rather than visiting you.
While we cannot pass judgement on a societal trend of
growing interest in closer-to-home entertainment and
self-enrichment, we cannot deny that it mandates critical,
institutional shifts to entice these once-reliable markets
to visit attractions. Destinations must quickly advance
to offer exciting, new, high-fidelity experiences
that “outsell” the comforts of home, enriched by the
opportunities only you can offer, the stories and knowledge
only you possess, and the comfort and growth only you can
offer in times of unrest.

                                                                5
AQUARIUMS        ART GALLERIES         BOTANICAL          FAMILY         HISTORIC HOMES       ART MUSEUMS
                                          GARDENS       ENTERTAINMENT       & MANSIONS
                                                         CENTERS (FEC)

BREWERY/WINERY                                                                                    NATURAL
    TOURS                                                                                         WONDERS

NATIONAL/STATE                              2020                                                   DINNER

                           Voice of the Visitor
    PARKS                                                                                      THEATERS/CRUISES

                               Annual Outlook on the Attractions Industry
 ZOOS/ANIMAL                                                                                      HISTORICAL
  ATTRACTIONS                                                                                    LANDMARKS

                                                                                                LARGE FORMAT
 WATER PARKS
                                                                                                  THEATERS

 THEME PARKS     SIGHTSEEING TOURS    SCIENCE CENTERS   HISTORY MUSEUMS   CHILDREN’S MUSEUMS      THEATERS
To uncover what attraction managers across the                                    pg 27
country might be able to do in the face of new
challenges and changing demographics, we’re primed
to share our fifth annual Voice of the Visitor: Outlook      INTENT TO VISIT
on the Attractions Industry. We’ve once again
                                                             ATTRACTIONS IN
partnered with our long-standing collaborator H2R
Market Research to survey 1,500 Americans who
visited an attraction in 2019 or are planning to do
so in 2020, with a +/-2.5% margin of error and 95%
                                                             2020
confidence interval. Our report remains the first of
its kind in the industry, and endeavors to provide
attraction leadership with the most comprehensive
analysis of destination guest behavior, mentalities, and
                                                                                          pg 24
                                                                      TOP 10
intentions for the coming year.
We cannot deny that we live in tumultuous, uncertain
times. Some of the greatest opportunities, greatest                       NET
innovations, and greatest discoveries have come in                     PROM
                                                                            OTE
times of upheaval and change though. We are here to                     SCOR R
share these trends, these opportunities, so that                             ES
you and your teams will be prepared to plan for and
act upon the needs, desires, and at times fears straight
from –

THE VOICE OF THE VISITOR.
                                                               THE                        pg 45
Incidence of attraction visitation has remained
relatively flat over the five years of our study, varying   FAST FACTS
between 93.8% and 96.3% of our respondents visiting
                                                                ON
any attraction in a given year, and only a 1.2%-point
increase in 2019. Preliminary forecasts indicate year
over year demand grew by only 0.6% last year, but is
forecasted to rebound healthily by 1.9% this year.
                                                            GEN Z

                                                                                                  7
Home
      Basing

2020 Voice of the Visitor
ACTIVITY TRACKER                                                  We all love the comforts of home. It gives us a strong sense
          Activites done more or less today than 5 years ago.                    of control, whether it’s the fact that we can wear whatever
                                                                                 we want (including that onesie from Christmas 2013), we
                                                                                 know where everything is, we can set the temperature,
                                                                                 lights, and even the alarm clock for our Sunday nap.
          Streaming           +27.1%                                             Looking at several of our findings this year, we’re learning
     Movies at Home                                                              that we’re not alone.
                                                                                 The theory of Home Basing is a trend we’re seeing where
                                  - 4.4%            Going Out to                 people are opting to spend more time at home, rather
                                                    Movies                       than venturing too far outside of their communities. We
                                                                                 asked our respondents to rate a number of activities
                                                                                 by whether they were doing more or less of them
            Shorter
                               +20%                                              than they were five years ago. Looking at net change,
       Getaway Trips
                                                                                 respondents had largely switched to streaming movies at
                                                                                 home (+27.1%) vs. going out to movies (-4.4%), despite
                                                    Long-Haul
                                                                                 the onslaught of superhero sequels, reboots, and finales..
                                   +1.7%
                                                    Destinations                 There was a large rise in Shorter Getaway Trips (+20%
                                                                                 net), while Long-Haul Trips only rose by 1.7% net. These
                                                                                 respondents also reported a net 3.5% rise in watching
        Hanging Out                                                              sports on their smartphones, paired with a net 10.2%
                               +2.9%
         with Friends                                                            decrease in attending the games in person. This finding
                                                                                 mirrors the live vs. streaming sports statistics from our
                                                                                 2018 Destinology, The Fight for Attendance.
                                   - 4.7%           Hanging Out with
                                                    Friends Online

Monitoring/Watching
                              +3.5%
Sports on Smartphone

                                  - 10.2%           Attending Sports
                                                    Games/Tournaments

    Engaging in New
            Activites        +12.2%

                                                    Participating in Activites
                                 +10.3%
                                                    I’ve Always Enjoyed                                                                         9
Passive Digital Connection                DOING MORE
                                          DOING LESS

                            31%
                                   30%
                                                 26%
    21%
                  20%

                                                 -16%
                                   -19%
                            -22%
                  -26%
    -27%

2020 Voice of the Visitor
The trend of Digital These at-home digital activities are also becoming more passive,
rather than active. In this year’s data, we saw a net 6% decrease in
Social Connectedness is playing video games and chatting online, but a net 9% increase in
scrolling through Instagram, net 11% increase in viewing social
continuing to transform media in general, and a net 10% increase in watching short videos
as we are seeing less online.
active interaction through In Home-based Digital Leisure: Doing the Same Leisure Activities, but
Digital, a study out of Universidad EAFIT, researchers Jori Lopez-
video games and online Sintas and Laura Rojas-DeFrancisco cite numerous instances where
hangouts, and more at-home, digital choices have replaced previous “real-world”
experiences. Where one might have once gone to the library to do
passive interaction through research, the same information is now accessible through home
curated social content. internet. To learn a skill, one might have attended a night class,
but can now learn the same skills through YouTube. Dining out
has now been replaced by Door Dash; brick-and-mortar shopping
by Amazon; pinball arcades by Playstation. Even the thought of
programmed television or radio would have friends and family
gather around the home device at a particular time; but now with
on-demand streaming, people’s days can fill up with binge-watching
rather than running that errand they needed to. They’ll just have
the “thing” delivered!
For attraction managers, this may mean a refocusing on marketing
to nearby residents. Beyond simply the marketing messages and
methodology, a concentration on creating new attractions and
exhibits that would give residents a strong reason to come back – or
attend for the first time – is perhaps critical. These additions and
messages need to be high-fidelity and incredibly effective to cut
through the noise; as we detailed in Destinology, the competitive
field for leisure indulgers is wider and deeper than ever before. If
you want PGAV to report the trend of “Attraction Basing” rather
than “Home Basing,” it’s time to strengthen your reasons for
residents to visit.
11Luggage
NOT
Required
2020 Voice of the Visitorattractions visited
Home Basing doesn’t mean becoming a recluse and
holding court about Disney+ with a dozen housecats
day after day. Some people are simply tightening
while traveling their comfortable leisure range, using their homes
as the launchpad. We found that attraction visitors
are more likely to participate in activities they’ve
always enjoyed (+16%), honing their hobbies and
finding comfort in the familiar, and more interested
55%
in returning to the attractions they know and love
(+14%) than they were five years ago. 35% of our
respondents noted that they were taking more,
shorter getaways, while 15% noted they were taking
fewer of these trips. While 28% of people noted they
51% were taking more long-haul trips than they were five
years ago, 21% reported taking fewer big trips. 80%
of our respondents took a leisure trip over 50 miles
from home, down two points from 2018, but 51%
visited an attraction while doing so, a four-point
increase from 2018.
47% 47%
The most popular attractions during these
long-haul trips were...
46%
93% 77% 74%
SIGHTSEEING NATIONAL/STATE HISTORICAL
TOURS PARKS LANDMARKS
which seems to suggest these trips may be about
seeing the nation and rediscovering its history, rather
than heading to a specific destination.
13
2015 2016 2017 2018 2019“Has always been our getaway for fun... something we both enjoy together” - Consumer Survey Response
When it comes to specific attractions, first-time visitation
2019 FIRST TIME VISITORS fell by 5 points under 2018 as guests returned to their old
familiars. Intent to repeat that 2019 visit in 2020 only edged
up by 0.6 points from last year to 63.2%, which is still
BY aTTRACTION VISITED MOST RECENTLY under the five-year average of 66% for intent to revisit.
Intent to travel for leisure in general is up one percentage
point over 2018 at 82%, but this is also less than the five-year
84% historical average.
73%
As leisure options continue to expand and become more
68% nuanced and customized for travelers, competition rises for
67% their share of wallet and time. Attractions must strive to
creatively innovate and offer new, compelling reasons to bring
61% their guests back – or to pull guests from more than 50 miles
away. If this interest in Home Basing continues, attractions
should take this time to refocus some of their core messaging
55% on residents supporting their communities and local
destinations, and remind (or educate) them on the exciting
48% new features at their old stand-bys.
42% 42%
39%
38% 38%
29%
20% 20%
FAMILY ENTERTAINMENT
NATIONAL/STATE PARKS
12%
HISTORY MUSEUMS
THEATERS/CRUISES
BREWERY/WINERY
LARGE FORMAT
ZOOS/ANIMAL
ART MUSEUMS
WATER PARKS
ATTRACTIONS
THEME PARKS
SIGHTSEEING
LANDMARKS
AQUARIUMS
BOTANICAL
GARDENS
THEATERS
THEATERS
HISTORIC
CENTERS
DINNER
TOURS
TOURS
15INTENT TO VISIT SELECT US DESTINATIONS
Attractions visitors traveled to fewer mainstream destinations in 2019, and they % PLAN TO VISIT IN THREE YEARS
expect to visit in fewer numbers in 2020 as well.
% VISITED IN THE PAST 12 MONTHS
31%
29% 29%
17%
17% 18% 23%
22%
13%
12%
NEW FLORIDA TAMPA/
YORK CITY ORLANDO LAS VEGAS GULF COAST CLEARWATERAlthough we commonly report that New York, entomologist conference could explain these
Orlando, and Las Vegas are the top domestic phenomena, our researchers surmise that it’s
regions that our travelers seek – and they still simply a continuation of the trend that travelers
are - the rates at which they visit these cities have “been there, done that,” and are setting their
declined in 2019, and the intent to visit these top sights on new horizons.
places is projected to decrease this year as well.
While volcanic eruptions or an unknown Vegas
20% 20%
19% 19%
11% 8% 17%
12% 9%
9%
SAN HAWAII FLORIDA
FRANSISCO ISLANDS SAN DIEGO KEYS SEATTLE 17For the past several years, we’ve explored the
phenomenon of Permanxiety: the constantly-
stressed state-of-mind that many of us
experience through a more digitally-connected,
24-hour social, professional, and media-cycle.
The stress had become so immense that France
– known for its 35-hour work week – enacted
legislation in 2017 that gave employees the
“right to disconnect” from work communications
after the workday had ended, without threat of
The Great(er)
employer reprisal.
Last year we found that 16% net of our
respondents were spending more time
outdoors than they were five years ago; and
Outdoors
coupled with Permanxiety, we called this trend
“Logging Out” – escaping the digital world
to find peace and relaxation in nature. While a
third of our respondents in both 2018 and 2019
said they were spending more time outdoors,
those who were “doing less” dropped by five
percentage points, raising the net 2019 outdoor
enthusiasts notably to 21%.
2020 Voice of the VisitorMillennials and Generation X had the largest gains in We have seen numerous studies about the benefits
spending time outdoors, while Asians were the only of maximizing our time outdoors, including memory
cultural segment to decline – six percentage points. improvement, stress reduction, energy increases, mental
and psychological health, and the desire to protect these
Despite the interest and intent to spend more time natural spaces that comes from spending time in them.
outdoors, other numbers are showing a dissonance Communities, conservation groups, schools, parks, and
between desire and dedication. APM Research Lab attractions are excellent candidates to work together to
discovered in 2019 that two thirds of American adults craft outdoor activities that can interest the diversity of
spend time in nature only once or twice a month, America, including age, culture, country of origin, gender,
with one in six Americans reporting that they never sexual orientation, and more.
spend free time in nature. “Too much work to do” was
cited as the highest barrier (31%) between respondents Destinations are ideal settings for getting people
and the great outdoors. outdoors and in-touch with nature, and all it takes is
a little creativity, collaboration, and design. According to
Due to volcanic activity in Hawaii, wildfires raging across the numbers, we could all use a bit of fresh air right about
Central and Western America, and a lack of exciting solar now…
eclipses over America, the National Park Service reported
a 13 million visitor decline to parks in 2018, down
from 330.8 million in 2017. Park attendance healthily
rebounded in 2019 to near-2017 numbers, with 327.5 Trailing
million visits to National Parks. Millennials
+25%
SPENDING
Leading
Millennials
TIME +28%
Gen X
Boomers
OUTDOORS
2019 NET CHANGE
+20%
Matures
+22%
- 6% 19Harder
to Please
2020 Voice of the VisitorWhen consumers do feel confident enough to spend their disposable
income and head out into the world, the three emotional drivers that
send them to attractions have remained stable over the years.
TOP 3
EMOTIONAL DRIVERS
When we explored the open-ended responses to
what was most memorable for your family at this
attraction experience, we found a common thread
previously unreported. One of the top three answers
A place where we can
revolved around seeing children’s reactions to the all have fun together
experiences. Nostalgia is a strong motivator in all of
us – many long for the sights, smells, and sounds that 22%
remind them of their youth, and the freedom and carefree
nature which defines childhood. As adults, whether we’re
Boomers or hipster Millennials, it’s often a badge of honor
to have “seen it all,” and at times express being jaded at
wonder. But seeing youth moved by something, inspired
by something they’re witnessing for the first time – or
the hundredth (if we hear Let It Go one more time…) - is A unique
a powerful emotion that’s hard to deny. That inspiration
experience that is out
in youth is the reason many of us entered the attractions
of the ordinary
industry in the first place…
Despite these warm emotions, attraction guests are
simply getting harder to please. Overall satisfaction
20%
dropped by 3% in 2019 to a historic low of 4.27 out of
five. People of color and Trailing Millennials (roughly ages
22 – 28) felt the biggest drops in satisfaction, by 0.25 and
0.39 points, respectively from their five-year historic
averages. Overall Net Promoter Score (NPS) fell by five
points across the attractions industry last year, with
just over half (57%) of visitors willing to recommend
their recent attraction visit to friends and family. NPS Entertaining for both
varies wildly across attraction types though, with Dinner adults and children.
Theaters (74%), Botanical Gardens (68%), National/
State Parks (68%), and Art Museums (65%) having the
highest rate of Promoters, and FECs (38%) and Brewery/ 19%
Wine Tours (44%) the lowest.
21TOP 10 2019 net promoter score Promoters Neutrals Detractors Net
Promoter
Score
74% 19% 7%
DINNER
THEATERS 67%
BOTANICAL 68% 24% 8%
GARDENS 61%
NATIONAL/ 68% 23% 9%
STATE PARKS 59%
ART 65% 28% 7%
MUSEUMS 58%
60% 29% 11%
THEATERS 49%
61% 25% 14%
ZOO/ANIMAL
ATTRACTIONS 47%
55% 32% 13%
THEME PARKS 42%
52% 36% 12%
HISTORIC SITES 40%
50% 40% 10%
SCREEN THEATERS 40%
61% 17% 22%
AQUARIUMS 39%There are several theories
that attempt to explain
why this might be happening.
First LAST
People of color are largely less satisfied with their These top NPS attractions – Parks, Gardens, and
attraction visits; and the younger an American is, the Theaters– all seem to reflect a naturally, constantly-
more likely they are to represent a more diverse lineage. changing offering. The flora and fauna of the outdoors hide
It is possible that some attractions are not reflecting and reveal as the seasons rotate, flowers bloom, the leaves
these populations proportionately in their leadership transform, and different productions and actors constantly
and boards, and are therefore not adapting their content, grace the stage. For travelers who are often seeking fresh,
messaging, and attractions/interests to meet these unique, and new experiences, these destinations inherently
populations’ interests and styles. offer the variety they seek.
For attraction managers, the implications are clear:
Second implementing systems that provide the opportunity
to rapidly respond to guest pain points is essential to
resolve conflict and keep visitors satisfied and coming
back. Better understanding unique - yet growing
The category of satisfaction which saw the greatest
- cultures will help create more relevant content
decrease was with lines and wait times. In an on-
and communications, and keeping that content and
demand world of streaming video, Amazon GO groceries,
corresponding attractions fresh and new will encourage
and “Hey Google” inquiries, hours in queue just won’t
these visitors to come back through your front door.
cut it anymore for today’s younger attraction visitors.
There’s too much instant gratification, convenience, and
entertainment to choose from to spend one’s life waiting
in line.
23The Traveler Tracker
We’ve been monitoring the tracking chips of American
travelers for five years now (not really, we simply trust what
they report). The following chart demonstrates which attractions
our respondents visited in 2019. While this does not account for
party size or repeat visitation, the average attraction experienced a
1.6 point decline from 2018-2019, and an average decline of
4.6% over five years, with the greatest declines in Zoos, Theaters,
and FECs.
FAMILY ENTERTAINMENT
NATIONAL/STATE PARKS
AMUSEMENT PARKS
HISTORY MUSEUMS
ZOOS/ANIMAL
ART MUSEUMS
THEME PARKS/
ATTRACTIONS
SIGHTSEEING
LANDMARKS
AQUARIUMS
THEATERS
HISTORIC
CENTERS
TOURS
35% 30% 30% 28% 26% 26% 22% 21% 21% 19%2019 Attendance Report
The percentage of respondents who have visited an attraction,
five year comparison from 2015-2019.
2015 2016 2017 2018
2019
NATURAL WONDERS
THEATERS/CRUISES
BREWERY/WINERY
HISTORIC HOMES
LARGE FORMAT
ART GALLERIES
WATER PARKS
& MANSIONS
BOTANICAL
CHILDREN’S
MUSEUMS
GARDENS
THEATERS
CENTERS
SCIENCE
DINNER
TOURS
19% 18% 17% 15% 14% 14% 14% 13% 12% 11%
25Welcoming
Diversity
In The Experience Economy, author Joe Pine
discusses how mass customization is an essential
component of today’s business success. But
it’s far more than being able to provide a wide
array of options; easily combined in a myriad of
choices; quickly, efficiently, and cost-effectively.
The key to success is better understanding
people, and celebrating and empowering our
differences.
Our 2020 Voice of the Visitor is the first of our
annual reports or Destinologies to explore the
Lesbian, Gay, Bisexual, Transgender, Queer,
and more (LGBTQ+) communities. While the
acronym representing these populations can
extend much further (e.g. “LGBTTTQQIAA” and
beyond), we have focused on some of the largest
communities for the sake of our study.
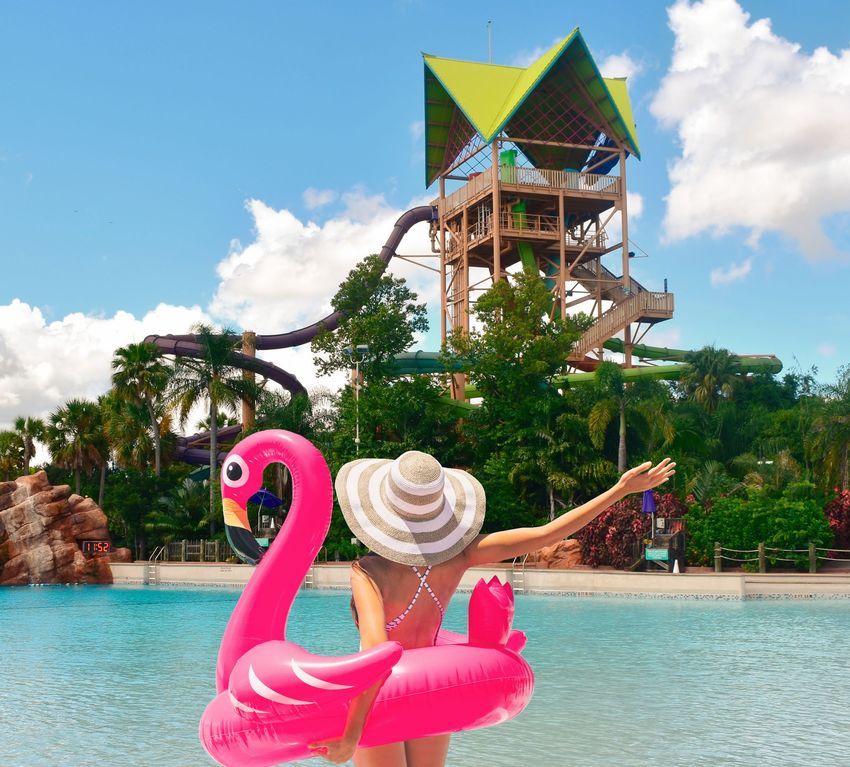
2020 Voice of the Visitor11% of 2019 attraction visitors identify with the
LGBTQ+ population, a significantly larger share than
their representation in the American population at
LGBTQ+ TRAVELERS
4.5% (UCLA Williams Institute). Looking at our data, Approximately One in Ten Attractions Visitors have
these attraction-goers statistically share a number of a sexual orientation other than heterosexual
similarities with their heterosexual counterparts. They
intend to visit attractions at roughly the same rates, both
visit in the summer in similar proportions, are similarly % OF TOTAL
repeat visitors, visit attractions with children, and both 11% 89%
ATTRATIONS VISITORS
find feeling welcome comparably important. However,
beyond making up significantly smaller portions of the
population and attraction visitors, those in LGBTQ+ were
far less likely to travel for leisure last year, less likely to % OF TOTAL
4% 96%
U.S. POPULATION
have a season pass or membership; and like people of
color, far less satisfied with their attraction visit.
Although smaller in headcount, this sector of traveler
plays a critical economic cornerstone. The World Trade
Organization estimates that there will be 180 million Traveled for
70% 82%
LGBTQ+ global tourists this year. Community Leisure in 2019
Marketing & Insights showed that this demographic
spends 33% more than their heterosexual counterparts
while traveling - often called the “pink dollar/pound” in Intent to visit an
practice - equating the global LBGTQ+ travel market at 82% 86%
Attraction in 2020
$211 billion (Out Now Consulting).
Have a Season
59% 46%
Pass/Membership
53% 58% Repeat Visitors
Visited Attraction
44% 48%
with Children
Heterosexual Other Sexual Orientation 27TOP TEN BEST/WORST PLACES
FOR LGBTQ+ TRAVEL
COPENHAGEN,
1 NIGERIA 1
DENMARK
2 QATAR NEW ZEALAND 2
3 YEMEN TORONTO, CANADA 3
4 SAUDI ARABIA PALM SPRINGS, USA 4
5 SITGES, SPAIN 5
TANZANIA
BERLIN, GERMANY
6 IRAN 6
SKIATHOS &
7 SUDAN MYKONOS, GREECE 7
8 BARBADOS NEW YORK CITY, USA 8
9 MALAYSIA REYKJAVIK, ICELAND 9
10
MONTEVIDEO, 10
MALAWI
URUGUAYWhile Lyric and Asher Ferguson So how can you attract this community, excel in
hospitality, and keep them coming back? While
have created the several CVBs around the country, like Los Angeles and
Philadelphia, have enacted permanent LGBTQ+ tourism
LGBTQ+ DANGER INDEX campaigns - with Philadelphia proudly touting that it
to identify regions unsafe for LGBTQ+ travelers, was the first in the nation to do so - Richard Gray of the
Fort Lauderdale CVB notes that simply existing isn’t
Lonely Planet has identified enough. “Some destinations actively marketing to LGBT
travelers aren’t doing so authentically, and travelers
those destinations know the difference,” says Gray, LGBT managing director
for the CVB. “Destinations which aren’t bold in their
MOST WELCOMING efforts to reach this traveler segment are often viewed as
unenlightened and out of touch.”
of the demographic.
To help fill this authenticity communication gap, The
International LGBTQ+ Travel Association (IGLTA) is a
LEFT GRAPH
worldwide network of LGBTQ+-friendly accommodations,
transportation, destinations, service providers, travel
agendas, tour operators, events, and travel media.
The organization connects these providers in over 80
countries to other providers and travelers to assist in trip-
planning, travel education, and special tours.
What can attractions across America do to attract
these communities and grow their satisfaction?
The advice is parallel to that of the people of color
communities: working to reflect this population
internally; reviewing marketing, programming, and
exhibit materials; conducting focus groups; reaching
out to leverage local CVB messaging and tactics; and
undergoing LGBTQ+ diversity training. As providers
of incredible experiences and education, attraction
managers are not only best empowered by understanding
their guests, but also empathizing with them to craft
environments that are truly for them.
29“Being in an atmosphere that
is beautiful is a great way for a
peaceful experience with family.”
- Consumer Survey Response
2020 Voice of the Visitor3.8
6
4.
41
Overall
Satisfaction Are Attractions
3.8
1 4.2
7 Friendliness
of Staff
for People of Color?
In 2019, we relayed the findings of the Brookings
6 4.17
3.7 Value for Institution that the United States is projected to be
the Money a minority white nation by 2045. The growth in
people of color populations has shown no signs of
slowing, with 2020 on track to be the first year in
3.88 4.23 Uniqueness of the history of the United States where the entire
the Experience under-18 population will be majority non-white.
In less than a decade, Americans under 30 will be
majority non-white.
4.13 Overall
3.71
Wait Time And more and more, attractions don’t seem to be for
them.
Enjoyment People of color comprised 24% of attraction
3.95 4.37 for Adults visitors in 2019, while making up 40% of the
US population. While this gap shrank slightly
since our 2019 report, largely driven by Latinx
Enjoyment communities visiting more attractions, these
3.66 3.75 for Children populations are even more dissatisfied with their
attraction experiences than last year.
Feeling
Compared to non-Hispanic whites, people of
3.89 9 Welcome
4.2 color exhibit significantly lower satisfaction
with their attraction experiences. Whether
it’s their overall satisfaction, the friendliness (or
Relaxing
rudeness) of attraction staff, or feeling welcome,
3.8 3 Experience
2 4.2 people of color just aren’t perceiving the same
quality experiences as non-Hispanic whites.
They also have a significantly lower instance of
recommending attractions to friends and family, as
SATISFACTION GAP
well as a much lower intent to visit attractions this
People of Color year, compared to their demographics’ average over
five years.
Non-Hispanic Whites
Rate the level of satisfaction 31SO WHAT'S WRONG? OUR ADVICE
Wanting to feel welcome is a universal ethos that we feel all of our suggestions from 2019
everywhere we go – our family, our work place, and our leisure
pursuits; and what influences the feeling of welcome-ness still hold true for attraction managers
takes many forms: how we’re treated, how safe we feel, how the
environment reflects our identity and values, how much we feel
across the country...
part of the present community, and more.
Unfortunately, there are a number of societal indicators
that may point to the fact that 2020’s America is not quite
welcoming to people of color. According to the recent Pew
Research Center study Race in America 2019, more than
seven in ten black Americans say that race relations in the
U.S. are generally bad. Eight in ten black persons agree that
the legacy of slavery affects the position of black people in Aspire to have staff, volunteers, and boards
American society today a great deal/fair amount, while 56% proportionally reflect population demographics.
of adults say being black hurts people’s ability to get ahead in
the United States. 65% of Americans said that it has become
more common for people to express racist or racially insensitive
views in the last three years.
There are many theories too wide and too detailed to fit into
our annual Voice of the Visitor that endeavor to academically
and culturally explain the origins and continuation of these
phenomena.
Review the content of marketing, exhibit, and
programming materials to gauge their societal
relevance and reflection.From our 2019 data, people of color were most likely to a psychology professor at the University of Connecticut,
visit Theme Parks (36%), Zoos (30%) Water Parks (29%), supports this approach, noting that it’s the right time for
and Aquariums (27%), while they were least likely to visit employers to refresh their company-wide diversity training
Natural Wonders (11%), Art Galleries (10%), and Historic (or begin it, if they’ve never done it before). Luis H. Zayas,
Homes and Mansions (7%) – with Children’s Museums professor of social work and psychiatry at the University
(34%), Historic Homes and Mansions (35%), and Art of Texas at Austin, also notes that organizations have
Galleries (37%) being their least-likely prospect in 2020. the opportunity to form “safe spaces” where oppressed/
American Historic Homes, Landmarks, and Art Galleries marginalized groups “can share information and comfort each
have, on the majority, been the long-standing place of white other.” Hundreds of thousands of attractions have the room
history and white culture, which is not always reflective of the to host these kinds of events, and talented staff trained at
values, interests, and stories of people of color. Continuing interfacing with the public.
to find ways to celebrate these diverse stories, perspectives,
and achievements at these kinds of destinations is a key case Attractions might not have created this problem, but
study in making these groups welcome. they may be an incredible source for the solution as
epicenters for engaging storytelling and providing safe
After two black men were arrested in a Philadelphia Starbucks and welcoming places for their communities.
while they waited for a friend before ordering coffee, the
beverage titan closed more than 8,000 stores to address racial
bias and diversity training with its staff. Monica Williams,
PEOPLE OF COLOR
UNDERREPRESENTED IN THE MARKET People of Color
Non-Hispanic
% of Total
76% 24% Whites
Attrations Visitors
% of Total
60% U.S. Population 40%
Traveled for
82% Leisure in 2019 75%
Intent to visit an
86% Attraction in 2020 84%
Have a Season
43% 59%
Pass/Membership
33When Politics &
Mission Collide
2019’s American Alliance of Museums conference was an
electrified environment, full of dedicated and passionate
practitioners asking hard questions to advance the museum
field. An umbrella session, ‘What Is a Museum in 2019,’
demonstrated the overarching challenge, where countless
sessions explored AAM’s current charge in its Diversity,
Equity, Accessibility, and Inclusion (DEAI) initiative. But
numerous sessions addressed the white (or red) elephant in
the room, and how museums should relate: A Conversation
on Cultural Diplomacy When a Nation Must Be “First;”
Fake News, Flat Planets, and Hot Winters; and Public Policy
and Advocacy: Championing Museums in Volatile Times.
2020 Voice of the VisitorWith many attractions’ missions based on educating the
public and bettering their communities, museums are
struggling with how they should interpret – or act upon – one of
the most globe-spanning, politically-contentious environments
in modern history.
So we asked their visitors.
40% nials
Millen
g
Trailin 62% of attraction visitors vote in elections, which is on par
with the national rates for 2016 and 2012. However, fewer than
half of attraction guests – 46% - expect attractions to actively
39% nnials support causes that align with their missions. Even fewer – just
Mille
g
Leadin 26% - agree that attractions should take a more active political
role on issues that directly affect them or their customers.
24%
The demographic break-down provides even more interesting
Gen X
insights. Generally speaking, the older an attraction guest
is, the less they want to hear about politics during
their attraction visit. People of color are significantly more
12%
ers interested in attractions interpreting politics, but still none
Boom
of the micro-segmentation shows a majority in favor – blacks
with 46% represent the largest group. When evaluating
14% by orientation, fewer than a third of those in the LGBTQ+
es community – 29.8% - feel that attractions should engage in
Matur
politics, while heterosexuals come in even lower at 26%.
46% merican
can A
Afri
Black/
43%
nic
Hispa
NOT SO FAST
ON POLITICS
Attractions should take a more
30% active political role on issues
Asian
that directly affect them or
their customers.
23% sian 2019 % AGREE /STRONGLY AGREE
auca
/C 35
White“It was a gathering of friends and relatives
from out of town. We were all able to
participate, regardless of skill level.”
- Consumer Survey Response
2020 Voice of the VisitorWe might hypothesize that attractions whose functions While some attractions have the ability to decide their
are largely educating the public about history or science level of engagement in politics, some simply can’t avoid
– two realms strongly influenced by political policy – it. Many National Park Service sites were created out of
would have stronger support for political interpretation. federal legislation and subject to future policy, detailed
However, History Museums (24%), Historic Homes on their “Shaping the Political Landscape” landing
(19%), and Historic Landmarks (18%) are among page. The North Carolina Aquarium was recently the
the four lowest-ranked attractions that have this kind of site of announcing state funding decisions, which
support from visitors. While surprising at first, a sizable was contentious between political parties and the
proportion of these patrons are often white, older state’s governor. Last year’s government shut-down
generations, which we’ve seen statistically aren’t largely effected all of the Smithsonian Institutions – yet the
in favor of this kind of commentary at their attractions. animals at the National Zoological Park still needed
to be taken care of during the closure. A member of
With these lower numbers, attractions might assume the Presidential family contentiously highlighted on
that if giving guests what they want is the priority, then Instagram the effectiveness of barriers at zoos, while
maybe they should back off of political commentary these institutions often try to focus on the closeness,
and activism. However, remember that the largest authenticity, and immersion between guests and
demographic segment of attraction guests are animals. Even the most-attended theme park in the
Millennials – especially those with children; and world has had to continuously remove re-election
that by 2030, the majority of people under 30 will campaign banners from Main Street, Splash Mountain,
be non-white, and the nation’s population will be a and even its Broadway production of Frozen – banning
people-of-color majority by 2045. So when planning one individual from all Disney properties in perpetuity.
for the future, these groups are more interested in
political commentary than today’s older generations or Whether or not attractions should engage in political
dominant demographics. interpretation is a decision that has guests and the
industry divided; and for some, it’s unavoidable. The
In practice, numerous museums around the world question is an important one though that destinations
have decided to engage in political discourse, whether should continue to ponder openly with their staff,
overt changes in their collections, launching touring volunteers, boards, visitors, and non-visitors, and carve
exhibitions which comment on current policy a path into the future that’s best for their missions and
disagreements, and executives resigning from their communities.
institutions or launching grassroots “Museums are
not neutral” campaigns. David Fleming, director of
National Museums Liverpool opened the Federation
of International Human Rights Museums conference
with the statement that it is hypocritical for museums
to claim they are apolitical, “the issue isn’t whether
it’s right or wrong to be political – the issue is that all
museums are, so why do people pretend they are not?”
37aka GENERATION Z 2020 Voice of the Visitor
Philanthroteens, iGen, Pluralists: Generation Z has long          However, this generation is 31 percentage points less
been the enigma that researchers and marketers have sought        satisfied with their attraction visitation than average, 35
to define. Now in the midst of college, readying for the work     percentage points less satisfied with attraction employees,
force, and preparing for their first presidential election, the   and 31 percentage points less likely to recommend
largest generation in history is getting ready to make a big      attractions to friends and family. The most likely theory
impact on the world.                                              relates to the demographics in our first chapter: if by 2030,
                                                                  most Americans under 30 will be non-white, and currently
Born between 1996 and 2010, members of Gen. Z are the             people of color are largely unsatisfied with their attraction
largest, most ethnically-diverse, most connected, and             visits, then the Gen. Z demographic aligns with those
most college-attending generation in history; and upon            satisfaction rates. Secondarily, this generation has grown up
their impending graduation, will be entering the workforce        in a permeating culture of reviews and feedback, from social
and earning disposable income. An incredible 97% of our           media Likes to Yelp and TripAdvisor reviews. Even airport
Gen. Z respondents visited an attraction last year, with 67%      restrooms have a button you can press upon exit to gauge your
traveling for leisure. Expectedly, these young adults are far     satisfaction. Immersed in that mentality, Gen. Z might have
from average though. They are 30 percentage points more           much higher standards and criteria that need to be met
likely to have a season pass or membership to an attraction,      than previous generations to earn that “Like.”
and are 18 percentage points more likely to have an
optimistic outlook on the economy.

                                                                                        67%       Traveled for Leisure
                    100%
                    TOTAL                                                                         Intent to visit an
                                                                                                                         81%

                                            GENERATION Z
                  SURVEYED                                                                        Attraction in 2020

                                                                                                  Have a Season
                                                                                        77%       Pass/Membership

                                            18 - 22 YEARS OLD                                     Repeat Visitors        42%
                                             A new generation is entering
                                            the market, bound to upset the
                                                                                                  Visited with
                                                     status quo.                        69%       Children

                                                                                                  Children Living in     45%
                   6%                                                                             Household
                  GEN Z
                                                                                                  Intent to Travel for
                                                                                        74%       Leisure in 2020
                                                                                                                                  39
Fast Facts on Generation Z
As Gen. Z ages and spreads out into the world, we learn more about them every day.
The following are Gen. Z statistics from across the web!
96% own a
2026by this
by this year,
year,
30% SMARTPHONE
and spend at least
have already 10 HOURS A DAY
GENERATION Z on an
will be the most DONATED ELECTRONIC DEVICE
to an organization
VALUABLE
CONSUMER POPULATION
AT $82 MILLION
24 MILLION 70%
NOTE THAT SALARY 68%
GEN. Z MEMBERS IS THEIR
is their top TOP Proportion
Proportion who
who feels
feels
WORKPLACE MOTIVATOR “the
“the US is headedin
US is headed in
are eligible to vote this year,
the
thewrong
wrongdirection”
direction”
making them the
LARGEST 60%
want jobs that have
voting age demographic
SOCIAL IMPACT
! 76%
ARE WORRIED
ABOUT THE PLANET
as compared to
31% OF MILLENNIALS
88%
Are optimistic
about their
PERSONAL FUTUREWhile Gen. Z largely parallels Millennials’ social
8 SECONDS priorities, they still have a lot of differences. Nimble
and smart attraction marketers should be making
plans this year – if they haven’t already – to cater to
Average attention span, this immense demographic. As travel writer Geoff
Whitmore identified last fall in Forbes, Gen. Z is far
advising marketers to leverage more excited about wholly unique opportunities,
that often involve educational opportunities like a
MEMES, EMOJIS, AND GIFS mixology class (rather than just sipping the Pina Colada
on the beach), and make more sustainable and eco-
friendly choices during their travel than previous
generations. Unsurprisingly, they’re far more adept at
new and nimble technologies in coordinating travel,
like booking flights through Twitter DMs, but are also
far more interested in the new “bleisure” trend: eagerly
taking work trips, and extending those trips by a
few days to explore the local tourism scene.
40%
proportion of the
Attraction managers may look to Gen. Z’s top
priorities, concerns, and engagement styles to begin
retooling their destinations to peak their interests.
US WORKING &
Digital, community-based, social cause-minded,
CONSUMER unique, authentic, growth-oriented experiences
POPULATION
in 2020 may be the hallmark of your
future guest base.
40%
WANT DAILY INTERACTIONS
with their boss, and
“think they’ve done
something wrong if SOURCES: BusinessInsider, Concordia University
they don’t” St. Paul, The Nation, ITA Group, Digital Marketing
Institute, Vision Critical, and Classy
41“A place where I can just be myself and
not be judged for who I am.”
- Consumer Survey Response
2020 Voice of the VisitorGen. Z is certainly digitally connected, and attractions
know that they have to advertise on social media, but
which channels do Gen. Z use – and use more than
others?
While attraction marketers, front-line staff, and
designers are strategizing to meet the style and interest
of Generation Z, researchers are already looking farther
down the road at Generation Alpha. Born after 2010,
this generation hasn’t quickly adopted technology as a
tool, but have found swiping smartphones and talking
to voice-assisted devices integral parts of daily life. The
starting year of this generation marked the release of
the iPad, and the word of 2010 was “app.” Coined by
McCrindle, this “Screenager” generation is used to digital
glass being the primary disseminator of information,
as opposed to paper or in-person, and the medium is,
“kinaesthetic, visual, interactive, connective and portable
format.”
While Gen. Alpha may be too young to be basing master
plan and design decisions on, attraction managers
may look to Gen. Z’s top priorities, concerns, and
engagement styles to begin retooling their destinations
to meet their interests. Digital, community-based, social
cause-minded, unique, authentic, growth-oriented
experiences may be the hallmark of your future guest
base.
43Smartly Starting the Decade
People around the world experienced tumult and                  “The children are our future,” the common adage goes.
trepidation in 2019 leading into 2020, but those stories        They absolutely are: they are our future attraction
don’t have to become trends. Attraction managers have           leadership, board members, donors, guests, staff, and
the resources, the intelligence, the empathy, and the teams     voters. As Millennials and Gen. Z assert their proportional
to listen to the public, digest what they’ve gone through,      dominance in the consumer and attraction economy,
and provide fresh new experiences to cater to what they         attractions will adapt – strategically or naturally – to meet
need – through entertainment, education, and comfort.           their needs, interest, and cultures. This diverse market
                                                                is set to greatly influence the industry landscape as
A central tenant in that successful course correction is        we know it; and we have the choice to resist change and
the greater understanding of more specific demographics         rely on business as usual, or embrace change and evolve.
such as LGBTQ+, people of color, and Generation Z
– and where and how those groups overlap. Reacting and
planning with an empathetic wisdom to those insights will
be key in crafting places of employment, volunteerism,
and leisure that are relevant, empowering, and welcoming                      We have the
to today’s growingly-diverse population.
                                                                             opportunity to
We see in our data that Americans are seeking more                        start this decade in
therapeutic time in the outdoors, yet are trending to either
stay at home with family and friends – with the world at                    brilliant fashion.
their swipe left/right digital fingertips – or to venture out
locally to their familiar haunts. We must strive to better                 All we have to do is
understand this growing need for the “comfortable
familiar,” and identify our inimitable values – both                        LISTEN & ACT.
physical and intangible - that cannot be replicated with
the tap of a black mirror or a voice command in the living
room.

                                                                                                                                45
RUBY FALLS Chattanooga, Tennessee
www.pgavdestinations.com
We believe in the power of destinations to enrich lives, enhance communities, and celebrate culture,
nature, and heritage through an unforgettable story and beautiful, immersive design.

PGAV Destinations is recognized across the world as the leading master planner and designer of theme
parks, zoos, museums, aquariums, heritage sites, destination retail, and brand-based celebrations. Our
passionate staff includes more than 120 full-time dreamers, thinkers, and makers including planners,
architects, brand specialists, earned revenue specialists, interior designers, graphic designers, landscape
architects, artists, and interpretive designers: all thrill seekers at the drawing board. No other firm in the
industry offers such an integrated approach to destination design and strategy.

We take a holistic approach in creating experiences that exemplify your mission, brand, and heritage,
leveraging leading consumer insights and research that is often published in our quarterly magazine,
Destinology. With a passion for place-making, we design incredible destinations that enrich the lives of
your visitors through engaging, immersive, memory-making moments.

                                     www.h2rmarketresearch.com
Your customers are talking. Instead of just sharing their experience with friends over coffee, H2R
brings their voice to your conference table. When you’re asking, “Where should we expand? Did our ad
generate more revenue than it cost? Why are customers choosing our competitor?” H2R reveals the
answers.

Our clients make decisions based on insight from rigorous research and the expertise other
market research firms envy. And that helps shareholders, owners, and employees all breathe a sigh of
relief. We’ve partnered with some amazing companies. Some large, some small. Some local, some national,
and some international. So whether your company fits into a category or not, you’ll fit with us.

                                                                                                                 47
EXPERIENCES THAT STRETCH THE IMAGINATION
pgavdestinations.com | 314-231-7318
in partnership with
FSC logo VOICE OF THE VISITOR is printed on paper that is made of 100% post-consumer waste, using soy-
placement based inks and manufactured using 100% Green-e certified renewable energy.You can also read