Volaris Capital Management - Fallacy of Risk-Neutral Approach to Options

Page created by Bernice Mejia
 
CONTINUE READING
Volaris Capital Management - Fallacy of Risk-Neutral Approach to Options
Volaris Capital
Management -
Fallacy of Risk-Neutral
Approach to Options

Vivek Kapoor,
CEO/CIO
Margaret Sundberg,
Quantitative Trader & Portfolio Manager
Volaris Capital Management, LLC
March 10, 2021

Exchange and Industry Sponsored Webinars are presented by unaffiliated third parties. Interactive
Brokers LLC is not responsible for the content of these presentations. You should review the
contents of each presentation and make your own judgment as to whether the content is
appropriate for you. Interactive Brokers LLC does not provide recommendations or advice. This
presentation is not an advertisement or solicitation for new customers. It is intended only as an
educational presentation.
Volaris Capital Management - Fallacy of Risk-Neutral Approach to Options
Disclosures

Options involve risk and are not suitable for all investors. For information on the uses and risks of options, you can obtain a copy of the Options Clearing
Corporation risk disclosure document titled Characteristics and Risks of Standardized Options by calling (312) 542-6901.

Futures are not suitable for all investors. The amount you may lose may be greater than your initial investment. Before trading futures, please read the
CFTC Risk Disclosure. For a copy visit interactivebrokers.com.

Security futures involve a high degree of risk and are not suitable for all investors. The amount you may lose may be greater than your initial investment.
Before trading security futures, please read the Security Futures Risk Disclosure Statement. For a copy visit Interactivebrokers.com.

There is a substantial risk of loss in foreign exchange trading. The settlement date of foreign exchange trades can vary due to time zone differences and
bank holidays. When trading across foreign exchange markets, this may necessitate borrowing funds to settle foreign exchange trades. The interest rate
on borrowed funds must be considered when computing the cost of trades across multiple markets.

The Order types available through Interactive Brokers LLC’s Trader Workstation are designed to help you limit your loss and/or lock in a profit. Market
conditions and other factors may affect execution. In general, orders guarantee a fill or guarantee a price, but not both. In extreme market conditions,
an order may either be executed at a different price than anticipated or may not be filled in the marketplace.

There is a substantial risk of loss in trading futures and options. Past performance is not indicative of future results.

Any stock, options or futures symbols displayed are for illustrative purposes only and are not intended to portray recommendations.

IRS Circular 230 Notice: These statements are provided for information purposes only, are not intended to constitute tax advice which may be relied
upon to avoid penalties under any federal, state, local or other tax statutes or regulations, and do not resolve any tax issues in your favor.

Interactive Brokers LLC is a member of NYSE FINRA SIPC
Irreducible                               4400   Simulation of potential returns consistent
Risks:                                           with realistic long-term information as
                                                 well as cognizant of recent observations:
                                          4200

Fallacy of Risk-
Neutral
                                          4000

                                                          observed

Approach to                               3800            S&P 500 Index

Options                                   3600

                                          3400
Vivek Kapoor
Chief Investment Officer

                                                                                      12/7/2020
                                          3200

                                                                                                       extrapolation
                                          3000
Margaret Francis Sundberg
Quantitative Trader & Portfolio Manager

                                            Take calculated risks. That is quite different from being rash.
                                                                                 General George Patton

                                            Any stock, options or futures symbols displayed are for illustrative purposes only and are not intended to portray recommendations.
Volaris Mission

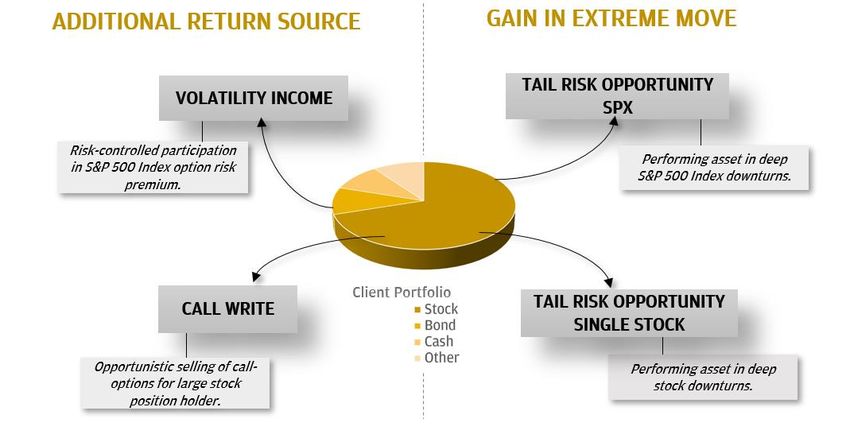
• We provide investors access to yield and tail-
  risk opportunities in the options market.

• Our insights, based on experience and active
  research, are applied to pursue client’s goals.

                                                    2
Volaris Solutions
         ▪ Clients may use existing portfolio holding (stocks, bonds, etc.) as collateral to employ Volaris strategies.
         ▪ Minimal opportunity cost implementation employing listed options in Separately Managed Account.
         ▪ Defined risk strategies with transparency and daily liquidity.

                                                                                                                                                                                                                             3
These materials do not constitute an offer to sell or a solicitation of an offer to buy securities. Please see “Important Disclosures” regarding the data and information contained and the views and opinions expressed in this material.
Failure of Indexation in Volatility: Exhibit A
                                     SHORT VOLATILITY                                                                            LONG VOLATILITY
                                                Going broke selling Volatility                                                          Going broke buying Volatility
                                     SPVXSPIT Index (S&P 500 VIX Short-Term Futures Inverse                                  SPVIXSTR Index (S&P 500 VIX Short-Term Futures Index
                                     Index Total Return): Represents short exposure to one-                                  Total Return): Represents long exposure to one-month
                                     month maturity VIX futures contracts.                                                   maturity VIX futures contracts.

                                                   SPVXSPIT INDEX
                               2500000                                                                                 250000                                  SPVIXSTR INDEX

                               2000000                                                                                 200000

                               1500000                                                                                 150000

                               1000000                                                                                 100000

                                500000                                                                                   50000

                                      0                                                                                      0

                               VIX futures or Variance Swaps do not lend to a prudential portfolio allocation.

These materials do not constitute an offer to sell or a solicitation of an offer to buy securities. Please see “Important Disclosures” regarding the data and information contained and the views and opinions
                                                                                                                                                                                                                        4
expressed in this material. Past performance is not indicative of future results. Any stock, options or futures symbols displayed are for illustrative purposes only and are not intended to portray recommendations.
Failure of Indexation in Volatility: Exhibit B
                                    40%    Cardinal Characteristic Aware Strategy   CNDR Index
                                                                                                                                                   40%
                                    35%

                                                                                                                               Cumulative Return
          Cumulative Gross Return

                                    30%                                                                                                            20%
                                    25%
                                    20%                                                                                                            0%
                                    15%                                                                                                                                SPTR
                                    10%                                                                                                     -20%                       JHQAX US Equity
                                     5%
                                                                                                                                                                       SPTR + Cardinal Characteristic
                                     0%                                                                                                     -40%                       Aware Strategy
                                    -5%
                                    -10%

                                                                       Five Cardinal Characteristics of SPX Index Options
                                                                      1.   Disparity Between Out of the Money Puts and Calls
                                                                      2.   Asymmetry Between Buyer and Seller
                                                                      3.   Exploding Asymmetry at Expiry
                                                                      4.   Exploding Asymmetry with Out-of-the-Moneyness
                                                                      5.   Elements of Timing (recognizing Volatility environment)
These materials do not constitute an offer to sell or a solicitation of an offer to buy securities. Please see “Important Disclosures” regarding the data and information contained and the views and opinions          5
expressed in this material. Past performance is not indicative of future results. Any stock, options or futures symbols displayed are for illustrative purposes only and are not intended to portray recommendations.
Risk-Aware vs. Risk-Neutral

            Risk Premium
                              Expected                                        Unique
                             Replication            OPTION PRICE            Replication
                                Cost                                           Cost

              Risk Aware Approach                                        Risk Neutral Approach
• Requires assessing attempted replication costs.           • Makes no explicit reference to irreducible attempted
                                                              replication uncertainty.
• Expected attempted replication costs of a sold option
  have a highly adverse asymmetric distribution around      • Assumes option prices are an expected option payoff
  them.                                                       under a “risk-neutral-measure”.
• Deviations of option price from expected attempted        • Risk-neutral-measures are to be fitted to observed
  replication costs are interpreted as risk-premiums.         option prices.

                     “Lead me from unreal to real”. Brihadaranayaka Upanishad 700 BC
                                                                                                                   6
Real-Returns
                                                                           RYTHMS & RHYMES                                                                                                                                                             NON-NORMALITY
                             0.15                                                                                                                                                                                                      35
S&P 500 Index daily return

                                                                                                                                                                                                                                                                                                               0
                              0.1                                                                                                                                                                                                      30
                                                                                                                                                                                                                                                                kurtosis
                             0.05                                                                                                                                                                                                                                                                              -0.2
                                                                                                                                                                                                                                                                Normal Distribution Kurtosis
                                                                                                                                                                                                                                       25
                                                                                                                                                                                                                                                                                                                                        “Molecules colliding

                                                                                                                                                                                                                                                                                                                      return skewness
                                                                                                                                                                                                           return kurtosis
                                                                                                                                                                                                                                                                skewness
                                   0                                                                                                                                                                                                                                                                           -0.4
                                                                                                                                                                                                                                                                Normal Dstribution Skewness
                                                                                                                                                                                                                                       20
                             -0.05
                                                                                                                                                                                                                                                                                                               -0.6
                                                                                                                                                                                                                                                                                                                                        randomly under
                                                                                                                                                                                                                                       15
                              -0.1
                                                                                                                                                                                                                                                                                                               -0.8
                                                                                                                                                                                                                                                                                                                                        thermal agitations
                             -0.15                                                                                                                                                                                                     10

                              -0.2                                                                                                                                                                                                                                                                             -1
                                                                                                                                                                                                                                                                                                                                        have nothing in
                                                                                                                                                                                                                                        5

                             -0.25                                                                                                                                                                                                                                                                                                      common with the
                                                                                                                                 1/3/90
                                       1/3/50
                                                1/3/54
                                                         1/3/58
                                                                  1/3/62
                                                                           1/3/66
                                                                                    1/3/70
                                                                                             1/3/74
                                                                                                      1/3/78
                                                                                                               1/3/82
                                                                                                                        1/3/86

                                                                                                                                           1/3/94
                                                                                                                                                    1/3/98
                                                                                                                                                              1/3/02
                                                                                                                                                                       1/3/06
                                                                                                                                                                                1/3/10
                                                                                                                                                                                         1/3/14
                                                                                                                                                                                                  1/3/18
                                                                                                                                                                                                                                                                                                                                        human enterprise of
                                                                                                                                                                                                                                        0                                                                      -1.2
                                                                                                                                                                                                                                            0          2        4         6          8         10         12
                                                                                                                                                                                                                                                              holding horizon (months)
                                                                                                                                                                                                                                                                                                                                        risk-taking, trading,
                               1                                                                                                                                                                                                       0.04                                                                                             and price discovery”.

                                                                                                                                                                                                           return sign-mag crosscorr
                             0.9
                                                                                                                                                                                                                                       0.02
return mag autocorr

                             0.8
                             0.7                                                                                                                                                                                                            0                                                                                           Anonymous 2000 AD
                             0.6
                                                                                                                                                                                                                                       -0.02
                             0.5
                             0.4                                                                                                                                                                                                       -0.04
                             0.3                                                                                                                                                                                                       -0.06
                             0.2
                                                                                                                                                                                                                                       -0.08
                             0.1
                               0                                                                                                                                                                                                        -0.1
                                   -252              -189                  -126               -63                   0                     63                 126                189               252                                           -252   -189    -126    -63       0        63        126   189             252
                                                                                                      lag (days)                                                                                                                                                             lag (days)

                                                                                    PERSISTENCE                                                                                                                                                                  ASYMMETRY                                                                            7
                                                                           Any stock, options or futures symbols displayed are for illustrative purposes only and are not intended to portray recommendations.
Real Returns
                                           GARAM      Gaussian            Empirical                                               Term-Structure of the Non-Gaussianity of S&P 500 Index Returns
                            100
    probability density

                             10

                              1                                                                                          GARAM       Gaussian             Empirical
                             0.1                                                                           100

                                                                                   probability density
                            0.01                                                                            10

                           0.001                                                                             1

                          0.0001                                                                            0.1
                                   -0.6      -0.4   -0.2        0         0.2              0.4                    0.6
                                                                                                           0.01
                                                           5-day return
                                                                                                          0.001                                                                                              GARAM      Gaussian             Empirical
                                                                                                         0.0001                                                                                100
                                                                                                                  -0.6     -0.4    -0.2         0         0.2         0.4                      0.6

                                                                                                                                                                       probability density
                                                                                                                                                                                                10
                                                                                                                                          10-day return
                                                                                                                                                                                                 1

                                                                                                                                                                                                0.1
                                                           Holding horizon (i.e., term)                                                                                                        0.01

                                                                                                                                                                                              0.001
                                          Buildup of asymmetry and persistence of kurtosis                                                                                                   0.0001
                                                                                                                                                                                                      -0.6     -0.4   -0.2         0         0.2         0.4   0.6
                                                                                                                                                                                                                             21-day return

Wang, Jiaxin and Petrelli, Andrea and Balachandran, Ram and Siu, Olivia and Zhang, Jun and Chatterjee, Rupak and Kapoor, Vivek, General Auto-Regressive Asset Model (July 1, 2009).
Available at SSRN: https://ssrn.com/abstract=1428555 or http://dx.doi.org/10.2139/ssrn.1428555
                                                                                                                                                                             8
                                                    Any stock, options or futures symbols displayed are for illustrative purposes only and are not intended to portray recommendations.
Volaris Risk-Aware Approach
                                                                                                                                                                       1.08
     Our tool to describe the asset is a Real-World Stochastic Model:                                                                                                                      Conditional Simulations
                                                                                                                                                                       1.06
                                                                                                                                                                                        (Non-Stationary & Non-Normal)
     • We utilize observed persistence & lead-lag relationships between return
                                                                                                                                                                       1.04
       magnitude and sign and other conditioning variables using a vector auto-
       regressive framework to realistically capture the first four moments of return                                                                                  1.02

                                                                                                                                      asset value
                                                                                                                                                                                      Observed
       term structure.                                                                                                                                                   1

                                                                                                                                                                       0.98

     Our tool for analyzing options is Multi-Variate Variational Calculus:                                                                                             0.96

     • The pair of optimal functions being sought are the hedge-ratio and expected                                                                                     0.94
       attempted replication cost as a function of the underlying. The functional                                                                                      0.92
       being minimized is the conditional wealth change variance.                                                                                                             0           21      42       63          84     105         126   147
                                                                                                                                                                                                          trading days
     • An explicit articulation of the optimal hedging strategy at each time-step
       enables an ex-ante assessment of residual risks.                                                                                                                           1

                                                                                                                                      probability density (centered)
                                                                                                                                                                               0.1
     We infer Option Risk Premiums by comparing price with conditional
     Expected Costs of Attempted Replication.
                                                                                                                                                                              0.01
                                                                                                                                                                                                                   std dev

                             C          =       G− Wh                   +         W           Expected                                                                    0.001
                                                                                             Replication
                         option-price       expected replication cost       risk − premium                                                                                                                              down
                                                                                                Cost
                                                                                                                                                                                                                        std dev
                                                                                                                                                                         0.0001
                                                                    h
                         G : option payoff                     W : hedge P & L                                                                                                                             tail-loss
                                                                                                                                                                        0.00001
                                                                                                                                                                                      -50 -45 -40 -35 -30 -25 -20 -15 -10 -5      0   5    10 15 20
                                                                                                                                                                                                  attempted replication P&L ($)
Any stock, options or futures symbols displayed are for illustrative purposes only and are not intended to portray recommendations.                                                                                                                   9
Inference of Option Risk Premium
    Expected P&L of Attempted Replication                                                         Attempted Replication P&L Fluctuations
                                                                                                  Irreducible uncertainty arount attempted replication cost:    W

      W          =      C           −       G− Wh                                                 Risk-Capital (Q) at confidence level ps :                    Probability   W   −Q = pS
                                                                                       Expected   Attempted P&L replication standard deviation:
risk − premium       option-price       expected replication cost                                                                                                W
                                                                                   Replication
                                                                                                                                                                 −
                                                                                         Cost     Attempted P&L replication downside standard deviation:          W

G : option payoff                       W h : hedge P & L

      Option Price Implied Risk Premium Metrics
                                                              −                W
                                         Sortino Ratio:           =     −
                                                                         W         T
                                                                               W                  By quantifying the distribution of possible replication
                                    Information Ratio:              =                             costs the price of an option implies a metric of expected
                                                                           W       T              return per unit risk.
                                                                               W
          Rate of Expected Return on Capital:                       = ln         +1 / T
                                                                               Q

                                                                                                                                                                                 10
Sample Inference of S&P 500 Index Option Risk Premium
                                                                                                  Comparison of an option bid-price with expected
                                                                                                  replication costs provides an estimate of the option-
                                                                                                  seller’s expected P&L. The expected P&L when
                                                                                                  compared to the replication-cost distribution
                                                                                                  reveals the option’s risk-return profile from a
                                                                                                  seller’s perspective.

                                                                                               Sellers Rate of Expected Return on Risk Capital
                                                                                                                           W
                                                                                                                 ln          +1
                                                                                                                           Q
                                                                                                    (T ) =                                  (1/year)
                                                                                                                            T
                                                                                                   W = Bid Price - Expected Attempted Replication Cost
A sample snapshot is shown from February 11, 2019
of the estimated risk-return profile of an option seller.                                       Q = Risk Capital

                                                                                               T: duration of derivative (years)
                                                                                                                                                       11
            Any stock, options or futures symbols displayed are for illustrative purposes only and are not intended to portray recommendations.
Risk-Neutral Approach?
   What does the risk-neutral approach mean in the presence of
   irreducible risks and associated risk-premiums?

                        Unique             EXPECTATION OF OPTION PAYOFF
OPTION PRICE =        Replication     =
                                           UNDER RISK NEUTRAL MEASURE
                         Cost

   ❖ What is the meaning of the option price fitted probability measure in the
     presence of risk premiums?

   ❖ Can fitted risk-neutral measures accommodate risk-premiums?

                                                                                 12
Risk-Aware Approach vs. Risk-Neutral Approach?
t =0                       t =T                    Risk-Aware Approach:
                                                                                                                                    E GsT − G sT
                                                          : Hedge ratio                         Optimal Hedge Ratio:      opt   =             2
                                                                                                                                              sT
                                                         G: Option payoff
                                                                                                                                               ( E Gs            − G sT )
                                                                                                                                                                             2
                                                          W : P&L                        Irreducible P&L Variance:                                          T
                                                                                                                           2
                                                                                                                            W min    =   2
                                                                                                                                         G   −                   2
                                                                                                                                                                 sT

                                                                                                                                     ( sT − s0 )
                                                          Expected
                                                                                       Expected Replication Cost:          =G−               2     (Gs  T       − GsT   )
                                                                                                                                             sT
                                                          Replication                                                                                 1/2
                                                            Cost                                  Model Option Price: C = +                  2
                                                                                                                                              W min

Discrete State Static Hedging                                                Risk Premium

               Expected
       Replication Cost:

                                  pˆ i = pi   1−
                                                   ( sT − s0 )( si − sT )
                                                                2
                                                                sT

Model Option Price:

                                                                                             2 ( E GsT − G sT ) ( pi si − pi sT )
         Unique              pi = pˆ i + pi ; pi =                      2 pi ci − 2 pi G −                    2
        Replication                                  2     W min                                              sT
           Cost
                                         Risk-Neutral Measure: Existence & Uniqueness                                                                                       13
Two-State Single Period Hedging: The Trivial Case

                                   Two-State Perfect Static Hedge Numerical Example.
                    The expected attempted replication cost can be represented as an expectation under a risk-
                    neutral measure without any change in expected value for an investment in the underlying.
                    The hedge ratio is independent of real-world probability and the residual risk is eliminated.
                                                                                                      14
Three-State Static Hedging Examples
                         Three State Static Hedging Example.
                         The expected attempted replication cost can be
                         represented as an expectation under a risk-
                         neutral measure without any change in expected
                         value for an investment in the underlying.
                         Assuming the option prices to be the expected
                         hedging costs plus a homogeneous fraction of
                         the irreducible P&L standard deviation, they can
                         also be represented as an expectation under a
                         risk-neutral measure without any change in
                         expected value for an investment in the
                         underlying. The optimal hedge ratio and risk-
                         neutral probabilities are functions of real-world
                         probability and the irreducible risk is not
                         identically zero – unlike the special two-state
                         asset afforded. Under heterogeneous risk
                         premiums one fails to find a risk neutral measure
                         that fits the option price and render an
                         investment in the asset to be static under
                         expectations.

                                                                     15
Four-State Static Hedging Examples

                      Four State Static Hedging Example.
                      The expected attempted replication cost can be
                      represented as an expectation under a risk-neutral
                      measure without any change in expected value for
                      an investment in the underlying. Assuming the
                      option prices to be the expected hedging costs plus
                      a homogeneous fraction of the irreducible P&L
                      standard deviation, they can also be represented
                      as an expectation under a risk-neutral measure
                      without any change in expected value for an
                      investment in the underlying. The optimal hedge
                      ratio and risk-neutral probabilities are functions
                      of real-world probability and the irreducible risk
                      is not identically zero – unlike the special two-
                      state asset afforded. Even under a homogeneous
                      risk premium the implied risk neutral measure is
                      not unique.

                                                                       16
Risk Aware vs. Risk Neutral
Risk Aware Treatment of Options
▪ One finds that most option contracts involve hedge slippage that is at least the same order of magnitude as the average
  attempted replication cost.
▪ A risk aware paradigm enables interpreting option prices in terms of expected attempted replication costs and risk
  premiums.

Risk Neutral Treatment of Options
                                                    • Historical Mistake
▪ Fitted risk-neutral probabilities, as such, do    • Facilitates Heist of Risk-Capital
  not shed light on risk premiums.                       - OTC derivatives warehoused without commensurate risk capital
▪    On account of irreducible risks, a unique          - Periodic uncontrolled blow-ups
    risk-neutral probability measure fails to       • Dysfunction due to a confluence of unrealistic Financial Economics,
    exist.                                            “Physics,” and “Mathematics”

            “Doubt is not a pleasant condition, but certainty is absurd.”
                                                                Voltaire                                           17
Risk-Return Awareness

                                              Five Cardinal Characteristics of SPX Index Options

                                           1. Disparity Between Out of the Money Puts and Calls
                                           2. Asymmetry Between Buyer and Seller
                                           3. Exploding Asymmetry at Expiry
                                           4. Exploding Asymmetry with Out-of-the-Moneyness
                                           5. Elements of Timing (recognizing Volatility environment)

These materials do not constitute an offer to sell or a solicitation of an offer to buy securities. Please see “Important Disclosures” regarding the data and information contained and the views and opinions
expressed in this material.                                                                                                                                                                                      18
Volaris Strategy Design-Execution

        Emphasis
                                                     Volaris Research           Market Data                 Portfolio Monitoring
▪   Focus on Human Learning
                                                  Risk-Aware-Approach
▪   Data Driven Real World Analysis

▪   Clearly Articulated Models

▪   Awareness of Asymmetry of Options           Cardinal Characteristics        Liquidity Characteristics          Cardinal Characteristics
▪   Efficient Computation
                                                      Strategy Goal
▪   Real-Time Option Risk-Return Articulation

▪   Articulation of Risk Preference/Aversion
                                                   Strategy Template
▪   Simple Instruments
                                                                                                                     Strategy Template

▪   Well Defined Risk Profiles
                                                                           Strategy Details

▪   Intelligent Automation
                                                                                                   Execution

                                                                                                                                   19
Contacts & References

                                      Vivek Kapoor
                                          CEO/CIO
                                  vivek.kapoor@volariscapital.com
                                          1-973-379-0600

                                  Margaret Sundberg
                                      Portfolio Manager
                               margaret.sundberg@volariscapital.com
                                          1-973-379-0604

References:
➢ https://ssrn.com/abstract=3761304
➢ Research (volariscapital.com)
                                                                      20
Important Legal Information and Disclosures
Volaris Capital Management, LLC is not affiliated with Interactive Brokers LLC, or any other FINRA broker-dealer
This material has been prepared by Volaris Capital Management LLC (“Volaris”) on the basis of publicly available
information, internally developed data and other third-party sources believed to be reliable. Volaris has not sought to
independently verify information obtained from public and third-party sources and makes no representations or warranties as
to accuracy, completeness or reliability of such information. All opinions and views constitute judgments as of the date of
writing without regard to the date on which the reader may receive or access the information, and are subject to change at any
time without notice and with no obligation to update. This material is for informational and illustrative purposes only and is
intended solely for the information of those to whom it is distributed by Volaris. No part of this material may be reproduced
or retransmitted in any manner without the prior written permission of Volaris. Volaris does not represent, warrant or
guarantee that this information is suitable for any investment purpose and it should not be used as a basis for investment
decisions. This material does not purport to contain all of the information that a prospective investor may wish to consider.
This material is not to be relied upon as such or used in substitution for the exercise of independent judgment. Past
performance does not guarantee or indicate future results.
This material should not be viewed as a current or past recommendation or a solicitation of an offer to buy or sell any
securities or investment products or to adopt any investment strategy. The investment views and market opinions/analyses
expressed herein may not reflect those of Volaris as a whole and different views may be expressed based on different
investment styles, objectives, views or philosophies. To the extent that these materials contain statements about the future,
such statements are forward looking and subject to a number of risks and uncertainties. All images are for illustrative
purposes only.                                                                                                      21
You can also read