WE Must DO BETTER Child and Family Poverty on Prince Edward Island
←
→
Page content transcription
If your browser does not render page correctly, please read the page content below
WE Must DO BETTER
Child and Family Poverty on Prince Edward Island

  Eighth Annual Report on Child and Family Poverty on Prince Edward Island – 2021,
 MacKillop Centre for Social Justice and PEI Coalition for a Poverty Eradication Strategy
                                  November 24, 2021

                                            1
INTRODUCTION

As we prepare for this year’s report card, housing is one of the main issues on the minds of many
Islanders. The COVID-19pandemic intensified an already brewing problem of a shortage of housing. The
pandemic brought a wave of demand for houses from buyers across the country and beyond. The
situation escalated the price of houses, increased the cost of rent and the COVID-19 inflated the cost of
building supplies. These circumstances together increased the cost of living especially in housing. The
cost of food and fuel increased at the same time affecting those below the poverty line including front
line workers who in spite of the essential services they perform, find themselves below the poverty
thanks to low wages. They deserve better treatment and more thanks as they endeavor to perform key
services for all of us. As we approach the end of a second full year of the COVID-19 Pandemic, we realize
that much more has to be done to overcome existing inequality and that we need to keep moving
forward in that direction. Let injustice give way to Justice.

Situating Child Poverty

The National Child Poverty rate for Canadian children between 0 and 17 dropped a full point from 18.6%
in 2018 to 17.6% in 2019 according to the Low Income Measure (LIM). In 2019 there were 1,308,610
children in poverty in Canada.

The overall child poverty rate for PEI declined by one percentage point from 19.4% in 2018 to 18.4% in
2019, but remained 0.8% above the national average. There were also 200 fewer children ages 0 to 17,
in poverty in 2019 in PEI.

Lone parent families make up 42 percent of the families in poverty in 2019. Of the 5,380 children ages 0
to 17 in poverty in this province, 1,670 are in families with at least one child below 6 years. Since the All-
party resolution in the House of Commons in 1989 to eliminate child poverty in this country by the year
2000, we have fallen behind. Poverty has continued to rise and is still above the 1989 level of 15.3%.

On PEI the overall poverty rate in 2019 was 16.8 percent, 0.1% less than 2018.

The rate for children under six years is 19.2%
The rate for Children 0 -17 is 18.4%
The rate for adults 18-64 is 16.6%, an increase of 0.3% over last year
The rate for adults 65 and older is 16%, down 0.4 percent from last year

The following graph of the child poverty rate in Canada and PEI from the year 2000 to 2019 reveals just
how slow poverty eradication has been in the last 20 years. The PEI line is practically flat except for a
few small declines and increases. In spite of the advent of the Canada Child Benefit (CCB), this snail’s
pace has brought the Canadian rate down by only 6.5 percentage points. In both cases, the numbers are
excessively high. Since the All-party resolution in 1989, very good and workable suggestions were made
by Campaign 2000 and others on ways to eliminate poverty. This work continues with some progress
made, especially on the federal plan to reduce childcare costs to $10.00 per day and the Canada Child
Benefit, to name just a couple. Since 1989 and earlier, children in poverty in Canada have been asked to
bear an unacceptable amount of suffering accompanied by health consequences and lost opportunities.

                                                      2
We cannot continue to accept or tolerate this situation. The struggles of low-income children are many.
Why should some children have fewer opportunities in life than others?

Campaign 2000 measures poverty using the CFLIM-AT, defined as 50% of median income for a particular
family size calculated with tax filer data because it is more inclusive and correlates more highly with
health status and challenges in child development. It is defined as 50% of median income for a particular
family size. CFLIM-AT is a relative measure of poverty, which tracks changes in living standards and
compares living standards of individual low-income families to that of the rest of society. It is calculated
using data from the T1 Family File (TIFF) tax file. It is a reliable source of annual income that includes
communities with a high prevalence of poverty such as populations of the Territories, First Nations
Peoples living on reserve, those living in institutions, and parents under 18.

According to the 2019 LIM data, the overall rate of poverty for 2019 is:

All ages – 16.8%
Children 0 -6 years – 19.2%
Children 0-17 – 18.4%
Adults 18 – 64 – 16.6
Adults over 65 – 16%

                                                     3
Little Progress
The 2019 figures reveal just how little progress has been made to eradicate poverty at its root causes.
Instead, we keep falling behind. We know that poverty is structural, the result of economic and political
structures and the way they create inequality. When profits come before people, little progress is except
that the rich get richer and the poor get poorer. That seems to be the Canadian way.
In comparison to the other provinces and territories, the 2019 data shows that PEI has the smallest
depth of poverty rate for single parents with one child and single parent families with two children. For
single parents with one child, Newfoundland is a close second with a yearly total of just $215.00 higher.
There are seven provinces and territories as well that have smaller depth of poverty gaps than PEI for
couples with one child. Alberta is a close second with a yearly total of just $60.00 higher and the
Northwest Territories is tied with PEI.
Seven provinces and territories have smaller gaps for a couple with two children.
The upward trend in child poverty that happened on PEI in 2018 has reversed slightly in 2019 by one
percentage point while some provinces experienced an increase in 2019.
Over the 20 year span, some provinces experienced significant drops in the child poverty rate. While
Nova Scotia and New Brunswick had similar levels of gaps to PEI, notable declines occurred in provinces
and territories: Newfoundland and Labrador and B.C. each a 9 point drop from 30 to 21; Quebec a 7
point drop; Saskatchewan and Alberta each an 8 point drop; and Yukon surpassed all provinces and
territories with a drop from 25 to 12%, more than 50%.
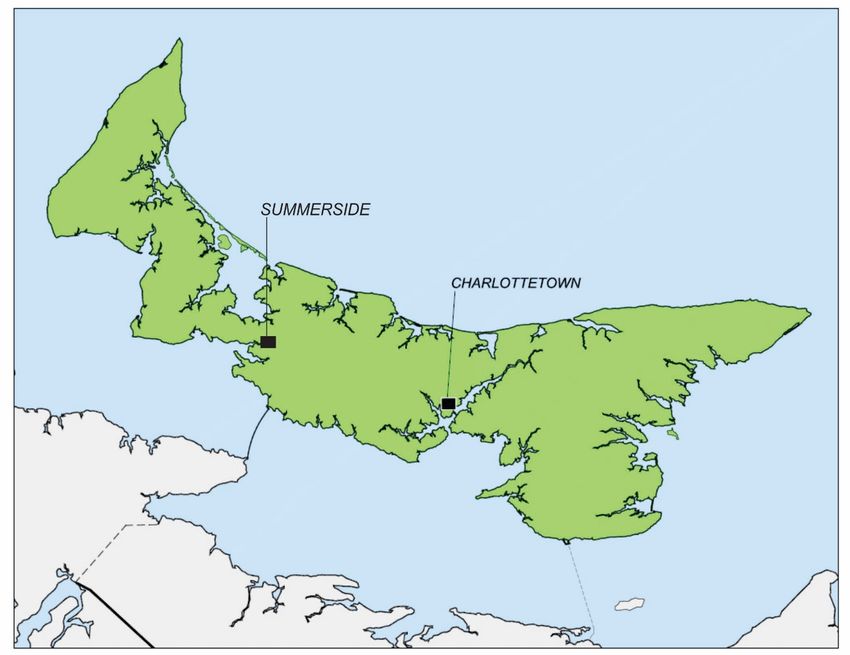
Geographical Areas of PEI.
Most PEI communities have small populations so the number of children in poverty is often more
significant than the percentage. Where the overall population is small, a few people moving in or out of
the community can make a significant difference in the percentage rates.
The city of Charlottetown continues to have the highest rate of child poverty in the province.
Charlottetown Overall Child Poverty Working Age 18 – 64 Seniors - over 65 years
22.8% 25.3% (1600) 24.4% 15.7%
Summerside Overall 18 – 64,
18.4% 21.1% (600) 17.7% 17.6%
Other communities with sizeable populations of children in poverty include:
Coleman, 70 children below the poverty line - a percentage of 36.8%
Montague town, 300 children - a percentage of 27%
O’Leary, 140 - 24.5%
Lennox Island, 100 - 25%
Lot 12, 140 - 28.6%
4Lot 5, 240 - 20.7%
On the other hand, many smaller communities with smaller numbers of children have high percentages
of children in poverty. For example, North Rustico with 30 children in poverty has a rate of 37.5%.
Communities with larger numbers of children in poverty but lower percentages include:
Stratford, 330 - 14.3%
Cornwall area, 190 - 12.9% and Cornwall town, 160 - 11.9%
Souris West, 130 - 16.3%
Kensington, 160 - 15.4%
Hunter River, 110 - 15.7%
Child Poverty and general poverty by County and Federal Ridings – election districts
Place name - Nom de localité All Ages 0-17 18-64 65+
# % # % # % # %
CENSUS DIVISION
KINGS 3380 19 670 20.9 1980 18.5 730 18.6
PRINCE 7540 15.8 1680 18.4 3950 13.9 1910 18.5
QUEENS 14430 17 2980 17.9 9210 17.6 2230 13.9
FEDERAL ELECTION DISTRICT
CARDIGAN 6600 15.8 1420 16.8 3940 15.7 1250 15.2
CHARLOTTETOWN 8550 22.8 1600 25 5760 24.4 1190 15.7
EGMONT 6110 16.6 1360 19.4 3200 14.7 1560 19.3
MALPEQUE 4090 11.9 950 13.3 2260 10.8 880 13.5
There are two important points of note in the graph below. The high rate of child poverty in
Charlottetown is almost matched by the high rate of poverty for persons of working age. Secondly, the
rate of poverty for seniors in Charlottetown in the lowest of the three counties.
5The graph below places the poverty rate in Kings County above the overall poverty levels for all ages on
PEI and the highest percentage is for children. Senior poverty has increased in Kings and Prince but not
in Queens where it is below the overall rate of poverty for Island seniors.
Social Assistance
There is very little information available on Social Assistance for this year as the departmental annual
report is not completed. Figures from 2018 and figures from 2020 are the only gauges we have. It is
encouraging to know that there have been some small changes and improvements over the last 11
months. However, there were significant food increases in 2020, shelter increases earlier in the year as
well as a number of rate increases in August and in October this year. These include Vision and Optical
coverage, School Allowance, Funeral Coverage, Pregnancy Food Allowance, and Living with parents or
relatives shelter rates. We won’t know the exact amounts until the release of the Annual Report.
Although the graph below shows that the rate of child poverty on PEI in 2019 is the lowest in Atlantic
Canada at 18.4%, all Atlantic Provinces have rates above the National level. Nunavut has the highest rate
of child poverty in Canada and Manitoba is a close second. Nova Scotia has the highest rate in the
Atlantic region.
Employment Insurance is an important poverty reduction tool
The PEI economy and the economies of the Atlantic region are seasonal and Employment Insurance (EI)
is very important for the large number of seasonal workers. In Canada, prior to the pandemic, only 40%
of unemployed individuals were eligible for EI benefits. i The benefit rate is at its lowest since the
introduction of the program 80 years ago, at 55% of wages.
6EI plays important roles, in the lives of workers. Basically, it is an insurance to cover workers should they
lose their job. It includes large-scale stabilization at times of labour market or economic upheaval. It also
plays a critical role in the lives of individuals and families and is essential for seasonal workers. Lessons
learned from CERB and the CRB experience can help to reform EI in order for it to function better as a
poverty reduction tool. Reforms include making permanent the $500 weekly benefit floor introduced
during the COVID-19 pandemic and increasing the benefit rate to 70% of wages.
Reforms are needed to increase access for more workers. Qualifying requirements should be lowered to
360 hours or 12 weeks, punitive disqualification rules need to be eliminated, and EI should be made
accessible to all migrant workers and misclassified contract workers. There are 2 EI zones on PEI. This
makes little sense. Workers have been lobbying M.Ps to have PEI placed back to one zone but that
hasn’t happened yet.
Chart 2: Child Poverty Across Canada, Children under 18
21.0%
11.8% 18.4%
23.1%
34,4%
21.7%
24.3%
18.0%
16.0%
26.1%
28.4%
13.9%
Canada’s Na�onal Rate of Child
17.6%
Poverty (Under 18): 17.7%
Below Na�onal Rate
Above Na�onal Rate
Source for CFLIM_AT data: Statistics Canada Table 11-10-0018-01. After-tax income status of tax filers and dependents based
on Census Family Low Income Measure (CFLIM-AT), by family type and family type composition, 2019.
Depth of Low Income for Poor Families in Prince Edward Island, 2019
Statistics Canada defines the average poverty gap ratio as the dollar amount a household income is
below the poverty line, expressed as a percentage. When the gap increases, the depth of poverty also
increases which means that children live in deeper poverty. When we compare the 2019 depth of
poverty figures with those of 2018, we find that depth of poverty is increasing on PEI. Most family
categories lost ground over the past year.
7- The income of a single family with one child increased by $360.00, but the gap increased from $9,097
in 2018 to $9,705 in 2019, or by $608.00.
- A lone parent family with two children had a gap of $9,476 in 2018. This family’s income increased
by $1,120 in 2019 to $9,542 but the gap increased by $66.00.
- A couple with two children received an increase in income in 2019 of $480.00 over 2018 figures,
from $32,970 to $33,450 but the gap increased by $890.00.
- A couple with one child was the only category that gained on PEI in 2019. Their income increased
over the same period by $2,160 and the gap in this case decreased from $12,456 to $11,482, an
improvement of $974.00.
Three of the four family categories lost ground between 2018 and 2019 and sank further into poverty. If
we compare these figures to the National level, the depth of poverty for a single parent with one child is
larger at a national level than that of a comparable PEI family. The same is true for a single parent with
two children. The gap for a couple with one child as well as for a couple with two children is higher in
PEI.
Child Care
All of the people who worked for a more just, equitable childcare system rejoiced at the federal
government’s announcement in the 2021 federal budget of a $10.00 a day daycare plan. Prince
Edward Island was one of the first provinces to endorse the plan, which needs to cover and give
access to all families, indigenous and others including newcomers and children with disabilities. It must
8be thoroughly inclusive. The new plan comes into effect more than a year from now so there is time
for people to offer suggestions to assure the highest possible quality. Provincial and Territorial
governments must all work with the federal government to ensure that this program is available
for all children. Service delivery must be equitably distributed to ensure that people in need can
benefit and that rural areas have access. The plan is an important step in strengthening the Social
Safety Net.
Housing
In 2021, PEI housing sales hit record highs. Overall housing prices were up 27% compared to 2020. Prices
of houses rose considerably more in Charlottetown and Summerside. The median price for a house in
Charlottetown is $340,000 at last count. In Summerside, the median price of a house is $312,500, up
39.5% more than the third quarter of 2020 and heavy demand continues. Houses on the North and
South shore of the province were up 24.8%. Sales appear to be declining somewhat in the 4th quarter as
the price of lumber is beginning to go down closer to pre-COVID prices. Housing continues to be in short
supply and prices continue to rise in spite of builders receiving forgivable loans of $55,000 per unit.
Advocates believe that the affordable housing rate should be set at 25% of income including the
minimum wage in order to accommodate the needs of low-income families. The price should include
utilities. Current prices are way beyond that level. The provincial government also needs to broaden
eligibility programs for those in need and tenants should play more of a role in decision-making. The
root of these problems goes back to 1993 when the Chretien government froze federal funding to new
social housing projects including supports for smaller non-profit and cooperative housing projects.
The already tight housing situation in Charlottetown and elsewhere in the province was exacerbated by
the COVID-19 pandemic, which caused lumber costs to soar and other materials to hit all time highs.
There is also a shortage of skilled people in housing construction. In spite of COVID-19, developing
housing problems should have been anticipated and fixed years ago.
On top of this, a substantial development of Short Term Rentals (STRs) took place in Charlottetown. This
development is particularly difficult for people in poverty, international students and out-of-town
students who are kicked out of their apartments after 8 months to make room for tourists seeking
(STRs). Women fleeing abuse, and people of colour are also hard hit. STRs definitely contributed to the
housing shortage and the rise in housing costs.
On November 9, the Charlottetown City Council sponsored a third public meeting to give residents a
chance to respond to its proposed short-term rental (STRs) restrictions. The key changes would mean
that a STR could only operate in a dwelling under the condition that it is the host’s primary residence.
Council would also allow for secondary garden suites as long as the host is living in the home during the
stay. These changes would prevent vacancies in Charlottetown that are reserved for visitors only. It
would also eliminate renavictions – tenants evicted under the guise that the dwelling is going to be
renovated and the renovations can’t happen if the tenant is living there. Student rentals in danger of
renaviction after 8 months only.
PEI has arguably the lowest wages in Canada so the cost of housing is now way beyond affordability for
many people. Participants pleaded that: prices are at a terrifying level; repairs could triple what people
usually pay; the affordable housing monthly rate of close to $1,400 does not include heat, lights, cable,
9internet, and other. They stated that people cannot afford to live here and cannot afford to stay here, so
they have to go elsewhere.
Tenants raised the problem that part of the housing shortage is caused by people wanting to maximize
profits by operating Short Term Rentals (STRs). They reminded City Council that the gap between rich
and poor has never been larger, that more and more workers are being forced to go to food banks and
that more people are being marginalized. They stated that owners of STRs should be assured a fair
return, not a maximum return. One participant stated that she was renavicted 4 times in 4 years. Other
speakers complained about being renavicted more than twice in five years and others were renavicted
more frequently. A spokesperson for non-profit housing stated that the problem is getting worse. His
new building, which offers a sliding scale for rent, is full and there are already 300 people on his general
waiting list. One person stated that some low-income people are paying as much as 60 to 70 percent of
their income on housing with the money going directly into the pockets of the owners. She asked why
the city is being held hostage by STRs and called the situation terrifying because landlords are holding
empty apartments all over town for tourists wanting STRs. One person of colour quoted a line of poetry
which she felt described the situation of housing in Charlottetown “There ain’t no love in the heart of
the City.”
People asked that owners go back to their roots and serve the needs of the people for affordable
housing. In all of this, racialized people have the hardest time.
The Confederation Centre, which holds one of the best-known summer Festivals in Canada, is bringing
back the popular Anne of Green Gables stage production after a 2-year absence due to COVID-19. It
usually finds accommodation in the city for the actors who come from across Canada. A spokesperson
stated that this year they could not find accommodation because of shortage of rental space brought on
by STRs. Some actors state that they cannot come because they cannot afford accommodation costs in
Charlottetown and that they will have to go elsewhere. This was not an issue five or so years ago.
University students stated that they have to vacate their apartment after 8 months to make room for
STRs. They want year round housing. They would like to stay and work in the province during the
summer months to help the economy but they cannot find places to live.
PEI has one of the tightest housing markets in Canada. The vacancy Rate improved somewhat over the
past year but there were fewer students looking for apartments due to COVID-19 restrictions.
Homelessness has increased.
While only 83 residents are licensed to operate STRs in the city, over 400 have advertised their
properties on line, illustrating the lack of regulation in the city and province. Other participants talked
about seeing tents along walking trails where people who are renavicted in the spring have to live
because they can’t find affordable housing. After a speaker from the STR organization gave a
promotional speech on zoom from Toronto about the benefits of STRs, one participant reminded the
council that, “we are a community, not a tourist attraction.”
Participants recommended controls on the cost of housing and that STRs be transformed into long-term
rentals, with more regulation, a registry, and a way to enforce regulations. Most endorsed the City
Council’s recommendations and recommended more affordable public housing, more non-profit and
cooperative housing.
10There was a recognition that STRs are part of the housing problem, not the whole story.
The Office of the Director of Rental Property stated in its 2020 Report that it issued a record 531 orders.
The Rental Office adjudicated a high volume of disputes, receiving 666 applications for dispute
resolution from tenants, up from the previous year by 56. The Commission set an allowable rent
increase of 1.3% for 2020 and 1% for 2021 www.irac.pe.ca/rental (FN). In addition, there were 10,644
inquiries, up from 10,168 the previous year.
On November 17, the provincial Legislature passed a motion by the Green Party for a 2-year moratorium
on renavictions. There is a clause in the province’s tenancy legislation which allows landlords to evict
tenants in order to conduct renovations to properties which they claim cannot be done unless the
tenant moves out. This has caused hundreds of tenant evictions from properties that are then turned
into STRs. The new housing legislation comes into effect in March of 2022 but cases under dispute at the
moment are said to be protected in the new legislation. Two amendments to the legislation were
attached and there is fear that they may weaken the original motion.
Living Wage.
In 2020, our coalition cooperated with the Nova Scotia Office of the Canadian Centre for Policy
Alternatives to establish a Living Wage for PEI. The research, led by Dr. Christine Saulnier, calculated
shelter costs at $1,398.06 monthly in 2020. This report has not been updated yet but costs would have
increased because of what is happening in housing. The latest estimate places affordable rent at close to
$1,400 monthly. In order to accomplish a Living wage for PEI last year, workers would have had to
receive an hourly wage of $19.30 to provide a small cushion above the poverty line, based on needs of a
couple with two children with both parents working full time for 35 hours a week. The minimum wage
on PEI has since risen to $13.00 per hour and will increase to $13.70 on April 1, 2022. This is still very
different from the required $19.30.
Market Basket Measure – Official Poverty Measure
The Market Basket Measure (MBM) was declared the official poverty measure in Canada in 2019. It was
entrenched into legislation in June 2019 when the Poverty Reduction Act (PRA) came into effect.
Campaign 2000 points out that the MBM measures material deprivation by establishing a low-income
threshold by means of costing out a basket of goods and services that an individual or family would need
to purchase to have a ‘basic’ and ‘modest’ standard of living in a particular geographic region. It uses
five categories: food, clothing, shelter, transportation, and a category of other essential items. Families
with a disposable income that is less than the threshold for their region are considered to be living in
poverty.
As the Campaign 2000 report points out, the MBM data source is the Canadian Income Survey. This
survey uses a smaller sample size so is subject to more sampling error. It excludes many populations
with higher poverty rates such as people living in the territories and on First Nations. In addition to this
exclusion is the subjectivity of what goes into the baskets and what is considered a ‘basic’ standard of
living. This type of calculation results in lower poverty thresholds and the subsequent “invisibilizing” of
child poverty, in particular the poverty of Indigenous children with the use of the MBM (Frankel and
Sinclair, forthcoming).
11Both measures capture different aspects of poverty and in both cases present a partial picture of
poverty. Adjusting the CFLIM to 60% of the median income is aligned with the metric used by the
European Union, enabling international comparisons.
Number and Percent of Children in Poverty, MBM and CFLIM-After Tax, 2015-2019
Source for CFLIM_AT data: Statistics Canada Table 11-10-0018-01. After-tax income status of tax filers and dependents based on Census Family
Low Income Measure (CFLIM-AT), by family type and family type composition, 2015-2019.
Source for MBM data: Statistics Canada. Table 11-10-0135-01 (formerly CANSIM 206-0041), CIS Table 2-Persons living below the poverty line
(market basket measure), 2015-2019.
Figure 1: Census Family Low Income Measure, After-Tax 2019 Thresholds by Family Type
Family Type CFLIM-AT ($)
Single person (no child) 22, 518
Lone parent with one child 31,845
Lone parent with two children 39,002
Couple with one child 39,002
Couple with two children 44,036
Source: Statistics Canada, Table G. 2019 Threshold for After-Tax Census Family Low Income Measure, Technical Reference Guide for the Annual
Income Estimates for Census Families, Individuals and Seniors. T1 Family File, Final Estimates, 2019.
The following graph illustrates the difference between poverty rates as measured using the Low Income
Measure and the Market Basket Measure. In 2018 Child poverty as calculated by the MBM measure is a
full 7.4% lower than the LIM and 8% lower in 2019. This makes an enormous difference. It begs the
question, what happens to all the people who are not counted as below the poverty line? What happens
to the children in poverty who are left out of the proposals?
The following graph illustrates the differences between the MBM and the LIM. It suggests that groups
favouring the MBM should take a second look at the inequalities. In PEI the differences are similar.
12Canada: Market Basket Measure vs Low Income
Measure, change in child poverty rate between 2018
- 2019
20
18
16
14
Percentage (%)
12
10
8
6
4
2
10.8 9.7 18.2 17.7
0
MBM LIM
Child Poverty Measure
2018 2019
It is imperative when calculating the extent of poverty on PEI that the differences in poverty measures
be taken into account. We concur with the following resolution by Campaign 2000 to
Replace the Market Basket Measure, which measures material depravation, with the Census
Family Low Income Measure After Tax, calculated with annual tax filer data (CFLIM-AT) as the
Official Poverty Line. The Low Income Measure is a more comprehensive indicator of all aspects
of poverty. Increase the CFLIM-AT thresholds to reflect 60% of the median income to cohere
with global standards, such as those used by OECD and UNICEF.
This resolution is very important given the number of children in poverty who are left out of the
poverty calculations. Their existence needs to be taken into account in order that they can access
programs to alleviate their poverty. The difference between the numbers of children in poverty in
PEI and in Canada as calculated by the MBM are substantial. These differences must be made up by
using a more accurate measure.
The following graph shows clearly that Islanders are at a disadvantage with the MBM measure.
13Prince Edward Island: Market Basket
25 Measure vs Low Income Measure,
change in child poverty rate between
20
2018 - 2019
Percentage (%)
15
10
5
9.8 13.7 19.4 18.4
0
MBM LIM
Child Poverty Measure
2018 2019
The graph below shows that of all low- income families on PEI, lone parent families are the most
numerous and outnumber couple families by 580 families.
14The Charlottetown Food Bank, Another example of the increase in poverty
The Charlottetown Food Bank has experienced an overall increase in demand for food as of October
2021 compared to October 2020, especially among households. Foodbank users increased from 1,522 in
October 2020 to 1,687 users in 2021, an increase of 165 users. The number of children using the
foodbank also increased from 540 in 2020 to 596 in October 2021. While this increase is not as dramatic
as adult use, it is part of a trend that shows how inflation and the snail’s pace of poverty eradication is
making more people desperate. Immigrants and Refugees are among the users of the foodbank because
their income is insufficient for the rising cost of food, fuel and housing. All of this illustrates a lack of
planning and effective follow up once these people arrive.
Federal Transfers
For persons under 18 years, when you remove all of the adjusted After Tax government transfers, the
number changes drastically from 18.4% to 38.1%, an increase of 19.7. In 2018, the figure was 34.7 or
3.4% less than 2019. For children under six years old, the poverty rate in PEI in 2018 was 19.2% with
government transfers. Without government, transfers the percentage would be 42.7% compared to
44.5% in 2018, an improvement of 1.8%. The overall difference in 2019 is 23.5%.
The figures on the far right demonstrate that the Canada Child Benefit is important to families with
children. It is reducing child poverty but is insufficient on its own and has to be improved and
strengthened by the rest of the social safety net. Poverty for Children under six years dropped by 2.1%
from 21.3% in 2018 to 19 2% in in 2018. The reductions in poverty are still small. Without government
transfers, the poverty rate for children under 18 would have been 38.1% and the rate for children under
six years would have been an enormous 42.7%.
15The Canada Child Benefit (CCB) has been a help to families in poverty but it has not touched the depth
of poverty or enabled the elimination of child poverty. This is because it is aimed at reducing the poverty
of families close to the poverty line and lifting them above the poverty. It leaves the poorest families
behind.
The column on Market value, is the sum of earnings from employment and net-employment, net
investment income, private retirement income, and the other items under income. It is also called
income before taxes and transfers. After-tax income is total income less income tax. Market income –
for low-income families is the sum of income earned from work. In this case, market income figures are
close to synonymous with working poor. Therefore 36.9% of Island children under 6 come from working
poor families and 33.4% of all children under 18 come from working poor families. Market income does
not include Social Assistance and it is safe to assume that few working poor families have investments.
These are alarming numbers and more serious, this situation is not improving, it is getting worse.
Source: Statistics Canada Custom Tabulation, Number and proportion of children under 6 and 18 years old in families where the
adjusted after tax income of family is below the amount of the T1FF CFLIM-AT threshold, Canada, Provinces and Territories,
2019
Distribution of income on PEI is better than the national average. However, PEI has extremes of income
inequality. The highest decile with aggregate earnings of 21.2% is higher than the aggregate of the four
lowest deciles (40%). It is also 5.6 percentage points higher than the 9th decile. All other deciles have
gradual increases except the highest one, which is considerably above the rest including the 9th decile.
16Racial inequality is growing in PEI as well as the rest of Canada. Many racialized people live in
Charlottetown where the poverty rate is highest. In addition, a number of people of colour complained
about housing shortages and problems. Indigenous people also experience higher levels of poverty both
on and off reserve. The following chart is helpful in identifying who is struggling with poverty in Canada.
Although we could not find up-to-date figures for racial categories on PEI, the following national map is
helpful in understanding the shockingly high rate of racialized poverty in Canada.
When Martin Luther King made his famous March on Washington his message was about jobs and the
need to end racial discrimination in order to give people of racial backgrounds a fairer chance of lifting
themselves from poverty. The March from Selma to Montgomery was about voting rights but also about
jobs. His message resembled the model of the Job Guarantee. He favoured decent jobs with decent pay
and working conditions but he also knew that many people were unable to work. He wanted those with
disabilities to have enough income to be lifted out of poverty and be able to live a decent life. He also
favoured fair compensation for those who were unable to enter the workforce such as caregivers. Like
the Job Guarantee, he dreamed of reaching the poorest of the poor and giving them a chance for
training and employment. These opportunities would reach the poorest parts of the country as well as
the cities and involve people for fighting for and deciding their own destiny.
17Chart 10: Child Poverty Rates, Select Racialized Groups, Canada 2016
Conclusion
Each year we lament the slowness of governments to get on with the task of overcoming child and adult
poverty. There is really no excuse. If poverty was such a mystery or such a complicated task, why are
other OECD countries doing a much better job than Canada? What is the holdup? There are effective
ways to get at the root causes of poverty and help both the victims of poverty and the whole society but
policy-makers have to admit what those causes are and back them up with sound analysis and action.
The UNICEF Report 16 points that 30 countries that are doing better than Canada with poverty reduction
and many of them are not nearly as wealthy as this country. Poverty eradication is a matter of Justice
and as many voices remind us,” Justice delayed is Justice denied.” Getting to the root causes of poverty
requires analysis and hands on evidence of what works best.
The PEI Coalition for a Poverty Eradication Strategy and the MacKillop Centre for Social Justice strongly
endorses the Campaign 2000 resolution:
• Ensure wages are adequate, and at a minimum bring employment incomes up to the CFLIM-AT.
Equal pay and benefits for all workers, regardless of employment status, gender, racialization, and
immigration status, must also be legislated.
• Introduce a pan-Canadian workforce development strategy for the Care Economy. These jobs need
to be rebuilt from the bottom up with a focus on the most vulnerable workers. In Long Term Care,
this strategy would include a new floor of enforceable minimum labour standards, better pay and
working conditions, more full-time positions, and skills development support.
18In our last two report cards we expressed our confidence in a Job Guarantee as one of the most
effective ways to eradicate poverty. One of its strong points is, in the words of Dr. Pavlina Tcherneva,
“that it is a crucial mechanism for heading off economic instability whether this stems from structural
shifts in globalization, technological change, or garden variety recessions, swelling in times of greatest
need, when prices, incomes, and private income are declining and shrinking when other parts of the
economy furnish their share of well-paying jobs… unlike other stabilizers, it has the potential to help
remake the economy.”
Another strong point of the Job Guarantee, pointed out by Dr. Stephanie Kelton, is the JG is mandatory
and therefore can’t be cut back or cancelled while discretionary income programs are subject to cuts,
and can be changed or cancelled after a few years. (See Apendix 2 for more information)
ACKNOWLEDGEMENTS
A special thanks to all who contributed to the content of this report card. The Campaign 2000 steering
committee and staff, especially Leila Saranga and Brooke Borovoy who have been enormously helpful
and generous in sharing time and information. Special thanks to Alan Meisner for his exceptional work
on statistics and graphs and his always generous availability when seeking his advice and to the
members of the MacKillop Centre for Social Justice and the PEI Coalition for a Poverty Eradication
Strategy. Thanks as well to Catherine Mullally and Patricia Power for their editing advice and to Bill Kays
for his faithful technical assistance. Thanks to Jennifer Burgess at the Department of Social Development
and Housing, Government of PEI, and many others.
Recommendations
First, we agree with the recommendation made in the 2020 Campaign 2000 Report Card.
Further, we recommend the following to the Prince Edward Island government
• That the PEI and federal governments recognize the great need for good paying, decent jobs
as a means of eliminating poverty.
• That the PEI and federal governments establish a Job Guarantee Strategy based on public
work in public service in communities, led and administered from the bottom up and financed
by the federal government, to provide decent jobs with decent pay for anyone who wishes to
work.
• That the PEI and federal governments step up their efforts to provide new, adequate,
affordable, energy efficient social housing units led by the public sector in order to assure
affordability.
• That PEI and the federal governments throw their support behind the establishment of a Universal
National Pharmacare Plan based on the same principles as the Canada Health Act, and based on the
recommendations of the Hoskins Report and that the plan is set in motion in 2022.
• Permanently amend the Canada Labour Code to ensure workers have access to ten permanent paid
sick days with an additional fourteen days available during public health emergencies.
19• Enhance the Canadian Medicare program to include pharmacare, dentistry, vision and physical
rehabilitation services.
• That the PEI government continue to make investments in delivery of programs that assure
affordable, nutritious food to children in the schools and in communities.
APPENDIX 1
Here we repeat many of the important recommendations made in the national child poverty
report
• We ask the federal government to: Commit to a 50% reduction in poverty between 2015 and 2025
and eliminate poverty by 2030 based on the Census Family Low Income Measure, After Tax CFLIM-
AT calculated with T1 Family File data. These targets and timelines should be the same for
marginalized groups who experience higher rates of poverty, including First Nations, Inuit, Métis,
urban and rural Indigenous Peoples, Black and racialized people, people with disabilities,
immigrants, and people in female-led lone-parent families, as requested in the National Report card,
2021.
• That the federal government increase the Canada Child Benefit (CCB) allocations in Budget
2022 to enable all families below the CFLIM-AT level to access CCB pandemic top-up amounts.
Moreover, in combination with a Dignity Dividend of $1,800 per low income person and child,
achieve an interim target of 50% reduction in child poverty by 2025, as measured by the
CFLIM-AT calculated using tax filer data.
• Further to eliminating 50% of poverty by 2025, the federal government must eliminate
barriers to accessing the CCB Benefit for families living at higher rates of poverty, i.e. First
Nations families living on reserve, children whose parents have irregular immigration status,
Black and racialized families, children with disabilities, and women experiencing domestic
violence.
• Ensure that preventing food insecurity among families is a built-in goal of the Canada Child
Benefit and ensure it is reported on as part of Canada’s Poverty Reduction Strategy.
• Convert the Disability Tax Credit to a refundable tax credit and extend compensation to the
lowest income people with disabilities.
• Increase funding to the Canada Social Transfer (CST) by $4 billion and remove arbitrary growth
restrictions as first steps towards ensuring that social and disability assistance programs bring
incomes up to the CFLIM-AT. Provide sufficient, stable and predictable funding that recognizes
regional economic variations. Design the program to ensure that federal, provincial and
territorial governments are accountable for meeting their human rights obligations to provide
adequate income support and require the development of minimum standards for income
benefits and social services funded through the CST. This must include the development of
minimum standards such as binding conditions stipulating income supplements including the
CCB, Child Disability Benefit, child support payments and child related Employment Insurance
benefits are not deducted.
20• Make a binding condition on the CST that pandemic emergency benefits, be they the CERB,
the new Canada Recovery Benefit (CRB) or any other, are not clawed back from social
assistance benefits, nor negatively impact any other income benefit, including special
allowances for diet, medications, rent subsidies and others. N.B. It should be noted that the
PEI government claws back the CERB although this is a federal grant.
• Federal and provincial governments must collaborate with First Nations, Inuit, and Metis
governments and indigenous grass roots organizations to develop plans to: prevent, reduce
and eradicate child and family poverty in indigenous communities while ensuring respect for
inherent rights, treaties, title and jurisdiction; to assure full participation in economic growth,
sufficient, predictable, long-term funding for First Nations governments and institutions to
achieve well-being, and evidence-based closure of socio-economic outcome gaps by collecting
data to support measurement and reconciliation.
• Pay full compensation to the First Nations children, parents and grandparents who were
harmed by inequitable funding for child welfare services on reserve and lack of adherence to
Jordan’s Principle as well as implement The Spirit Bear Plan to end inequalities across public
services.
o Work with provinces/territories to implement operational funding of childcare programs based on
set (daily) fees on a sliding ability-to-pay scale, from $0 to a maximum of $10, replacing full user fees
and individual parent fee subsidies.
o Ensure that public planning and management bodies assume responsibility for creating and
maintaining non-profit and public childcare services. Services must be equitably located and include
low-income and high-needs communities and rural and less densely populated communities.
o Honour and fund the Indigenous Early Learning and Child Care Framework.
• That the PEI government take immediate steps to end homelessness and unaffordable rent and
housing construction by stopping renovictions and building many more public affordable housing
units across the province in recognition of peoples’ right to housing, a human right that can’t be
denied any longer.
• Take immediate action on the commitment to ending homelessness as part of Canada’s
international human rights obligations. Reassess the definition of “chronic homelessness” to capture
the experiences of women and gender non-conforming people, immigrants, refugees, and First
Nations, Inuit and Métis Peoples as suggested in the National report card, 2022.
• Create universal access to postsecondary education by eliminating tuition fees and significantly
bolster youth employment programs and apprenticeship opportunities. Create universal access to
postsecondary education by eliminating tuition fees and increase the maximum amount of support
given to low-income recipients of the Canada Student Grant. Eliminate interest paid on the federal
portion of student loans. (national report care 2021)
21• Implement post-care financial and social services to First Nations, Inuit and Métis youth who were in
child welfare and extend Jordan’s Principle past the age of 18. Reduce inflows into homelessness by
implementing a targeted housing strategy and establishing a national framework for extended care
and support for youth in child welfare, in collaboration with First Voice Advocates, territories and
provinces. (national report card, 2021)
• Implement post-care financial and social services to First Nations, Metis and Inuit youth who were in
child welfare and extend Jordan’s Principle past the age of 18. Reduce inflows into homelessness by
implementing a targeted housing strategy and establishing a national framework for extended care
and support for youth in child welfare, in collaboration with First Voice Advocates, territories and
provinces.
• Ensure that First Nations, Inuit and Metis communities co-develop food security strategies to
address their unique needs and future reconciliation efforts. As part of this, the federal government
must move swiftly to identify and implement more effective strategies to address the very high
prevalence of food insecurity among families.
• That the federal government increase the Canada Social Benefit to increase its share of funding of
universal public health care up the level of 35% as requested by the provincial health Ministers.
• Immediately implement a $15/hr minimum wage indexed annually to inflation as a first step toward
achieving a Living Wage.
• Extend emergency benefits beyond 26 weeks, lower the qualifying threshold for temporary EI
currently set at 120 hour and set a minimum guarantee (as set by CERB at $500.00 per week).
• Permanently amend the Canada Labour Code to ensure workers have access to seven permanent
paid sick days with an additional fourteen days available during public health emergencies.
• That the federal government comply with the rulings of the Human Rights Tribunal by
providing adequate funding for child welfare services on reserve, compensation to parents
and grandparents of children in care and ensure full application of Jordan’s Principle for First
Nations communities.
• That the federal government replace the absolute Market Basket Measure (MBM) with the
relative Low Income Measure – After Tax and that the MBM be adopted as a supplementary
measure to the Low Income measure
• That the federal government end immediately the division of EI on PEI into 2 zones thereby
ending the disparity that currently exists among EI recipients in this province, and that the
hours required for qualifying for EI be a uniform 360 hours across the country. It is also
necessary to eliminate some of the requirements for receiving EI and to raise the level of
benefits.
• That government co-develop indicators for material deprivation as well as health and well-
being indicators with indigenous led communities and organizations and commit a reasonable
timeframe for the development of these measures.
• That the federal government double its contribution to the Canada Housing Benefit and
continue to expand it to a universal benefit.
• That the federal government invest more dollars annually to build housing for people
suffering from physical and mental disabilities.
22• That the City of Charlottetown and the province change their public transportation systems to
electric vehicles and that they expand the existing service.
• Increase Canada Child Benefit (CCB) allocations in Budget 2022 so that all families with incomes
below the CFLIM-AT can access CCB pandemic top-up amounts, no matter the age of their children.
Invest substantially in the base amount of the CCB to ensure that it supports an interim target of a
50% reduction in child poverty by 2025 according to the CFLIM-AT calculated using tax filer data.
• Ensure government transfers are accessible: repeal legislation tying eligibility of the CCB to
immigration; expand the circle of people able to attest to residency and ensure that kinship,
customary care, and families caring for children outside a formal care arrangement have access to
the CCB; Set the qualifying threshold Canada Workers Benefit to $0, untying the benefit from
employment and substantially increase benefit amounts.
• Invest $4 billion into the Canada Social Transfer (CST) to support social assistance adequacy and
remove arbitrary growth restrictions as first steps towards ensuring that income and disability
assistance programs bring incomes up to the CFLIM-AT. Require the development of minimum
standards for income benefits and social services funded through the CST. These minimum
standards must include binding conditions stipulating that income supplements – including the CCB,
Child Disability Benefit, child support payments, and child-related Employment Insurance benefits –
are not deducted from social assistance.
• Fast-track the implementation of two new federal disability benefits – one for adults and one for
children – using research and data already available and including people with disabilities in
meaningful and active ways through every step of the process. Ensure that the benefit: reaches
those with low incomes with expanded criteria; is refundable; and allows workers to keep earned
income.
• Immediately implement a CERB Repayment Amnesty for everyone living below or near the low
income measure after tax and cease treating it as earned income. Immediately reinstate the CRB at
the full amount of $500 weekly until Employment Insurance is reformed.
• Research and develop a parallel community-based benefit eligibility and delivery system for low-
income, marginalized non-tax filers. The federal government must look to other jurisdictions for best
practices on financial inclusion immediately, such as delivery by prepaid reloadable credit card
systems implemented in partnership with trusted charities, and in the medium term, such as mobile
or digital transfers as poverty elimination efforts.
• Address growing income inequality and generate revenue for poverty reduction programing by
eliminating or reducing highly regressive and expensive tax loopholes, closing tax havens, taxing
extreme wealth, and implementing excess profit tax focused on corporate pandemic windfalls.
Appendix 11
In her latest update on the progress of the Job Guarantee, Dr. Pavlina R. Tchernova makes the
following points:
23That the Climate Crisis is expected to wipe out millions of jobs; a minimum of 80 million full time
jobs by 2030, not counting those lost as a result of wildfires, floods, storms, and other extreme
weather events. These will come on the heels of the historically unprecedented 255 million job
losses globally in 2020.”
While all programs aimed at alleviating poverty are slow to get actualized, the Job Guarantee (JG)
has the ability to get off the ground in a fairly short time.
The JG is an antidote to both climate change and jobs taken by robots. It is a public-employment
policy that ensures a decent job at a family-sustaining wage, with benefits to any person who needs
one. It tempers inflationary pressures and is the clearest answer to the international consensus
enshrined in the 2015 Paris climate agreement, that any climate action must uphold a commitment
to “the imperatives of a just transition of the workforce, and the creation of decent work and
quality jobs in accordance with nationally defined development practices.
The JG is taking off in many countries around the world. It is a crucial element for the US Congress
proposal for the Green New Deal (GND) In 2020 the “democratizing work” manifesto which
appeared in 43 newspapers in 27 languages around the world, identified the Right to Employment
as a core demand and a crucial component in decarbonizing the economy. The International Labour
Organization also has formally recognized the idea as the best means for shaping “a fair, inclusive
and secure future of work with full, productive, and freely chosen employment and decent work for
all.”
The GND’s federal job guarantee would provide the missing jobs that conventional market
mechanisms fail to supply, spearheading projects that serve a public purpose, including tackling the
most urgent climate-related challenges.
A JG is the bridge to decent jobs for fossil-fuel workers caught in the green transition. It brings an
end to extractive industries and provides the very employment needed to rebuild communities and
mend the planet thus opening up the shortest path to a post-pandemic recovery.
The JG is proving to be a popular and effective program in Europe, India, South Africa, Argentina
and especially the USA where the majority of voters and politicians prefer it.[ A JG for PEI would
cost around 1% to 1.5% of Gross Provincial Product but once established it would be close to
revenue neutral.]
The GND insists that a Green transformation requires basic economic security for all. Its demands
are strongly supported by many corners of civil society. It offers decent jobs at decent pay to the
most disadvantaged of society and to all who wish to work. It also offers hands-on training. Green
jobs are, “those that address all forms of destitution and neglect of our most valuable resources,
both natural and human.
The GND calls for a wholesale transformation, necessary to produce a rapid and robust answer to
global warming. It is an all-hands-on-deck industrial strategy that has been called the “moonshot of
our time” and linked to “wartime mobilization.” It results in economic security for all. Green
projects rehabilitate the environment, strengthen communities, and improve the social
determinants of health. “Every climate solution and the manner of its implementation will have
deep economic, social and political ramifications.
24With a JG in place, economists could no longer justify unemployment as a “natural tribute” in the
fight against inflation. But in its absence, “decent work for all” will remain an empty slogan, and
unemployment a perennial threat. We cannot speak earnestly of inclusion if people of colour,
caregivers, those with disabilities, and youth are systematically excluded from good jobs.
Coal mining communities in West Virginia and Kentucky are beginning to see its transformative
potential. From New England to Appalachia to California, a growing coalition of individuals,
organizations, and civil-rights leaders in the US is making the policy a central demand.
In a 2020 poll in the US, 79% of respondents spanning “democratic, partisan and gender lines”
backed the idea, as did 72% of respondents in a UK poll taken around the same time. In France, 70%
0f voters support a federal JG, and the policy has been endorsed by the Mayors of Paris and Lille.
More recently, a stunning 93% of US respondents supported a national employment and training
initiative that creates paid work for the unemployed, as a component of COVID-19 recovery efforts
The biggest pandemic budgets are coming from monetarily sovereign countries that issue and
control their currencies, and where government finance is provided by central banks and finance
ministries. But whether governments understand it or not, the cause of inaction or delayed action
in tackling the climate crisis is already baked into each country’s budget. Misplaced fiscal rectitude
cannot be allowed to cripple a bold policy agenda. As US House Budget Committee Chair John
Yarmuth recently pointed out, monetarily sovereignty might face resource and inflation constraints,
but they cannot run out of funding. And as the biggest polluters, they have a moral obligation to
launch a global Green Marshall Plan.
There are myriad ways to arrange human economic affairs. The Job Guarantee is the basic
foundation from which to build solutions to the economic challenges in front of us.
Notes
Pavlina R. Tcherneva, the Case for a Job Guarantee, Polity Press, Medford, MS
Canadian Labour Force Summary for October 2020
Pavlina R. Tcherneva, A Federal Job Guarantee, Harvard Law School Forum, March 2018
Christine Saulnier, The Living Wage for Charlottetown, November 2, 2020
Ibid
Annual Report of IRAC, 2020
Jesse Snyder, Charlottetown Guardian, Liberals could post $381-billion deficit, December 2, 2020
Mike MacDonald, information by phone, November 2021
James K. Galbraith, University of Texas, Austin
Noam Chomsky to Pavlina R. Tcherneva, 2020
Pavlina R. Tcherneva, the Case for a Job Guarantee, Polity Press, Medford, MS
Canadian Labour Force Summary for October, 2020
Pavlina R. Tcherneva, A Federal Job Guarantee, Harvard Law School Forum, March, 2018
Christine Saulnier, The Living Wage for Charlottetown, November 2, 2020
Ibid
Annual Report of IRAC, 2020, 2021
Ibid
Mike MacDonald, information by phone, November 17, 2021
Stu Neatby, Charlottetown Guardian, November 18, 2021
Kelton, Stephanie, The Debt and Deficit Myth, Public Affairs, New York, 2020
25Cody McEachern, Fighting for Their Homes Charlottetown Guardian, November 1, 2021
Ryan Ross, Help Needed for Rural Homelessness, Charlottetown Guardian, November 17, 2021
i
http://goodjobsforall.ca/wp-content/uploads/2021/06/EI-Interprov-Group.pdf
26You can also read