Weekly update for coronavirus figures in the county

Page created by Virginia Harris
 
CONTINUE READING
Weekly update for coronavirus figures in the county
Weekly update for coronavirus
      figures in the county
                               14 April 2021

   How is coronavirus affecting people in Lancashire?
This is a weekly bulletin produced by the Lancashire Resilience Forum with the
 latest figures on the number of coronavirus-related cases and deaths in the
              county, as well as figures at a unitary and district level.
     It also shows how Lancashire compares to other areas of the country.
Weekly update for coronavirus figures in the county
Confirmed cases from positive
‘pillar 1 and 2’ tests up to
                                                                                                                               9,361
11 April 2021
                                                                                    6,618
                                                                                                    LANCASTER
                                                                                                                                         4,573
LANCASHIRE

124,418                                                                 13,737
                                                                                                  WYRE
                                                                                                                      RIBBLE
                                                                                                                      VALLEY
                                                                                                                                                    9,613
                                                          9,172
NORTH WEST                                                                                                                         PENDLE

602,041                                                                4,765
                                                                                     BLACKPOOL
                                                                                          FYLDE
                                                                                                    PRESTON

                                                                                                   SOUTH
                                                                                                   RIBBLE
                                                                                                                              BURNLEY
                                                                                                                        HYNDBURN
                                                                                                                    BLACKBURN
                                                                                                                    WITH
                                                                                                                                                    9,871

ENGLAND                                                                                                             DARWEN
                                                                                                                            ROSSENDALE
                                                                                                                                                 7,807

3,822,371
                                                                          8,893                          CHORLEY

                                                                                            WEST
                                                                                            LANCASHIRE
                                                                                                                                            6,073
                                                                                                                     8,072      18,029
                                                                                                            7,834
These figures are from tests carried out in Public Health England labs and in
the NHS (Pillar 1) and from other testing routes, such as mobile labs (Pillar 2).
Weekly update for coronavirus figures in the county
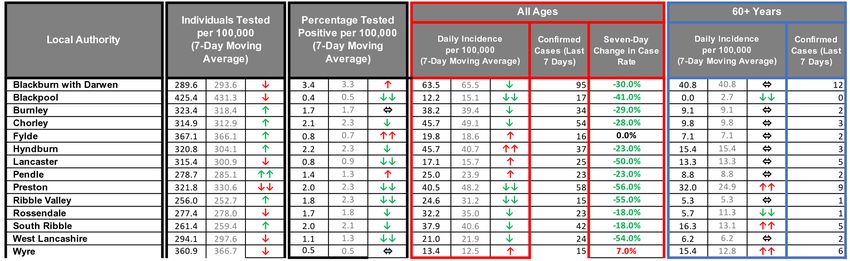
Weekly rate of Covid-19
cases per 100,000 population
tested under pillar 1 and
pillar 2 (Week 13 - data
between 29 March and
4 April 2021).                                                                             Blackpool
                                                                                                       Lancashire

                                                                                           Blackburn
                                                                                         with Darwen

For rate of cases detected via Pillar 1 & 2 testing:
Blackpool’s rate is in the lowest band, Lancashire’s rate is in the second lowest band
and Blackburn with Darwen’s rate is in the third lowest rate band.

Pillar 1 = swab testing in PHE labs & NHS hospitals for those with a medical need
and key workers & their families
Pillar 2 = testing by commercial partners - swab testing for the wider
population from out in the community
Weekly update for coronavirus figures in the county
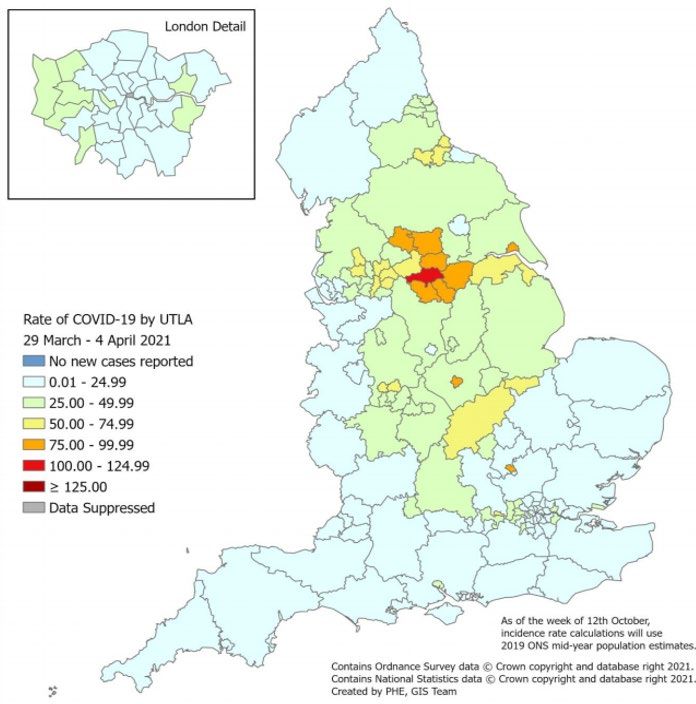
Cumulative lab-confirmed cases up to 11 April 2021,
                                           rate per 100,000

Source: https://coronavirus.data.gov.uk   Cases are from both pillar 1 and 2
Weekly update for coronavirus figures in the county
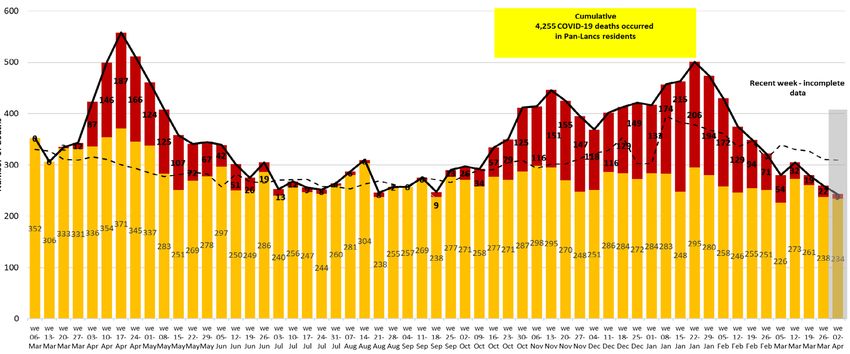
Daily pillar 1 and pillar 2 lab-confirmed cases to 11 April 2021

Positive tests are counted according to the date the sample was taken. However, most
swabs taken in recent days will not yet have produced a result, so it is important not to
jump to the conclusion that the epidemic is tailing off quicker than it really is. The PHE
website cautions that only data from five days or more ago can be considered complete.       Figures relating to confirmed cases by Upper Tier Local Authority
The greyed-out columns in figure above are liable to be added to as more results come in.           can be downloaded from: https://coronavirus.data.gov.uk
Weekly update for coronavirus figures in the county
Testing and incidence
                             Specimens taken/outbreaks reported between 1/4/21 – 7/4/21

Due to the reporting delays for comparison between Local Authorities the most
recent 4 days are excluded from the calculations of rates and moving averages.

Single direction-of-travel arrows denote a perecntage change of less than 10%.
Twin arrows denote a change of greater than 10%.                                    Source: PHE laboratory confirmed COVID-19-line list
Weekly update for coronavirus figures in the county
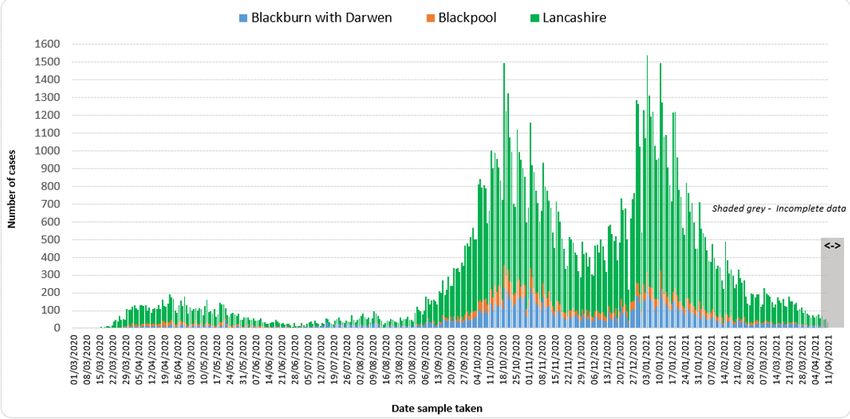
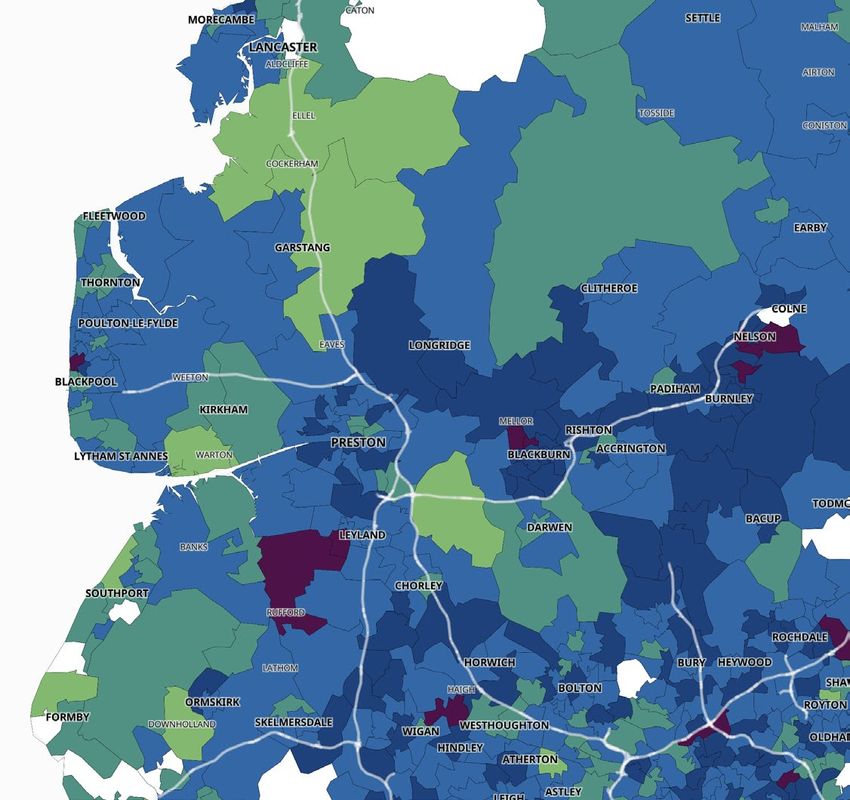
Covid-19 cases (number of people with a lab-confirmed
positive test result) by Middle Super Output Area (MSOA).
MSOAs with 3 and above COVID-19 cases, in the 7 days ending 7 April

                             Link to interactive map showing cases by MSOA
                             https://coronavirus.data.gov.uk/details/interactive-map

                             MSOAs are small areas with around 7,200 average population
                             and are used to facilitate the reporting of small area statistics.

                             Source: https://coronavirus.data.gov.uk/cases
Weekly update for coronavirus figures in the county
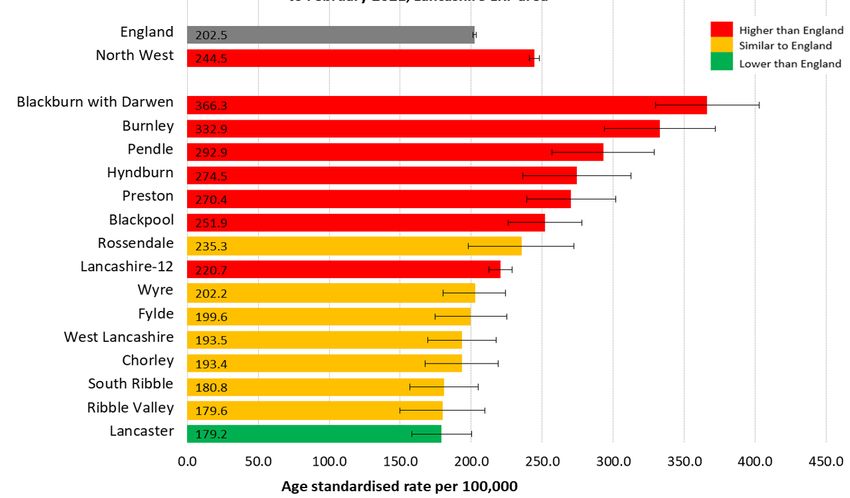
Ethnic break down of positive cases in the 14 days to 07/04/21
                            Percentage of total positive cases over this period

                                                                              Source: Public Health England

The ethnic break down of the positive cases in each district should be
considered alongside the ethnic make up of the whole resident population
in the district.

For the ethnic break down of the whole resident population in a district
please see the page below:
https://www.lancashire.gov.uk/lancashire-insight/population-and-households/
population-and-households-2011-census/population-by-ethnicity/
Count of deaths identified as
Covid-19 on death certificates                                                                               330
and occurred up to
2 April but were registered                                         384
up to 10 April 2021                                                                LANCASTER
                                                                                                                               168

LANCASHIRE                                                    344
                                                                                 WYRE
                                                                                                    RIBBLE
                                                                                                    VALLEY
                                                                                                                                              274
            213                       818               472                                                         PENDLE
             at home               in a care home
                                                                    BLACKPOOL      PRESTON

         3,143                         73                     280
                                                                         FYLDE                              BURNLEY
                                                                                                      HYNDBURN                               312
           in hospital               in a hospice                                 SOUTH           BLACKBURN
                                                                                  RIBBLE          WITH
                             8
                                                                                                          ROSSENDALE
               Other                                                                              DARWEN
                                                                                                                                         237
                                                              298                       CHORLEY

 TOTAL 4,255                                                            WEST
                                                                        LANCASHIRE

                                                                                                   256         462               180
Up to the 10 April, the number of deaths where COVID-19 was
mentioned on the death certificate:
                                                                                           258
4,255 registered in the Lancashire LRF area
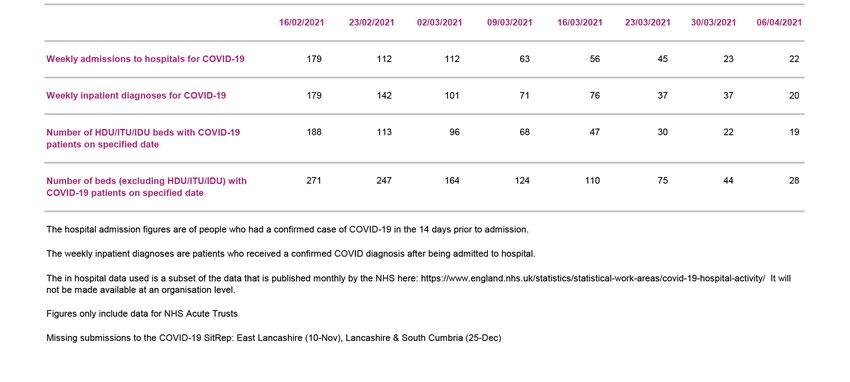
3,321 registered in the Lancashire County Council area                                                       Source: Office for National Statistics (ONS)
Number of COVID-19 cases occupying hospital beds
        in Lancashire and South Cumbria
Weekly deaths occurring up to 2 April,
Number of deaths   compared with the five-year weekly average

                                            Week Ending

                    Non-Covid deaths   Covid deaths

                    Total deaths       Weekly average (2015 - 2019)
                                                                      Source: Office for National Statistics (ONS)
Deaths due to Covid-19* - age standardised rate per 100,000 population,
                all persons - March 2020 to February 2021

Blackburn with Darwen and Blackpool’s COVID-19 mortality rate is significantly worse than the England rate.
The Lancashire County Council area’s rate is also significantly worse than England.
Along with the Lancashire County Council area, the individual authorities of Burnley, Pendle, Preston and Hyndburn are significantly higher than England.
Only Lancaster and South Ribble’s rates are significantly lower than the England rate.

*Deaths registered where Covid-19 was the underlying (main) cause of death                                                                                  Source: Office for National Statistics (ONS)
Covid-19 Vaccinations by local authority of residence and age group
                                                                                                                           8 December 2020 to 4 April 2021

                                                                                                                                                                         Source: https://www.england.nhs.uk/statistics/statistical-work-areas/covid-19-vaccinations/

                                                                                                                                                                                                                                                 Population/cohort size (denominator) definitions
                                                                                                                                                                                                                                                 The estimates of population size can be used as a denominator to approximate or calculate
Population Estimates (NIMS)                                                                                             Population Estimates (ONS)                                                                                               vaccination coverage percentages. Two denominators are used:
The latest available estimates of the population of England by age group as calculated using NIMS                       Estimates of the population by age group as estimated by the Office for National Statistics
                                                                                                                                                                                                                                                 1- Office for National Statistics (ONS) 2019 mid-year population estimates are provided as
                                                                                                                                                                                                                                                 the official statistics and the best publicly available population estimates. These estimates are
                                                                                                                                                                                                                                                 consistent with the UK COVID-19 vaccines deployment plan and therefore provide a reference
                                                                                                                                                                                                                                                 point on progress. They are the most accurate estimates available at national level, however
                                                                                                                                                                                                                                                 they are less robust at smaller areas and are subject to a degree of uncertainty as they are
                                                                                                                                                                                                                                                 2019 estimates based on the 2011 Census.

                                                                                                                                                                                                                                                 2- National Immunisation Management System (NIMS) denominators are provided for Lower
                                                                                                                                                                                                                                                 Tier Local Authority (LTLA). NIMS denominators facilitate management of the vaccination
                                                                                                                                                                                                                                                 programme at more granular levels and should be used when calculating vaccine coverage
                          Source: https://www.england.nhs.uk/statistics/statistical-work-areas/covid-19-vaccinations/                              Source: https://www.england.nhs.uk/statistics/statistical-work-areas/covid-19-vaccinations/
                                                                                                                                                                                                                                                 for public health purposes. NIMS denominators may provide an overcount if individuals are no
                                                                                                                                                                                                                                                 longer resident in England, but may also be subject to some undercounting as they currently
                                                                                                                                                                                                                                                 do not include individuals without an NHS number. Coverage can be viewed as being ‘at least’
                                                                                                                                                                                                                                                 the figures presented using the NIMS denominator. The NIMS denominators are based on the
                                                                                                                                                                                                                                                 resident population and therefore people will be counted in the denominators if they live in
                                                                                                                                                                                                                                                 England, even if their GP practice is in Wales or Scotland and they receive their vaccination
                                                                                                                                                                                                                                                 outside of England. Therefore, when looking at lower levels of geography, areas near the
                                                                                                                                                                                                                                                 borders may appear to have lower vaccine uptake rates than other areas of England.
Vaccine data

Find out more information about
  how many people have been
  vaccinated in your local area,
   as well as information about
 the progress of the vaccination
          programme at:

 https://www.england.nhs.uk/
statistics/statistical-work-areas/
     covid-19-vaccinations/
Local information

   There is a wealth of local
     data is available from
https://coronavirus.data.gov.uk

By typing in your postcode you will
    get a local dashboard which
   shows a range of information
including how many positive cases
   and deaths there have been,
and how your local area compares
      to the England average.

     You can also explore the
   interactive map for England.
Help share our messages!

     Access our range of resources to share on social media to
encourage Lancashire people to play their part to combat coronavirus.

       Find out more about the LancsTogether campaign and
                   what you can do to take part.

We are all working together in Lancashire to combat coronavirus.
You can also read