White matter network alterations in patients with depersonalization/derealization disorder
←
→
Page content transcription
If your browser does not render page correctly, please read the page content below
Research Paper
White matter network alterations in patients with
depersonalization/derealization disorder
Anika Sierk, PhD (candidate)*; Judith K. Daniels, PhD*; Antje Manthey; Jelmer G. Kok, PhD;
Alexander Leemans, PhD; Michael Gaebler, PhD; Jan-Peter Lamke, PhD;
Johann Kruschwitz, PhD; Henrik Walter, PhD
Background: Depersonalization/derealization disorder (DPD) is a chronic and distressing condition characterized by detachment from
oneself and/or the external world. Neuroimaging studies have associated DPD with structural and functional alterations in a variety of
distinct brain regions. Such local neuronal changes might be mediated by altered interregional white matter connections. However, to our
knowledge, no research on network characteristics in this patient population exists to date. Methods: We explored the structural connec-
tome in 23 individuals with DPD and 23 matched, healthy controls by applying graph theory to diffusion tensor imaging data. Mean inter-
regional fractional anisotropy (FA) was used to define the network weights. Group differences were assessed using network-based sta-
tistics and a link-based controlling procedure. Results: Our main finding refers to lower FA values within left temporal and right
temporoparietal regions in individuals with DPD than in healthy controls when using a link-based controlling procedure. These links were
also associated with dissociative symptom severity and could not be explained by anxiety or depression scores. Using network-based
statistics, no significant results emerged. However, we found a trend for 1 subnetwork that may support the model of frontolimbic dysbal-
ance suggested to underlie DPD symptomatology. Limitations: To ensure ecological validity, patients with certain comorbidities or
psychotropic medication were included in the study. Confirmatory replications are necessary to corroborate the results of this explorative
investigation. Conclusion: In patients with DPD, the structural connectivity between brain regions crucial for multimodal integration and
emotion regulation may be altered. Aberrations in fibre tract communication seem to be not solely a secondary effect of local grey matter
volume loss, but may present a primary pathophysiology in patients with DPD.
Introduction and neuroimaging research suggests DPD to be underpinned
by alterations within neurobiological circuits: an early model
Depersonalization/derealization disorder (DPD) is a dissocia- emphasizing the role of the temporal lobes9 has been sup-
tive disorder1 estimated to affect 1%–2% of the general popula- ported by studies with epileptic patients10,11 and 2 neuroim
tion.2 However, a German study found a 12-month prevalence aging studies on DPD.12,13 A more recent theory proposes a
of 0.007 based on diagnoses given by clinicians, which sug- frontolimbic dysbalance in individuals with DPD, assuming
gests DPD is severely underdiagnosed, making research chal- hyperactive prefrontal cortices to inhibit limbic structures,14
lenging in this population.3 Individuals with DPD experience which is also congruent with theories proposed for the disso-
recurrent episodes of feeling detached from oneself (deperson- ciative subtype of PTSD.8,15 Most functional MRI (fMRI) studies
alization) and/or the external world (derealization). Other on DPD used affective stimuli to test this model and reported
clinical phenomena of DPD include emotional numbing and hypoactivity in limbic regions16,17 and hyperactivation in pre-
somatosensory distortions.4,5 Shorter episodes of depersonal frontal regions in individuals with DPD compared with
ization or derealization can also occur in the context of other healthy controls,17, 18 (but also see Medford and colleagues19).
disorders, such as temporal lobe epilepsy,6 schizophrenia,7 or Unfortunately, all fMRI studies published to date have very
posttraumatic stress disorder (PTSD).8 Psychophysiological small DPD sample sizes (n = 6–14), which severely affects their
Correspondence to: J. Daniels, Department of Clinical Psychology and Experimental Psychopathology, University of Groningen, Grote
Kruisstraat 2, 9712 TS Groningen, Netherlands; J.K.Daniels@rug.nl
*These authors contributed equally to this work.
Submitted June 7, 2017; Revised Dec. 1, 2017; Accepted Jan. 21, 2018; Published online first June 6, 2018
DOI: 10.1503/jpn.170110
© 2018 Joule Inc. or its licensors
J Psychiatry Neurosci 2018;43(5) 347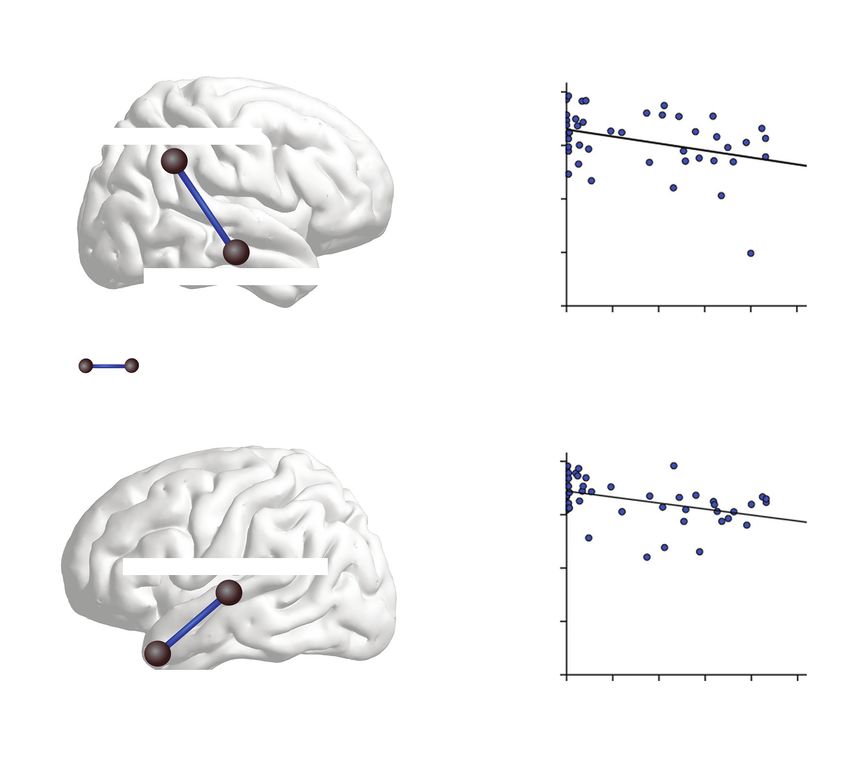
Sierk et al.
validity. Two recent structural MRI studies with larger sam- tion (IPDE).34 The SKID-D was used to establish the diagnosis
ples of patients with DPD and healthy controls suggest that of DPD according to the criteria in DSM-IV (300.6) as well as
grey matter alterations underlie DPD symptomatology.12,20 the criteria of the depersonalization-derealization disorder ac-
One of them (n = 20 patients with DPD) found less cortical cording to ICD-10 (F48.1). The DPD diagnosis established in
thickness in the right middle temporal gyrus,12 while the other the present work is still valid, as the relevant criteria have not
(n = 25 patients with DPD) found reductions of grey matter changed in DSM-5. Patients were excluded from the study if
volume in the right caudate, right thalamus and right cuneus they had a history of lifetime psychotic disorders, substance
as well as volume increases in the left dorsomedial prefrontal addiction in remission for less than 6 months, or current PTSD.
cortex and right somatosensory regions.20 In the context of Patients with comorbid PTSD were excluded to avoid diagnos-
other disorders, dissociation has also been associated with al- tic ambiguity, considering that symptoms of the dissociative
tered functional connectivity.21 Edelman and Tononi22 suggest subtype of PTSD strongly overlap with DPD symptoms.1
that disturbed neuronal interaction might underlie the cogni- Participants were included in the control group only when
tive and emotional disconnect characteristic of dissociation. As no mental disorder had been identified. General exclusion
dissociative symptoms constitute the hallmark of DPD, one criteria were lifetime neurologic disorders, serious head in-
may hypothesize that disturbed integration of neuronal infor- jury, current use of benzodiazepines or opioids, insufficient
mation underlies DPD symptomatology as well. However, to knowledge of the German language, and MRI incompatibil
our knowledge, no study to date has analyzed functional con- ities. The study was approved by the research ethics board at
nectivity (except in a single case study23) or structural connec- the Charité – Universitätsmedizin Berlin.
tivity (i.e., white matter anatomy) in patients with DPD.
Diffusion tensor imaging (DTI) allows the human brain Questionnaires and tasks
connectome to be imaged noninvasively.24,25 Applying graph
theory to DTI data has made it possible to analyze structural All participants completed several self-report questionnaires.
connectivity on a network level.26 Graph theory is a mathe- To assess symptom severity of depersonalization and dereal-
matical approach for the analysis of complex networks con- ization, participants completed the German versions of the
structed of “nodes” (i.e., in our case brain regions of interest), 30-item Cambridge Depersonalization Scale (CDS-30)35 and
which are interconnected via “edges.” Graph theory has the Dissociative Experiences Scale (DES).36 Patients with a
emerged as a powerful tool for identifying anatomically lo- score of at least 60 on the CDS-30 (α = 0.981) were invited for
calized subnetworks associated with neuronal alterations in clinical diagnostics. In addition, the Beck Depression Inven-
psychiatric conditions.27–30 By applying an exploratory graph tory (BDI-II),37 the State-Trait Anxiety Inventory (STAI),38 the
theoretical analysis on diffusion MRI tractography data, we Liebowitz Social Anxiety Scale (LSAS),39 the Toronto Alexi-
sought to identify networks with different structural connec- thymia Scale (TAS-20),40 the Emotion Regulation Question-
tivity between patients with DPD and matched healthy con- naire (ERQ),41 the Kentucky Inventory of Mindfulness Skills,42
trols. Thus, the research question of the present study is the questionnaire for functional and dysfunctional self-
whether DPD is associated with altered structural connectiv- focused attention,43 the Sheehan Disability Scale,44 and the
ity on a network level. short version of the Childhood Trauma Questionnaire45 were
Despite existing theories on the underlying neurobiology used for sample characterization. Information processing
of DPD, empirical evidence is scarce. Being the first group, speed and executive functions were measured using the Trail
to our knowledge, to investigate structural connectivity in Making Test versions A and B (TMT),46 respectively.
patients with DPD, we sought to provide an unbiased inves-
tigation. To this end, we chose to use a strictly exploratory MRI acquisition
approach aimed at theory-building rather than hypothesis-
testing as discussed with regard to the replication crisis.31 We acquired the MRI data using a 3 T Siemens Tim Trio scanner
equipped with a 12-channel head coil. Diffusion tensor imaging
Methods was performed with a single-shot echo-planar imaging sequence
using the following parameters: repetition time (TR) 7500 ms,
Participants echo time (TE) 86 ms, 61 slices, voxel size 2.3 × 2.3 × 2.3 mm3,
slice thickness 2.3 mm, field of view (FOV) 220 × 220 mm2, 64 dif-
We acquired DTI scans in patients with DPD and healthy con- fusion directions, b value = 1000s/mm2. We acquired T1-
trols, who were a subset of the sample analyzed for volumetric weighted images using a magnetization-prepared rapid acquisi-
changes in grey matter in an earlier study by our group.20 Par- tion with gradient echo sequence (TR 1.9 ms, TE 2.52 ms,
ticipants were recruited via advertisements posted online and inversion time (TI) 900 ms, flip angle 9°, FOV 256 × 256 mm2,
in public spaces as well as in mental health in- and outpatient 192 slices, 1 mm isotropic voxel sizes, 50% distancing factor).
clinics. We obtained written informed consent from all indi-
viduals before participation. All participants were interviewed Preprocessing
using German versions of 3 standardized clinical interviews:
the Structured Clinical Interview for Dissociative Disorders The preprocessing pipeline for the structural network analy-
(SKID-D),32 the Structured Clinical Interview for DSM-IV sis is shown in Figure 1. We processed the T1-weighted MRI
(SKID)33 and the International Personality Disorder Examina- scans using the default settings implemented in FreeSurfer
348 J Psychiatry Neurosci 2018;43(5)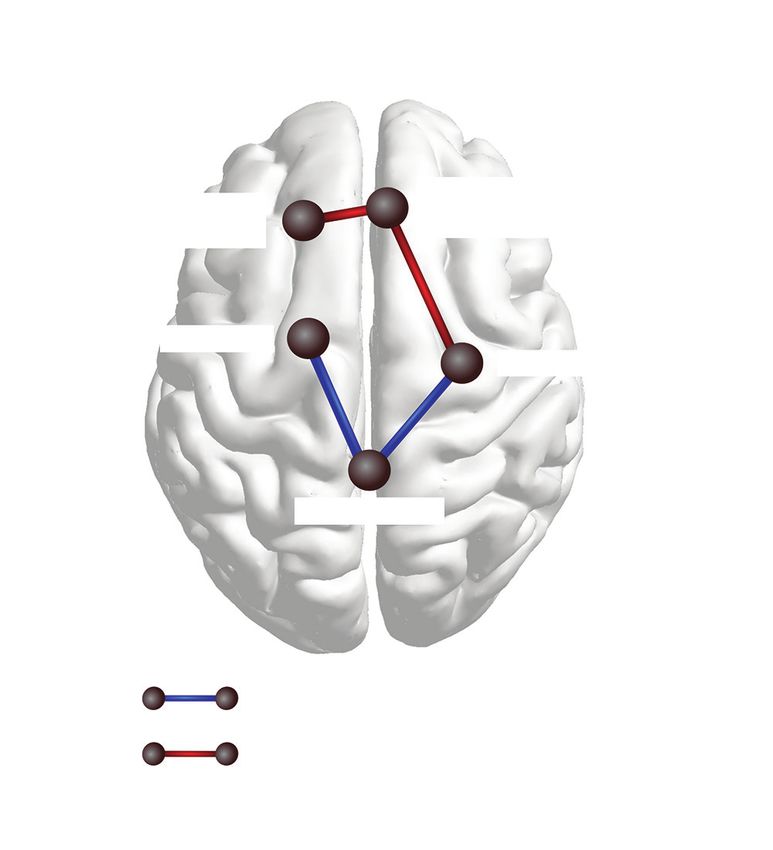
White matter network alterations in patients with DPD
version 5.3 (https://surfer.nmr.mgh.harvard.edu/). Impor- participants. 54,55 As this may vary between groups, we
tant processing steps include skull stripping, segmentation included only links in the network analyses for which
of subcortical white matter and deep grey matter volumetric streamlines had been generated successfully for all
structures, intensity normalization, definition of the grey participants (i.e., 1153 links).
matter–white matter boundary, and parcellation of the cere-
bral cortex into units with respect to gyral and sulcal struc- Statistical analysis
tures.47 Each output was visually inspected for quality con-
trol. Five scans had to be manually corrected and (partially) We included age, sex and handedness as covariates in all net-
rerun. The final results yielded a proper distinction of each work analyses; although they did not differ significantly be-
surface and subcortical ROIs in all participants. tween groups, subtle changes in these variables have been
The preprocessing of the DTI data was performed with shown to impact structural brain connectivity.56 We used the
E xploreDTI, version 4.8.6 (www.exploredti.com) 48 in streamlines between each pair of nodes as a mask, within
MATLAB (Release 2014b; https://mathworks.com) using de- which we calculated mean fractional anisotropy (FA), a com-
fault settings. Specifically, data were corrected for participant monly used parameter that reflects tissue organization in
motion using “Rekindle” methods,49 eddy current–induced cerebral white matter.57 Mean FA values were used as edge
geometric distortions50 and EPI distortions.51 Subsequently, weights between any 2 ROIs and thus presented an indicator
constrained spherical deconvolution (CSD) whole-brain trac- for their strength of association or structural connectivity, re-
tography was performed52,53 for each participant. Following spectively. Note that not all included ROI pairs are linked via
visual inspection, 1 participant was excluded as the fibre direct anatomic connections (only homotopic regions are di-
tracts could not be reconstructed adequately. rectly connected via fibre bundles) as tractography accounts
for indirect connections. All second-level network analyses
Connectivity matrices (i.e., network-based statistics, link-based false discovery rate
[FDR] analysis, and correlational analyses with symptom
Connectivity matrices were constructed based on 85 pre- scores) were performed using GraphVar version 1.0 (www
defined anatomic regions of interest (ROIs) derived from .nitrc.org/projects/graphvar/).58
FreeSurfer. The ROIs encompassed all cortical regions from
the Desikan Killiany atlas (34 areas) plus the bilateral Network-based statistics: group comparison
subcortical structures hippocampus, amygdala, thalamus, Network-based statistics (NBS) is a nonparametric statistical
caudate, pallidum, putamen, accumbens area, ventral method developed by Zalesky and colleagues30 to identify
diencephalon and brainstem. The cerebellum was excluded as graph components within a network that are associated with
it was not fully captured in a number of scans. The 85 ROI an external variable, while controlling the family wise error
files were combined with the streamline files from (FWE) rate. Within NBS, statistical thresholding is carried out
ExploreDTI, resulting in 85 × 85 connectivity matrices for each in 2 steps: first, the hypothesis of interest is tested independ
participant. It is inevitable when using deterministic ently at every connection within a network using link thresh-
tractography that not all fibre tracts can be reconstructed in all olds. Adjacent suprathreshold links may ultimately form
Diffusion Correction for motion, CSD tractography
weighted image eddy current, and EPI
distortions
Connectivity matrices Graph analysis
T1-weighted image Parcellated brain regions
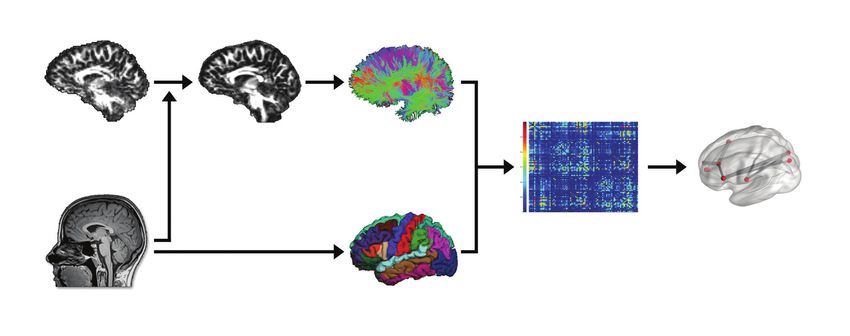
Fig. 1: Flowchart of the preprocessing pipeline using FreeSurfer (https://surfer.nmr.mgh.harvard.edu) and ExploreDTI (www.exploredti.com).
CSD = constrained spherical deconvolution; EPI = echo-planar imaging.
J Psychiatry Neurosci 2018;43(5) 349Sierk et al.
graph components. Subsequently, the significance of these pothesis at the level of cerebral networks by controlling the
graph components at the network level is determined by FWE rate (i.e., the probability of false-positive networks). In
comparing their size against the occurrence of differently the GraphVar toolbox,58 an FDR correction algorithm60 is car-
sized graph components derived from random data (i.e., by ried out with respect to a designated α level. We applied an
performing FWE correction). In accordance with this pro FDR-corrected threshold of pFDR = 0.05 and tested against ran-
cedure, we performed a series of t tests to identify links be- dom groups using 100 000 permutations.
tween any of the 85 ROIs for which the DPD and control
group showed significant differences in FA values. To deter- Link-based analysis using FDR: c orrelational analysis
mine suprathreshold links, we applied descending initial link Link-based analysis was performed to explore the association
thresholds (lt) from plt = 0.05 to plt = 0.001 in steps of 0.005. of symptom severity as measured by the CDS-30 with the in-
This procedure (i.e., no fixed initial link threshold) was cho- dividual connections between any ROI pair within a net-
sen because variations in thresholding can be informative re- work. Again, we computed partial correlations controlling
garding the nature of any observed group difference: effects for age, sex and handedness. We applied an FDR-corrected
found only at liberal thresholds (e.g., plt < 0.05) are expected threshold of p = 0.05 and tested against a random distribution
to be subtle and topologically extended, whereas effects evi- of CDS-30 scores using 100 000 permutations.
dent at conservative thresholds (e.g., plt < 0.001) are likely to
reveal strong focal differences between groups.30 Significance Results
of the resulting graph components was determined by gen
erating a corresponding null-model distribution, using Final sample
10 000 permutations. For the present analysis, we considered
an identified graph component (i.e., subnetwork) as statis We enrolled 24 patients with DPD (18 women) and
tically significant with an FWE-corrected p < 0.05. However, 23 healthy controls (18 women; Table 1) in the present study;
owing to the explorative nature of this study, significant re- 1 patient had to be excluded owing to inadequate fibre recon-
sults are used purely for theory-building and should be repli- struction, leaving a final sample of 23 patients in the DPD
cated with preregistration.31 group. Seventeen patients had current comorbid disorders,
mainly anxiety disorders, and 9 used psychotropic medica-
Network-based statistics: correlational analysis tion (Table 2).
To obtain indications of whether the previously described
NBS group differences are specific to DPD symptomatology, Demographics
we subjected the connectivity matrices of all participants
(control and DPD) to an NBS partial correlation analysis with Patients with DPD did not differ from controls in age (t44 =
dissociative symptom severity, as measured by the CDS-30 0.289, p = 0.77), handedness (t44 = 1.542, p = 0.13), level of edu-
(controlling for age, sex and handedness). Specifically, in- cation (Mann–Whitney U = 245.5, p = 0.66), information pro-
stead of using group-wise t tests, we applied partial correla- cessing speed, or executive functions (Table 1). Patients with
tions for mass univariate testing in every cell of the connec- DPD differed significantly from controls on various self-
tivity matrix to determine sets of suprathreshold links. report questionnaires (Table 1), which in turn correlated
Again, significance of the resulting graph components was highly with DPD symptom severity (Appendix 1, Table S1,
determined by generating a corresponding null-model distri- available at jpn.ca/170110-a1). No significant differences be-
bution with 10 000 random permutations of CDS-30 scores. tween patients with and without psychotropic medication
were detected. Information regarding age at symptom onset
Link-based analysis using FDR: group comparison was available for 21 of 23 patients with DPD. Based on retro-
As an additional analysis, we used FDR59 to explore individ- spective reports, the mean age at symptom onset was 18.2 ±
ual connections between any ROI pair within a network that 6.17 years. At the time of the scan, patients had been living
may be altered in individuals with DPD. Although NBS im- with DPD on average for 12.43 ± 10.20 (range 0.5–36) years.
proves power, as it is a more stringent control of false posi- In most cases, symptoms had been chronic since their onset,
tives, only the network as a whole can be regarded as signifi- with either no or only brief interruptions.
cant and, thus, can be interpreted only as a whole. The
objective of performing a link-based controlling procedure30 Network-based statistics
in addition to using NBS derives from the exploratory nature
of the present study; FDR correction may provide additional Group comparison
information on focal effects concerning individual connec- No significant group differences in graph components (i.e.,
tions. Using FDR, a test statistic and a respective p value is subnetworks) between brain regions were detected with any
computed for each network link, which in this case refers to of the initial link thresholds. However, a trend was found at
the FA-based connection for which streamlines have success- an initial link threshold of plt = 0.005, which indicated group
fully been generated in all participants. Therefore, the null differences regarding 1 subnetwork (pFWE = 0.08 at the net-
hypothesis is tested based on individual links while control- work level, controlled for age, sex and handedness). This
ling the ratio of false-positive connections among all positive network comprised 5 nodes and 4 links between frontal and
connections. In contrast, NBS allows rejecting the null hy- subcortical regions. Within this network, patients with DPD
350 J Psychiatry Neurosci 2018;43(5)White matter network alterations in patients with DPD
showed higher FA values than controls between the left with DPD than controls were found for the connection link-
superior frontal gyrus, right medial orbitofrontal cortex and ing the right superior temporal gyrus and the right banks of
its connection to the right amygdala and lower FA values superior temporal sulcus (pFDR < 0.01). Each of the remaining
than controls between the right amygdala, brainstem and
left caudate (Fig. 2). Table 2: Current and lifetime comorbid disorders in patients with
DPD (n = 23)
Partial correlation analyses Disorder Current, n Lifetime, n
For 1 patient, no questionnaire data were available, leaving Anxiety disorders 11 11
45 participants for the partial correlation analysis (controlling Social anxiety disorder
for age, sex and handedness). No significant correlation be- Panic disorder 2 3
tween CDS-30 scores and interregional FA values in the links Specific phobia 2 2
identified using the initial link threshold of plt = 0.005 was Obsessive–compulsive disorder 2 2
found using NBS. Generalized anxiety disorder 1 1
Mood disorders 2 10
Link-based analysis using FDR Major depressive disorder
Personality disorders 1 1
Group comparison Emotionally unstable – impulsive type
We found that 9 individual graph components significantly Emotionally unstable – borderline type 1 1
differed between patients with DPD and controls when using Anxious avoidant 1 1
the link-based controlling procedure (Table 3). Components Dependent 1 1
for which patients with DPD showed lower FA values than Other 0 1
controls concerned connections between the left temporal Posttraumatic stress disorder
pole and left superior temporal gyrus (pFDR < 0.001), between Conversion disorder 0 1
the right middle temporal gyrus and right supramarginal Impulse control disorder 1 1
gyrus (pFDR = 0.002), between the brainstem and left caudate Eating disorder 0 3
(pFDR < 0.001), between the right medial orbitofrontal cortex Substance abuse disorder 0 1
and the right caudal anterior cingulate cortex (pFDR < 0.001) Total comorbidity 17 19
and between the right inferior temporal gyrus and the right
DPD = depersonalization/derealization disorder.
lingual cortex (pFDR < 0.001). Higher FA values for patients
Table 1: Demographic characteristics and clinical measures
DPD Control
Characteristic n Mean ± SD n Mean ± SD 2-tailed t test p value
Age, yr 23 30.61 ± 7.31 23 29.96 ± 7.99 t44 = 0.289 0.774
Handedness 23 0.76 ± 0.50 23 0.92 ± 0.15 t44 = –1.542 0.135
CDS-30 22 148.14 ± 43.10 23 9.61 ± 12.04 t43 = 14.543 < 0.001
CDS-State 23 926.96 ± 383.52 22 173.64 ± 254.40 t43 = 7.796 < 0.001
DES 22 442.27 ± 217.95 23 36.09 ± 39.05 t43 = 8.610 < 0.001
BDI-II 22 20.32 ± 11.27 23 2.48 ± 3.41 t43 = 7.120 < 0.001
STAI-T 22 56.23 ± 11.80 23 34.00 ± 11.37 t43 = 6.434 < 0.001
LSAS 22 442.27 ± 217.95 23 36.09 ± 39.05 t43 = 3.738 0.001
TAS-20 22 55.59 ± 8.66 23 52.00 ± 7.07 t43 = 5.785 < 0.001
ERQ 22 42.68 ± 8.98 23 39.52 ± 9.62 t43 = 1.138 0.262
KIMS 22 86.68 ± 19.71 23 124.39 ± 13.43 t43 = –7.531 < 0.001
DFS 22 70.36 ± 9.52 23 61.65 ± 9.24 t43 = 3.119 0.003
CTQ_sum 22 52.32 ± 17.52 23 44.22 ± 10.33 t43 = 1.878 0.069
CTQ_PA 22 6.36 ± 2.68 23 5.91 ± 1.91 t43 = 0.652 0.518
CTQ_PN 22 5.50 ± 2.76 23 4.00 ± 1.54 t43 = 2.241 0.032
CTQ_EA 22 11.00 ± 4.04 23 5.91 ± 1.91 t43 = 1.765 0.086
CTQ_EN 22 6.91 ± 5.86 23 4.57 ± 5.27 t43 = 1.411 0.165
CTQ_SA 22 6.45 ± 2.30 23 5.65 ± 1.72 t43 = 1.119 0.269
TMT-A 21 24.62 ± 5.52 21 24.90 ± 6.80 t40 = –0.150 0.882
TMT-B 21 51.38 ± 14.20 21 53.19 ± 18.59 t40 = –0.355 0.725
BDI = Beck Depression Inventory; CDS = Cambridge Depersonalization Scale; CTQ = Childhood Trauma Questionnaire; DES =
Dissociative Experiences Scale; DFS = Questionnaire for functional and dysfunctional self-focused attention; DPD = depersonalization/
derealization disorder; EA = emotional abuse; EN = emotional neglect; ERQ = Emotion Regulation Questionnaire; KIMS = Kentucky
Inventory of Mindfulness Skills; LSAS = Liebowitz Social Anxiety Scale; PA = physical abuse; PN = physical neglect; SA = sexual abuse;
SD = standard deviation; STAI-T = State-Trait Anxiety Scale, trait version; TAS = Toronto Alexithymia Scale, TMT = Trail Making Test.
J Psychiatry Neurosci 2018;43(5) 351Sierk et al.
3 components encompassed 3 brain regions connected via
2 edges. Patients with DPD showed lower FA values between
the left insula, left pars triangularis and the left lateral orbito-
pFWER = 0.08 frontal cortex (pFDR < 0.01), while showing higher FA values
between the left isthmus of the cingulate cortex, right cuneus
Medial and left superior parietal cortex (pFDR < 0.01). Finally, within
Superior
orbitofrontal cortex 1 component of 3 nodes, patients with DPD showed lower
frontal gyrus
FA values than controls between the left caudal anterior cin-
gulate cortex and the left medial orbitofrontal cortex and
higher FA values than controls between the latter and the
Caudate
Amygdala right superior frontal gyrus (pFDR < 0.01).
Partial correlation analyses
As 1 patient with DPD did not complete the CDS-30 ques-
Brainstem tionnaire, data from 45 participants were analyzed with par-
tial correlation analysis (controlling for age, sex and handed-
ness). The link-based analysis yielded a significant negative
correlation between DPD symptoms, as measured by the
CDS-30, and FA values of 5 components (Appendix 1,
Table S2). Four of these components match those identified in
DPD patients < Healthy controls
the group contrast for which patients with DPD showed
DPD patients > Healthy controls lower FA values than controls when using a link-based con-
trolling procedure (Table 3). In light of the high intercorrela-
tions between questionnaires assessing anxiety, depression
and dissociation, we tested whether this effect was driven by
Fig. 2: Visualization of the trend found in the group comparison dissociation severity by performing additional partial correl
when using network-based statistics. At an initial-link threshold of ation analyses with STAI-T scores and BDI scores. Using
plt = 0.005, a subnetwork was identified for which patients with
these as exclusive masks, we determined that mean FA be-
depersonalization/derealization disorder (DPD) displayed lower
tween the left superior temporal gyrus and temporal pole
fractional anisotropy (FA) (blue edges) as well as higher FA (red
edges) than healthy controls (pFWE = 0.08). Patients showed rela- (corrected α level pFDR < 0.001) as well as mean FA between
tively lower FA values between the left caudate, brainstem and the the right middle temporal gyrus and right supramarginal
right amygdala, and higher FA between the left superior frontal gyrus (corrected α level pFDR < 0.001) correlate solely with dis-
gyrus, right m edial frontal cortex and the right amygdala. FWE = sociation severity. These results are shown and the respective
family-wise error. scatterplots provided in Figure 3A–D.
Table 3: Group comparison using link-based controlling procedure, controlled for age, sex and handedness*
Negative correlation between
symptom scores and FA values
BDI STAI-T CDS Significant components DPD ≠ HC† pFDR value
— — √ Left temporal pole – – Left superior temporal gyrus < 0.001
— — √ Right middle temporal gyrus – – Right supramarginal gyrus 0.002
— √ √ Brain stem – – Left caudate < 0.001
√ √ √ Right medial OFC – – Right caudal ACC 0.001
— √ — Right inferior temporal gyrus – – Right lingual cortex < 0.001
— — — Right superior temporal gyrus + + Right banks of superior temporal < 0.01
sulcus
— — — Left insula – – Left pars triangularis – – Left lateral OFC < 0.01
— — — Left caudal ACC – – Left medial OFC + + Right superior frontal gyrus < 0.01
— — — Left isthmus of the cingulate cortex + + Right cuneus + + Left superior < 0.01
parietal cortex
ACC = anterior cingulate cortex; BDI = Beck Depression Inventory; CDS = Cambridge Depersonalization Scale; DPD = depersonalization/
derealization disorder; FA = fractional anisotropy; FDR = false discovery rate; HC = healthy controls; STAI-T = State-Trait Anxiety Scale, trait
version; OFC = orbitofrontal cortex.
*All components for which patients with DPD and controls displayed significantly different FA values are listed along with the respective
p value. Ticks mark components for which a significant correlation was found with dissociative symptoms scores (CDS-30), trait anxiety
(STAI-T), or depression (BDI).
†Minus signs between brain regions (– –) represent connections for which patients with DPD displayed lower FA values than controls; plus
signs between regions (+ +) represent connections for which patients displayed higher FA values than controls.
352 J Psychiatry Neurosci 2018;43(5)White matter network alterations in patients with DPD
Additional post hoc analyses (n = 23) to test whether FA values between certain regions
might be associated exclusively with the DPD diagnosis.
We performed additional post hoc analyses to control for po- None of our post hoc analyses yielded any overlap between
tential effects of psychotropic medications, which were taken the subnetwork and graph components identified in the
by 9 patients. We repeated the group comparison with medi- group comparison.
cation as a covariate (in addition to age, sex and handedness)
using NBS (plt = 0.005) and a link-based controlling proced Discussion
ure. Our main findings remained the same, even when medi-
cation effects were partialed out (Appendix 1, Table S3 and To our knowledge, this is the first study exploring aberra-
Table S4). Furthermore, we ran post hoc correlations within tions in structural connectivity in patients with DPD. Two
the patient group for age at symptom onset as well as dura- statistical correction methods for multiple comparisons were
tion of symptoms to verify whether components found in the used to identify potential group differences in an explorative
group comparison could be further explained by these vari- approach. Using link-based analysis, significant group differ-
ables. In addition, we contrasted a subsample of patients ences were found for 9 links. Connections between the left
without comorbid disorders (n = 11) with healthy controls superior temporal gyrus and the left temporal pole as well as
A B
pFDR < 0.001 .40
FA values between right
MTG and right SMG
Supramarginal gyrus
.30
.20
.10
Middle temporal gyrus
.00
0 50 100 150 200 250
Dissociative symptom
DPD patients < Healthy controls severity (CDS – 30 scores)
C D
pFDR < 0.001 .40
temporal pole and left STG
FA values between left
.30
Superior temporal gyrus .20
.10
Temporal pole .00
0 50 100 150 200 250
Dissociative symptom
severity (CDS – 30 scores)
Fig. 3: Visualization of the 2 most outstanding results of the group comparison when using a link-based controlling procedure.
First, (A) patients with depersonalization/derealization disorder (DPD) showed significantly lower fractional anisotropy (FA) be-
tween the right middle temporal gyrus and the right supramarginal gyrus. (B) The FA values within this connection were nega-
tively correlated with dissociative symptom scores across groups, as measured by the CDS-30. Second, (C) relative to controls,
patients with DPD showed significantly lower FA values between the left temporal pole and the left superior temporal gyrus. (D)
Dissociative symptom severity correlated negatively with FA values of this connection. CDS = Cambridge Depersonalization
Scale; FDR = false discovery rate; MTG = middle temporal gyrus; SMG = supramarginal gyrus; STG = superior temporal gyrus.
J Psychiatry Neurosci 2018;43(5) 353Sierk et al.
between the right middle temporal gyrus and the right served in patients with DPD. In conjunction, these explor-
supramarginal gyrus are characterized by lower mean FA ative findings suggest that the temporal lobe model of DPD9
values in the DPD group, which correlate with dissociative is worth pursuing further.
symptom severity, but not with anxiety or depressive symp- Moreover, potentially lower structural connectivity be-
tom severity. The remaining 7 links do not correlate with dis- tween the right medial OFC and right caudal ACC found in
sociation severity exclusively; some showed significant cor patients was associated with dissociative, anxiety and de-
relations with both dissociation severity and anxiety or pressive symptoms and thus might be of particular interest
depression scores, whereas others did not correlate with from a transdiagnostic perspective. Finally, we further found
either. Using NBS, a trend-level finding points toward con- 5 components pointing toward altered structural connectivity
nectivity alterations in a circuit comprising frontolimbic as in right temporal regions, bilateral frontal and limbic areas as
well as subcortical striatal–brainstem connections, which par- well as in left parietal and occipital cortices in patients with
tially overlap with connections identified when using link- DPD relative to controls. However, no correlations between
based statistics. interregional FA values and symptom severity emerged, so
The results from the link-based controlling procedure are these links seem to be less central to any neurobiological
discussed first. Altered structural connectivity (lower FA) in model of DPD.
patients with DPD relative to controls was found between Patients also showed relatively lower FA than controls be-
the right middle temporal gyrus (MTG) and the right supra- tween the brainstem and the left caudate, which was associ-
marginal gyrus (SMG). In previous studies, lower metabolic ated with dissociative scores as well as anxiety scores. This
rate13 and reduced cortical thickness were reported for the finding seems particularly important as it was also identified
right MTG in patients with DPD relative to controls,12 using NBS: this subnetwork was characterized by higher FA
whereas the SMG has previously been associated with disso- between frontal regions and projections to the amygdala and
ciation in the context of PTSD.61 As part of the somatosensory lower FA values between the amygdala, brainstem and left
association cortex in the parietal lobe, the SMG receives input caudate (Fig. 2). According to the model of frontolimbic dys-
from visual, auditory, somatosensory and limbic structures; balance,14,15 prefrontal cortices are assumed to overregulate
the right hemispheric SMG has been associated with cross- limbic structures,14 resulting in the emotional numbing ob-
modal spatial attention62 and sense of agency.63 The function served in patients with DPD. Albeit only approaching statis
of the MTG is still unclear. It has been associated with con- tical significance in the current sample, this finding supports
ceptual processing64,65 and transmodal integration,66,67 but the frontolimbic dysbalance theory, as we found a trend to-
also with social anxiety68 and hallucinations in schizophre- ward higher structural connectivity (i.e., higher FA) within the
nia.69,70 Considering patients with DPD frequently report left superior frontal gyrus and the right orbitofrontal cortex
symptoms related to impaired integration of different sen- (OFC) and higher connectivity strength between the OFC and
sory modalities as well as somatosensory distortions, altera- the amygdala in the DPD group. The OFC and the basolateral
tions in fibre pathways between the right MTG and right nucleus of the amygdala are important nodes in the limbic cor-
SMG may represent the neuronal underpinnings of failed ticostriatal loop and share many reciprocal connections that
sensory integration necessary for, for example, an intact body have been associated with regulating emotional responses.74
perception in space. Frontolimbic inhibition has been reported in functional con-
Our second prominent finding using link-based analysis nectivity studies in PTSD and its dissociative subtype15 and
indicates lower structural connectivity between the left tem- was confirmed in task-based fMRI in DPD, yet so far only in
poral pole and the left superior temporal gyrus, which is also small samples.17–19 Interestingly, the identified subnetwork also
in relative concordance with previous findings. Hollander comprised connections in which patients with DPD showed
and colleagues10 found increased theta slowing in left temp lower mean FA values (between the brainstem to the right
oral areas in a case study of DPD, and Sierra and colleagues12 amygdala and the left caudate, respectively). Functional syn-
reported a significant correlation between dissociative symp- chronization between the amygdala, caudate and medial pre-
tom scores in DPD with the left inferior temporal gyrus. Fur- frontal cortex has been suggested to subserve active coping
thermore, depersonalization symptoms have been associated with threat.75 Accordingly, altered functional connectivity due
with temporal lobe epilepsy, more often with left-sided foci,6 to altered structural connectivity can be hypothesized to
and with electroencephalography abnormalities above the underlie passive responses to threat, such as dissociation. The
temporal lobe within the context of panic disorder.11,71 The re- primary control centre for internal and external stressors in the
sults of the present study extend these findings by highlight- brainstem is the periaqueductal gray. Its connectivity with the
ing the role of anatomic connections between the left superior central nucleus of the amygdala is suggested to play a role in
temporal gyrus and the left temporal pole. In healthy indi- freezing, a passive threat response, which is suggested to be
viduals, the left superior temporal gyrus has been confirmed the homologue of dissociation in animals.76 Convergently, dis-
to play a role in auditory processing and language compre- sociation in PTSD has been linked to reduced functional con-
hension.72 The temporal pole has been suggested to be an nectivity between the periaqueductal gray and the amygdala,77
amodal “semantic hub,” which is crucial for forming associa- while activation of the caudate and the amygdala has been
tions across distinct attributes.73 It is possible that reduced associated with specific dissociative identity states.78 These dis-
connectivity between these 2 temporal structures underlies tinct brain aberrations may be mediated by altered white
dysfunctional association of multimodal information ob- matter on a network level. Thus, our findings suggest that
354 J Psychiatry Neurosci 2018;43(5)White matter network alterations in patients with DPD
structural alterations in frontolimbic–striatal circuits may con- with DPD, while at the same time emphasizing the role of the
tribute to abnormal fear responses (e.g., emotional numbing) temporal lobes, as suggested by an early conceptualization of
observed in DPD. However, as dissociative symptom severity the disorder.9 We conclude that dysfunctional interaction on
was not significantly correlated with this network’s FA values, a network level as well as abnormal fibre tract connectivity
future studies should carefully explore its role. on a link-based level, may contribute to the heterogenic
As for the question whether the reported group differences symptomatology observed in individuals with DPD, which
are best considered a diathesis for or a result of the disorder, we might also inform a transdiagnostic perspective.
can only speculate. We could not confirm a relationship be- Clinical implications could potentially be drawn from our
tween FA values and duration of illness, but cannot rule out findings in the long-term. One emphasis may lie in strength-
that this is due to the bimodal distribution of the duration of ill- ening multimodal integration and embodiment in DPD. For
ness in our sample. Finally, as our results do not overlap with severe and chronic courses, an interesting consideration on
findings in the same cohort on grey matter alterations,20 we as- doing so refers to the implementation of repetitive trans
sume that altered structural connectivity is best understood as a cranial magnetic stimulation above temporoparietal regions.
primary pathophysiology and not merely a secondary effect of In a first clinical trial, Mantovani and colleagues82 reported
local grey matter volume loss in patients with DPD. significant symptom reduction in 6 of 12 participants after
3 weeks of low-frequency repetitive transcranial magnetic
Limitations stimulation on the right temporoparietal junction, with the
strongest improvement observed in anomalous body experi-
The following limitations need to be considered. First, the ences (71% improvement in responders83). However, having
present study is of a purely exploratory nature; that is, it rep- used an exploratory approach, our results as well as their im-
resents a data-driven approach aimed at theory-building. plications ought to be verified in a confirmatory study.
Second, to ensure ecological validity, we did not exclude pa-
tients with comorbid disorders or patients taking psycho Acknowledgements: This work was funded by the grant II/84051
from the Volkswagen Foundation to H. Walter, the German Research
tropic medication. It remains unclear whether the observed Foundation (DFG) grant DA 1222/4-1 to J.K. Daniels, the EU
alterations in white matter fibre connections represent a risk Rosalind-Franklin Fellowship Program to J.K. Daniels, and the Ger-
factor or a consequence of the disorder due to the cross- man National Merit Foundation grant to A. Sierk. The research of
sectional nature of this study. Finally, general methodological A. Leemans is supported by VIDI Grant 639.072.411 from the Nether-
issues concerning the graph theoretical analysis of diffusion lands Organisation for Scientific Research (NWO). The authors thank
Lea Waller for technical support regarding the usage of GraphVar.
MRI tractography data apply. We used CSD tractography,
which is capable of resolving crossing fibre tracts,79 to recon- Affiliations: From the Charité – Universitätsmedizin Berlin, corporate
struct structural brain networks, decreasing the number of member of Freie Universität Berlin, Humboldt-Universität zu Berlin,
and Berlin Institute of Health, Berlin, Germany (Sierk, Manthey,
false-negative findings.80 However, other difficulties of the Lamke, Kruschwitz, Walter); the Institute of Cognitive Neuroscience,
tracking algorithm, such as modelling different fibre geo University College London, London, UK (Sierk); the Department of
metries and a potential increase of false-positive streamlines, Clinical Psychology, University of Groningen, Groningen, The Nether-
need to be considered. By having included only links for lands (Daniels); the Department of Neurology, University of Gronin-
gen, University Medical Center Groningen, The Netherlands (Kok);
which streamlines have been generated for all participants, the PROVIDI Lab, University Medical Center Utrecht, Utrecht, the
we again reduced the influence of false-positive streamlines Netherlands (Leemans); and the Max Planck Institute for Human Cog-
on the results. However, this procedure may have excluded nitive and Brain Sciences, Leipzig, Germany (Gaebler).
relevant connections for the group contrast. In addition, it Competing interests: J.-P. declares personal fees from BIOTRONIK
should be kept in mind that by using the diffusion parameter SE & Co. KG, outside the submitted work. No other competing inter-
FA as an edge weight for the connectivity matrices, no strong ests declared.
inferences of the state of the anatomic connection between Contributors: J. Daniels, M. Gaebler, J.-P. Lamke and H. Walter de-
any 2 regions of interest can be made. Fractional anisotropy is signed the study. J. Daniels, M. Gaebler and J.-P. Lamke acquired the
modulated by a range of microstructural factors and the indi- data, which A. Sierk, J. Daniels, A. Manthey, J. Kok, A. Leemans and
cation of lower or higher FA values in regard to the degree of J. Kruschwitz analyzed. A. Sierk wrote the article, which all authors
structural connectivity remains unclear.81 Finally, the resolu- reviewed. All authors approved the final version to be published and
can certify that no other individuals not listed as authors have made
tion of the data and FreeSurfer parcellation limits the inter- substantial contributions to the paper.
pretation; e.g., we cannot ascertain which specific subnuclei
of the amygdala and structures of the brainstem are involved References
in the detected network.
1. American Psychiatric Association. Diagnostic and statistical manual
Conclusion of mental disorders (DSM-5®). Philadelphia (PA): APA; 2013.
2. Hunter EC, Sierra M, David AS. The epidemiology of depersonalisa-
This exploratory study is, to our knowledge, the first to re- tion and derealisation. A systematic review. Soc Psychiatry Psychiatr
Epidemiol 2004;39:9-18.
port altered structural connectivity (i.e., FA values) in indi-
3. Michal M, Beutel ME, Grobe TG. Wie oft wird die Depersonalisations-
viduals with DPD compared with healthy controls. Our re- Derealisationsstörung (ICD-10: F48.1) in der ambulanten Versor-
sults support the model of frontolimbic dysbalance gung diagnostiziert? Zeitschrift für Psychosomatische Medizin und
suggested to underlie emotional numbing in individuals Psychotherapie 2010;56:74-83.
J Psychiatry Neurosci 2018;43(5) 355Sierk et al.
4. Baker D, Hunter E, Lawrence E, et al. Depersonalisation disorder: 28. Fornito A, Zalesky A, Breakspear M. Graph analysis of the human
clinical features of 204 cases. Br J Psychiatry 2003;182:428-33. connectome: promise, progress, and pitfalls. Neuroimage 2013;80:
426-44.
5. Michal M, Adler J, Wiltink J, et al. A case series of 223 patients with
depersonalization-derealization syndrome. BMC Psychiatry 2016; 29. Griffa A, Baumann PS, Thiran JP, et al. Structural connectomics in
16:203. brain diseases. Neuroimage 2013;80:515-26.
6. Devinsky O, Putnam F, Grafman J, et al. Dissociative states and 30. Zalesky A, Fornito A, Bullmore ET. Network-based statistic: iden-
epilepsy. Neurology 1989;39:835-40. tifying differences in brain networks. Neuroimage 2010;53:1197-207.
7. Ross CA, Keyes B. Dissociation and Schizophrenia. J Trauma Dissoci- 31. Szucs D, Ioannidis JPA. When null hypothesis significance testing
ation 2004;5:69-83. is unsuitable for research: a reassessment. Front Hum Neurosci
8. Daniels JK, Coupland NJ, Hegadoren KM, et al. Neural and behav- 2017;11:390.
ioral correlates of peritraumatic dissociation in an acutely trauma- 32. Gast U, Zündorf F, Hofmann A. Strukturiertes klinisches Interview
tized sample. J Clin Psychiatry 2012;73:420-6. für DSM-IV-dissoziative Störungen (SKID-D): Manual. Hogrefe, Ver-
9. Penfield, W. and T. Rasmussen, The cerebral cortex of man; a clin lag für Psychologie; 2000.
ical study of localization of function. 1950. 33. Wittchen H, Zaudig M, Schramm E, et al. Das Strukturierte
10. Hollander E, Carrasco JL, Mullen LS, et al. Left hemispheric activa- Klinische Interview nach DSM-IV. Beltz: Weinheim; 1996.
tion in depersonalization disorder: a case report. Biol Psychiatry 1992; 34. Mombour W, Zaudig M, Berger P, et al. International Personality
31:1157-62. Disorder Examination (IPDE). Hogrefe Testzentrale, Göttingen;
11. Locatelli M, Bellodi L, Perna G, et al. EEG power modifications in 1996.
panic disorder during a temporolimbic activation task: relationships 35. Michal M, Sann U, Niebecker M, et al., Die Erfassung des Deperson-
with temporal lobe clinical symptomatology. J Neuropsychiatry Clin alisations-Derealisations-Syndroms mit der Deutschen Version der
Neurosci 1993;5:409-14. Cambridge Depersonalisation Scale (CDS). PPmP-Psychotherapie.
12. Sierra M, Nestler S, Jay EL, et al. A structural MRI study of cortical Psychosomatik Medizinische Psychologie; 2004. p. 367-374.
thickness in depersonalisation disorder. Psychiatry Res 2014;224:1-7. 36. Spitzer C, Mestel R, Klingelhöfer J, et al. Screening and measurement
13. Simeon D, Guralnik O, Hazlett EA, et al. Feeling unreal: a PET study of change of dissociative psychopathology: psychometric properties
of depersonalization disorder. Am J Psychiatry 2000;157:1782-8. of the short version of the Fragebogen zu Dissoziativen Symptomen
(FDS-20). Psychother Psychosom Med Psychol 2004;54:165-72.
14. Sierra M, Berrios GE. Depersonalization: neurobiological perspec-
tives. Biol Psychiatry 1998;44:898-908. 37. Hautzinger M, Keller F, Kühner C. Beck-Depressions-Inventar: Re-
vision. 2006: Harcourt Test Services.
15. Lanius RA, Vermetten E, Loewenstein RJ, et al. Emotion modula-
tion in PTSD: Clinical and neurobiological evidence for a dissocia- 38. Laux L, Spielberger CD. Das state-trait-angstinventar: STAI. 2001:
tive subtype. Am J Psychiatry 2010;167:640-7. Beltz Test Göttingen.
16. Lemche E, Anilkumar A, Giampietro VP, et al. Cerebral and auto- 39. Stangier U, Heidenreich T. Die Liebowitz Soziale Angst-Skala
nomic responses to emotional facial expressions in depersonalisa- (LSAS). Skalen für Psychiatrie, 2003.
tion disorder. Br J Psychiatry 2008;193:222-8. 40. Bach M, Bach D, de Zwaan M, et al. Validierung der deutschen
17. Phillips ML, Medford N, Senior C, et al. Depersonalization disor- Version der 20-Item Toronto-Alexithymie-Skala bei Normalper-
der: thinking without feeling. Psychiatry Res 2001;108:145-60. sonen und psychiatrischen Patienten. Psychother Psychosom Med
Psychol 1996;46:23-8.
18. Medford N, Brierley B, Brammer M, et al. Emotional memory in
depersonalization disorder: a functional MRI study. Psychiatry Res 41. Abler B, Kessler H. Emotion Regulation Questionnaire–Eine
2006;148:93-102. deutschsprachige Fassung des ERQ von Gross und John. Diagnostica
2009;55:144-52.
19. Medford N, Sierra M, Stringaris A, et al. Emotional experience and
awareness of self: functional MRI studies of depersonalization dis- 42. Ströhle G, Nachtigall C, Michalak J, et al. Die Erfassung von Achtsam-
order. Front Psychol 2016;7:432. keit als mehrdimensionales Konstrukt. Z Klin Psychol Psychother 2010.
20. Daniels JK, Gaebler M, Lamke JP, et al. Grey matter alterations in 43. Hoyer J. Der Fragebogen zur Dysfunktionalen und Funktionalen
patients with depersonalization disorder: a voxel-based morphom- Selbstaufmerksamkeit (DFS): Theoretisches Konzept und Befunde
etry study. J Psychiatry Neurosci 2015;40:19-27. zur Reliabilität und Validität. Diagnostica 2000;46:140-8.
21. Nicholson AA, Densmore M, Frewen PA, et al. The dissociative 44. Gräfe K. Sheehan Disability Scale (SDS). Angstdiagnostik.
subtype of posttraumatic stress disorder: unique resting-state Springer, Berlin, 2003: p. 158-160.
functional connectivity of basolateral and centromedial amygdala 45. Wingenfeld K, Spitzer C, Mensebach C, et al., Die deutsche Ver-
complexes. Neuropsychopharmacology 2015;40:2317-26. sion des Childhood Trauma Questionnaire (CTQ): Erste Befunde
22. Edelman GM, Tononi G. A universe of consciousness: How matter becomes zu den psychometrischen Kennwerten. PPmP-Psychotherapie·
imagination. 2000: Basic books. Psychosomatik· Medizinische Psychologie, 2010;60: 442-50.
23. Sedeño L, Couto B, Melloni M, et al. How do you feel when you 46. Stanczak DE, Lynch MD, McNeil CK, et al. The expanded trail
can’t feel your body? Interoception, functional connectivity and making test: rationale, development, and psychometric properties.
emotional processing in depersonalization-derealization disorder. Arch Clin Neuropsychol 1998;13:473-87.
PLoS One 2014;9:e98769. 47. Fischl B, Dale AM. Measuring the thickness of the human cerebral
24. Jones DK, Leemans A. Diffusion tensor imaging. In: Modo M, cortex from magnetic resonance images. Proc Natl Acad Sci U S A
Bulte JWM, editors, Magnetic resonance neuroimaging: methods and 2000;97:11050-5.
protocols. Totowa (NJ): Humana Press; 2011 p. 127-144. 48. Leemans A, Jeurissen B, Sijbers J, et al. ExploreDTI: a graphical tool-
25. Tournier J-D, Mori S, Leemans A. Diffusion tensor imaging and box for processing, analyzing, and visualizing diffusion MR data.
beyond. Magn Reson Med 2011;65:1532-56. Proceedings of the 17th Annual Meeting of Intl Soc Mag Reson Med. 2009.
26. Hagmann P, Kurant M, Gigandet X, et al. Mapping human whole- 49. Tax CM, Otte WM, Viergever MA, et al. REKINDLE: robust extrac-
brain structural networks with diffusion MRI. PLoS One 2007;2:e597. tion of kurtosis INDices with linear estimation. Magn Reson Med
2015;73:794-808.
27. Bullmore E, Sporns O. Complex brain networks: graph theoretical
analysis of structural and functional systems. Nat Rev Neurosci 50. Leemans A, Jones DK. The B-matrix must be rotated when correct-
2009;10:186-98. ing for subject motion in DTI data. Magn Reson Med 2009;61:1336-49.
356 J Psychiatry Neurosci 2018;43(5)White matter network alterations in patients with DPD
51. Irfanoglu MO, Walker L, Sarlls J, et al. Effects of image distortions 68. Yun JY, Kim JC, Ku J, et al. The left middle temporal gyrus in the
originating from susceptibility variations and concomitant fields middle of an impaired social-affective communication network in
on diffusion MRI tractography results. Neuroimage 2012;61:275-88. social anxiety disorder. J Affect Disord 2017;214:53-9.
52. Jeurissen B, Leemans A, Jones DK, et al. Probabilistic fiber tracking 69. McGuire PK, David A, Murray R, et al. Abnormal monitoring of
using the residual bootstrap with constrained spherical deconvo- inner speech: a physiological basis for auditory hallucinations.
lution. Hum Brain Mapp 2011;32:461-79. Lancet 1995;346:596-600.
53. Tax CM, Jeurissen B, Vos SB, et al. Recursive calibration of the fi- 70. Onitsuka T, Shenton ME, Salisbury DF, et al. Middle and inferior
ber response function for spherical deconvolution of diffusion MRI temporal gyrus gray matter volume abnormalities in chronic
data. Neuroimage 2014;86:67-80. schizophrenia: an MRI study. Am J Psychiatry 2004;161:1603-11.
54. Jeurissen B, Descoteaux M, Mori S, et al. Diffusion MRI fiber trac- 71. Hayashi K, Makino M, Hashizume M, et al. Electroencephalogram
tography of the brain. NMR Biomed 2017; doi: 10.1002/nbm.3785 abnormalities in panic disorder patients: a study of symptom char-
[Epub ahead of print]. acteristics and pathology. Biopsychosoc Med 2010;4:9.
55. Maier-Hein KH, Neher PF, Houde JC, et al. The challenge of map- 72. Buchsbaum BR, Hickok G, Humphries C. Role of left posterior su-
ping the human connectome based on diffusion tractography. Nat perior temporal gyrus in phonological processing for speech per-
Commun 2017;8:1349. ception and production. Cogn Sci 2001;25:663-78.
56. Gong G, Rosa-Neto P, Carbonell F, et al. Age-and gender-related dif- 73. Patterson K, Nestor PJ, Rogers TT. Where do you know what you
ferences in the cortical anatomical network. J Neurosci 2009;29:15684-93. know? The representation of semantic knowledge in the human
brain. Nat Rev Neurosci 2007;8:976-87.
57. Hasan KM, Alexander AL, Narayana PA. Does fractional anisot-
ropy have better noise immunity characteristics than relative an- 74. Winstanley CA, Theobald DE, Cardinal RN, et al. Contrasting
isotropy in diffusion tensor MRI? An analytical approach. Magn roles of basolateral amygdala and orbitofrontal cortex in impulsive
Reson Med 2004;51:413-7. choice. J Neurosci 2004;24:4718-22.
58. Kruschwitz JD, List D, Waller L, et al. GraphVar: a user-friendly 75. Collins KA, Mendelsohn A, Cain CK, et al. Taking action in the
toolbox for comprehensive graph analyses of functional brain con- face of threat: neural synchronization predicts adaptive coping. J
nectivity. J Neurosci Methods 2015;245:107-15. Neurosci 2014;34:14733-8.
59. Genovese C, Wasserman L. Operating characteristics and exten- 76. Hagenaars MA, Oitzl M, Roelofs K. Updating freeze: aligning ani-
sions of the false discovery rate procedure. J R Stat Soc Series B Stat mal and human research. Neurosci Biobehav Rev 2014;47:165-76.
Methodol 2002;64:499-517. 77. Nicholson AA, Friston KJ, Zeidman P, et al. Dynamic causal mod-
60. Benjamini Y, Yekutieli D. The control of the false discovery rate in eling in PTSD and its dissociative subtype: Bottom-up versus top-
multiple testing under dependency. Ann Stat 2001;29:1165-88. down processing within fear and emotion regulation circuitry.
Hum Brain Mapp 2017;38:5551-61.
61. Harricharan S, Nicholson AA, Densmore M, et al. Sensory overload
and imbalance: Resting-state vestibular connectivity in PTSD and 78. Reinders AA, Willemsen AT, den Boer JA, et al. Opposite brain
its dissociative subtype. Neuropsychologia 2017;106(Supplement C): emotion-regulation patterns in identity states of dissociative iden-
169-78. tity disorder: a PET study and neurobiological model. Psychiatry
Res 2014;223:236-43.
62. Macaluso E, Frith CD, Driver J. Modulation of human visual cor-
tex by crossmodal spatial attention. Science 2000;289:1206-8. 79. Jeurissen B, Leemans A, Tournier JD, et al. Investigating the preva-
lence of complex fiber configurations in white matter tissue with
63. Farrer C, Franck N, Georgieff N, et al. Modulating the experience diffusion magnetic resonance imaging. Hum Brain Mapp 2013;
of agency: a positron emission tomography study. Neuroimage 34:2747-66.
2003;18:324-33.
80. Tournier JD, Calamante F, Connelly A. Robust determination of the
64. Friederici AD, Ruschemeyer SA, Hahne A, et al. The role of left infe- fibre orientation distribution in diffusion MRI: non-negativity con-
rior frontal and superior temporal cortex in sentence comprehension: strained super-resolved spherical deconvolution. Neuroimage
localizing syntactic and semantic processes. Cereb Cortex 2003;13:170-7. 2007;35:1459-72.
65. Wei T, Liang X, He Y, et al. Predicting conceptual processing ca- 81. Jones DK, Knosche TR, Turner R. White matter integrity, fiber
pacity from spontaneous neuronal activity of the left middle tem- count, and other fallacies: the do’s and don’ts of diffusion MRI.
poral gyrus. J Neurosci 2012;32:481-9. Neuroimage 2013;73:239-54.
66. Mesulam MM. From sensation to cognition. Brain 1998;121:1013-52. 82. Mantovani A, Simeon D, Urban N, et al. Temporo-parietal junction
67. Visser M, Jefferies E, Embleton KV, et al. Both the middle temporal stimulation in the treatment of depersonalization disorder. Psychi-
gyrus and the ventral anterior temporal area are crucial for multi- atry Res 2011;186:138-40.
modal semantic processing: distortion-corrected fMRI evidence for 83. Christopeit M, Simeon D, Urban N, et al. Effects of repetitive tran-
a double gradient of information convergence in the temporal scranial magnetic stimulation (rTMS) on specific symptom clusters
lobes. J Cogn Neurosci 2012;24:1766-78. in depersonalization disorder (DPD). Brain Stimul 2014;7:141-3.
J Psychiatry Neurosci 2018;43(5) 357You can also read