Will Climate Change Fertilize the Sahara? - Ten climate researchers report - CliSAP
←
→
Page content transcription
If your browser does not render page correctly, please read the page content below
Will Climate Change
Fertilize the Sahara?
Ten climate researchers report
das cen Will Climate Change
Fertilize the Sahara?
Ten climate researchers report
Das Centrum für Erdsystemforschung und
Nachhaltigkeit ist ein zentrales Forschungs
zentrum der Universität Hamburg und Teil
des Netzwerks KlimaCampus Hamburg.
Hier arbeiten Forscherinnen und Forscher
unterschiedlicher Fachbereiche gemeinsam
an übergeordneten Fragestellungen der
Klima-, Umwelt- und Erdsystemforschung.
Ozeanographie, Meteorologie, Wirtschafts-
und Sozialwissenschaften, Medien- oder
Friedenswissenschaften – für Forschende all
dieser Disziplinen ist CEN ein Forum, um
sich auszutauschen, neue Projekte auf den
Weg zu bringen und ihre Ergebnisse an
Politik und Gesellschaft zu vermitteln. Stories of earth system research made in Hamburg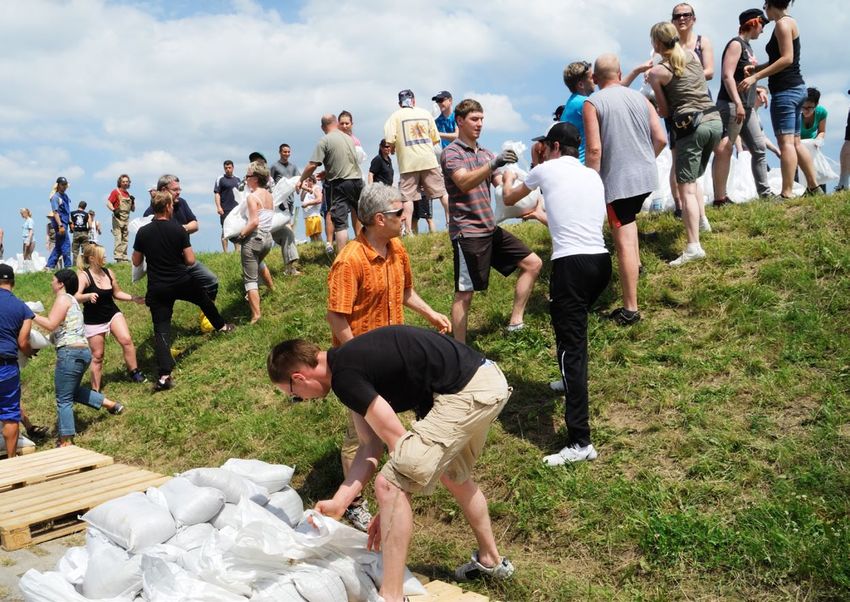
content the latest news from climate
research
4 climate-aware behaviour
10 flood warning
14 green deserts Will climate change turn the Sahara Desert into a green para
22 arctic ice dise? This seeming paradox—as climate change is mainlyasso
28 deep waves ciated with droughts and extreme weather—may become a
reality due to increasing carbon dioxide levels. Researchers
32 syria
from Universität Hamburg’s Center for Earth System Research
36 pearl river delta
and Sustainability (CEN) are investigating various climate
42 company value phenomena and developments. Across the world, the many
48 extreme weather faces of climate change and its ramifications differ greatly—
54 detective’s work often taking rather unexpected turns. This compilation pro
vides an insight into work at the CEN. It explains, for instance,
how old snow impacts the Arctic and elucidates the role of
climate change in the Syrian conflict.
Once a month, our researchers’ guest contributions to the
Hamburger Abendblatt take you on an intriguing journey
into climate science. Ten of these articles can be found on the
following pages.
Enjoy our selection!
2 3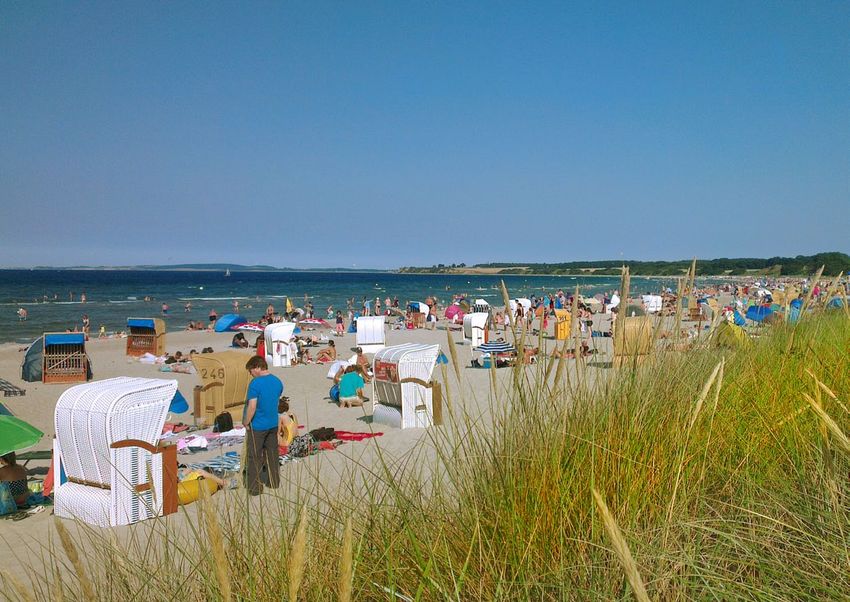
Parents, the Media or Al Gore –
Who Shapes our Ideas About the
Climate?
The IPCC’s Fifth Assessment Report has turned the
media’s attention back to climate change. Almost
every newspaper and countless magazines and tele
vision and radio stations covered it, not to mention
all the discussions on the internet. But how does the
media affect people’s attitudes towards climate and
their behavior?
To find this out, we conducted over 40 detailed interviews
with citizens of Hamburg as part of a project of Universität
Hamburg‘s Cluster of Excellence CliSAP. We chose our inter
viewees to cover as broad a range of attitudes on climate
change as possible. It was also important to have a cross-
section of Hamburg’s populace: young and old, men and
women with various levels of background knowledge of the
subject and from different neighborhoods.
The interviews show that different experiences affect
our understanding of and attitude towards climate change.
4 climate-aware behaviour Klimaschutz 5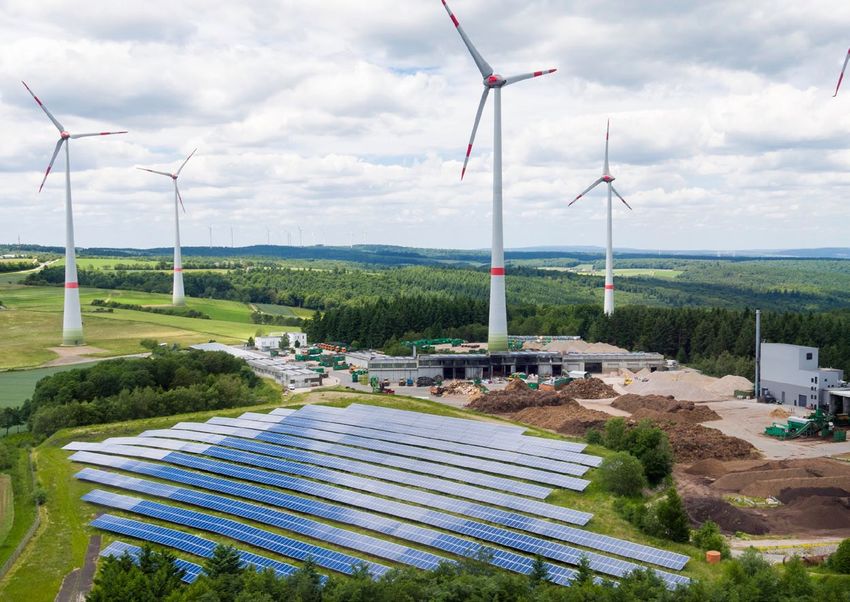
Most of those interviewed consider the media to be the most lem has been heightened by an environmental disaster or
important source of information for learning about climate by a film which has prompted them to make their behavior
change. According to our findings, however, the media is more climate friendly. One film that was often mentioned was
less important when it comes to behavior and awareness Al Gore’s “An Uncomfortable Truth”.
of the issue. Interpersonal communication has a far greater The other types all doubt that humans are to blame for
influence—especially discussions with parents, friends or at climate change and as such do not exhibit climate-aware
school. In addition, personal experiences affect whether or behavior. On the one hand, these are people who use tradi
not people consider climate change to be a problem. Extreme tional media, who aren’t interested in the subject and don’t
events such as heat waves and flooding were frequently men look for information on it. They are often older people who
tioned. hardly use the internet. But the group also includes those
Our interviews showed a clear pattern, enabling us to who are skeptical of the mass media and mistrust newspaper,
identify various types characterized by their media use and radio and television reports. They look for alternative sources
communication behavior. The most common type uses a wide of information such as internet forums and blogs. We are cur
range of media and formats to obtain information on c limate rently carrying out a survey of over 1,000 people to look at how
change and discusses the topic with friends and family.They often the individual types occur in the community.
are convinced that humans are responsible for c limate change,
and so they are climate-aware in their actions.
There are three other types who share this view and
whose behavior is also climate-aware: The first group are
those who read specialist media and watch science programs
and who do internet research and discuss the topic. The sec
ond group gets their information from social media platforms
like Facebook and also uses them to communicate, while the Ines Lörcher conducts research on climate change reception and commu
third group includes people whose awareness of the prob nication at Universität Hamburg‘s Cluster of Excellence CliSAP.
6 climate-aware behaviour climate-aware behaviour 7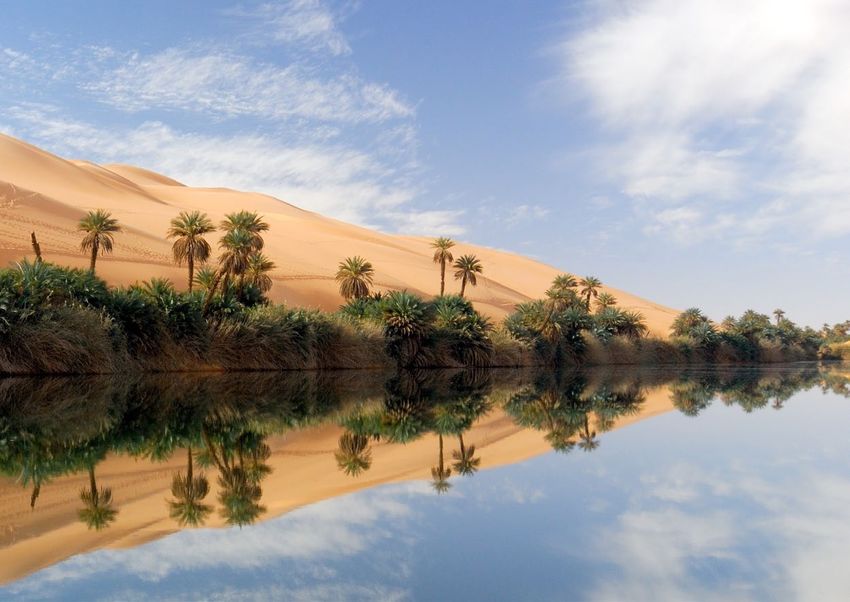
8 zeigerpflanzen zeigerpflanzen 9
Scientific Models Help Evacuate
Flooded Areas
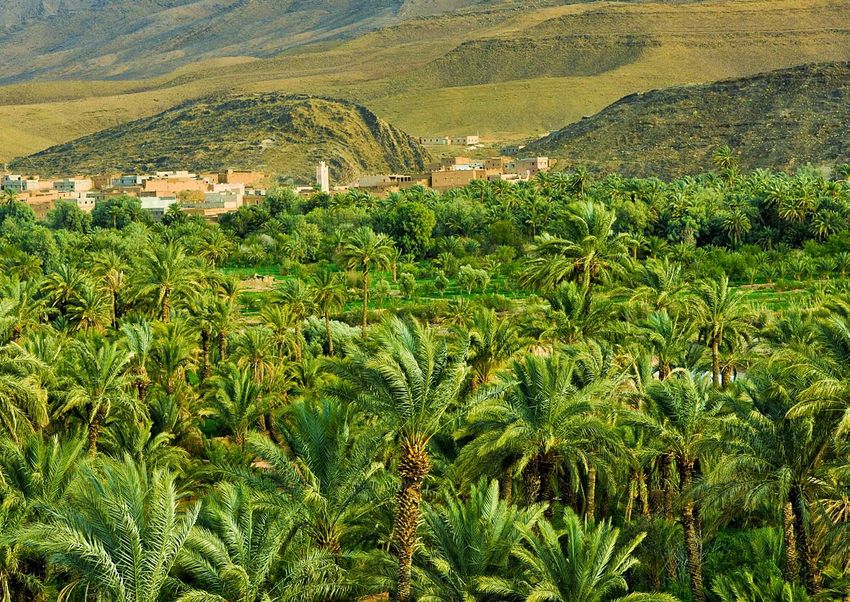
Flood warning! In the event of a storm surge warn
ing, people living in at-risk coastal areas may have
to be evacuated. But who can stay, and who needs
to go? Misjudging the impacts could have serious
consequences.
My new computational model could soon help to more accu
rately predict which areas will actually be flooded. This could
be especially important in the future, since rising sea levels
could make major storm surges a more frequent occurrence.
Ordering an evacuation is a radical step. Nevertheless,
since safeguarding human lives has to remain the top priori
ty, no area is too small to be evacuated. At the same time, an
evacuation is a costly affair, and the larger the area, the higher
the costs. Further, if a predicted surge ultimately turns out
to be comparatively harmless, “needless” wide-scale evac
uations can breed frustration among those affected. If this
happens more than once, they may lose their faith in flood
warnings in general. As such, predicting the affected area as
precisely as possible is extremely important.
10 flood warning zeigerpflanzen 11
At Universität Hamburg’s Center for Earth System In contrast, the correction takes a different approach to
Research and Sustainability, my colleagues and I are working the wave’s length, so I could add it to my computational model
to develop mathematical models that will allow us to accu fairly easily. That being said, it’s also relatively new and there
rately simulate these extreme scenarios. The shallow water fore not as established as its predecessor – and its depiction
equations, mathematical formulas that describe the physical of physical phenomena is less precise.
movements of water under simplified conditions, form part To compensate for this problem, I have adapted the cor
of the basis of our models. But for the constantly changing rection so that it can better describe physical processes. The
processes on coastlines, they aren’t sufficiently precise, which results of an initial comparison for a simple scenario were
means I also need to take the length of the inbound wave into amazing: My “new and improved” correction yielded exactly
account. Shorter waves disperse more slowly; longer ones the same results as the Boussinesq approximation. That
do so more rapidly. In order to more realistically simulate means in the future, we’ll have a more flexible mathemati
when the waves will hit the coast and how large they’ll be cal tool that promises more accurate predictions of coastal
when they get there, I want to add this aspect to the calcu flooding.
lations.
There are two different formulas that can help me
describe the influence of the wave’s length: The Boussinesq
approximation and a more recent correction. Since each has
its own strengths and weaknesses, which one is better suited
to my model? The Boussinesq approximation is definitely the
safer bet: First proposed in 1872, it’s been frequently used ever
since and does a good job of describing the relevant physical
processes. On the other hand, its depiction of the influence of
Anja Jeschke is investigating equations for shallow water waves at
the wave’s length is so complex that there’s no way it could be Universität Hamburg’s Center for Earth System Research and
flexibly integrated into my model. Sustainability.
12 flood warning flood warning 13
14 zeigerpflanzen zeigerpflanzen 15

Will Climate Change Fertilize
the Sahara?
A few thousand years ago, the Earth’s climate was
quite different. Some regions were warmer and
moister—and the Sahara was considerably greener.
A lush canopy of plants drew water from the soil and
“sweated” it back out, which produced monsoons on
a regular basis.
But, over the course of millennia, the Earth’s orbit changed,
and with it the sun’s influence on the climate. This also
impactedthe Sahara: the monsoons ended and the vege
tation gradually disappeared. Today the Earth is growing
warmeragain. The cause: the greenhouse effect, which has
been intensified by our use of fossil fuels, releasing more and
more CO2 into the atmosphere. The increased CO2 levels are
warming the Earth—and far more than thousands of years
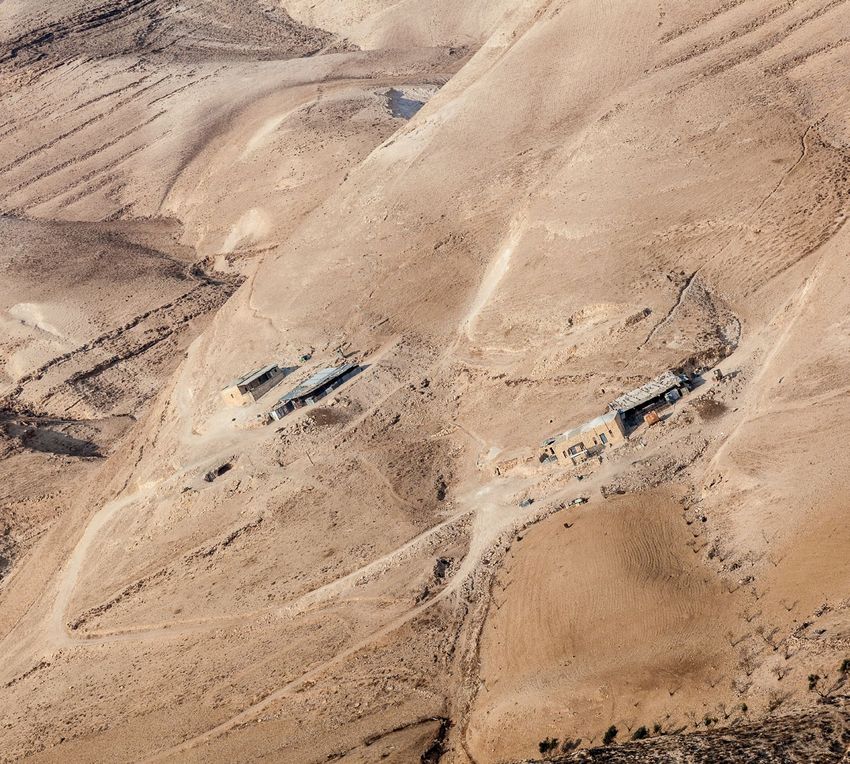
ago. The question is: with a warmer climate, will vegetation
return to the Sahara?
My colleagues at Universität Hamburg’s Cluster of Excel
lence CliSAP and I have explored this question with the help of
three different climate models. The projections indicate that,
16 zeigerpflanzen green deserts 1718 zeigerpflanzen zeigerpflanzen 19
through the end of the 21st century, the central and western have plenty of water, these pores are wide open, allowing
Sahel, as well as the southern edge of the Sahara,actually will them to absorb a great deal of CO2. At the same time, some
become greener. Nevertheless, the equation “warm climate water is released through the pores and evaporates, which
= green desert” doesn’t really work, because the increased cools their immediate vicinity. In contrast, plants surrounded
vegetation is not only a result of the higher temperatures; by CO2-rich air only need to open their pores slightly; higher
two of our three models indicate that it is primarily due to the CO2 levels mean less evaporation. The effect: the air close to
higher CO2 concentrations in the atmosphere. the ground grows warmer. Further, vegetation is darker and
Plants need carbon dioxide: they “breathe” it in and, with absorbs more sunlight than bright desert sand. This intensi
the help of sunlight and water, convert it into building mate fies the warming—bad news for heat-sensitive plants.
rials for their cells. In theory, then, more CO2 should promote Even if the different models portray this complex inter
more vegetation in the Sahel zone. But our calculations show play in different ways, we can say the following: it’s quite pos
that major sections of this region will also become more arid sible that the “ CO2 fertilization” will lead to the formation of
in the wake of climate change. This will harm the plants, a green belt in the Sahara. But if so, it most likely won’t last
which need water in order to process the CO2. So we see two for long; at some point, the heat and lack of water will gain
opposing effects: more CO2 “fertilizes” plants, but higher tem the upper hand and the vegetation will dwindle once again.
peratures dry them out.
In order to better grasp this interaction, we examined
the two factors again separately—unfortunately with mixed
results. In some models CO2 is the decisive factor for increased
vegetation growth at the edges of the desert regions; in others,
only those regions in which the precipitation and temperature
conditions were conducive from the outset will become greener.
In this regard it’s important to know that plants take in Prof. Martin Claußen is a meteorologist at Universität Hamburg and
carbon dioxide through tiny pores in their leaves. When plants Director of the Max Planck Institute for Meteorology.
20 green deserts green deserts 21old snow obstructs arctic sea ice
measurements
Twenty-four hours a day, satellites survey the Earth,
providing tremendous amounts of data. Hidden in
these mountains of figures lies a wealth of infor
mation. Yet before that information can be put to
use, climate researchers need to first uncover and
decode it.
In the course of this work, we sometimes stumble across a
“mother lode”—just like we did in my recent discovery con
cerning Arctic ice. Changes in the ice cover of the ArcticOcean
are an important indicator of climate changes. For years
now, the area covered by ice has steadily declined, and many
researchers fear this trend can no longer be reversed—which
would have far-reaching consequences for our climate sys
tem. As such, this region has been monitored by satellites for
more than 35 years. But how thick is the ice we see? After all,
the thickness of the ice tells us more about its total volume,
and therefore about its longevity, than its area does.
Since late 2010 we at Universität Hamburg’s Center for
Earth System Research and Sustainability have been able to
22 arctic ice zeigerpflanzen 2324 zeigerpflanzen zeigerpflanzen 25
measure ice thicknesses of up to one meter with the help of no longerapplies. But how can we measure snow cover? Until
the SMOS research satellite, marking a major advance. The now, researchers have had to resort to outdated maps and
satellite can sense and measure the natural radiation pro could only make rough estimates.
duced by all bodies—including the ocean and the sea ice on its While integrating a formula for the snow cover into our
surface. In the course of its long journey into space, this radia computer model, I discovered an unexpected solution in the
tion is constantly diverted and reflected. As a result, only part SMOS data. At exactly the point where SMOS runs into its lim
of the energy reaches the satellite, which receives a modified itation—namely, for thick ice—the formula delivers values for
signal. This effect is most prominent at transition points, e.g. the thickness of snow cover. The expeditions with observa
at the transition from ocean to ice, or from ice to air. First we tional flights over the Arctic so far have confirmed these val
use computer models to describe the physical processes at the ues—a real success, as now for the first time I will be able to
respective boundaries; we then use the values to determine create comprehensive and up-to-date snow-cover maps. The
the distance between those boundaries—e.g. to arrive at the next challenge will then be to determine whether or not these
thickness of a layer of ice. maps can actually be used for the CryoSat calculations, which
SMOS also gets a helping hand from the CryoSat-2 satel would allow us to more accurately monitor and comprehend
lite. Whereas SMOS’s “visual depth” of up to one meter can changes in ice volume in the Arctic.
be used to accurately measure the thinner edge areas of the
sea ice, the CryoSat-2 is the expert when it comes to thicker
ice. Unlike SMOS, it uses radar to measure how far the ice pro
trudes out of the water. Since we know that only ten percent
of sea ice is above water and the remaining ninety percent is
underwater, we can then calculate the total thickness. How
ever, this method can only work if the current snow condi
Dr. Nina Maaß investigates how to best measure Arctic sea ice via
tions are also taken into account; masses of snow can weigh satellite at Universität Hamburg’s Center for Earth System Research and
the ice down to such an extent that the normal 90:10 ratio Sustainability.
26 arctic ice arctic ice 27“deep waves” affect ocean currents and the climate If you look at a quiet sea on a warm summer evening, it’s hard to imagine that our oceans are actually never at rest. Three factors keep them in constant motion: the wind that the water produces on its surface; dif fering temperatures and levels of salinity in the ocean, as a result of which the colder, heavier water masses sink deeper and warmer water takes their place; and lastly the tides, which are created because the Earth’s rotation and the gravitational forces produced by the sun and moon keep the seas in motion. All three movement patterns help to shape our climate, as ocean currents are important “conveyor belts” for heat and energy. For example, the Gulf Stream moves heat from the Gulf of Mexico to Europe’s North Sea, ensuring we enjoy mild temperatures. Unlike the wind, which merely mixes up the upper layers of the seawater, or sinking masses of colder water, which can only be found in certain regions, tidal move ments affect the ocean as a whole—and they can be felt all the way down, to ocean depths of several thousand meters. 28 deep waves zeigerpflanzen 29
The nature of the ocean floor is what makes it so diffi model to calculate the associated energy dissipation. The
cult to predict these movements for the purposes of climate results tell us how tidal energy is distributed across the ocean,
models—our oceans not only display different depths, but which routes it follows, and whether climate-relevant ocean
are also riddled with countless trenches, ridges and slopes. currents are tending to grow stronger or weaker.
When a tidal wave encounters one of these obstacles or sim We’ve come a long way since the 1970s: With very few
ply sweeps along the ocean floor, it is slowed, divided, redirect exceptions, we now have comprehensive data on the topog
ed or in some cases even accelerated—e.g., when the water raphy of the ocean floor, coupled with detailed tidal obser
has to pass through a narrow chasm. vations on the surface. At the same time, today’s models are
The range and energy of these “deep waves” and their sufficiently powerful to combine these two types of data,
interaction with the ocean floor represent important parame allowing them to represent the complex patterns of energy
ters for climate research, as they have a considerable influence distribution and movement in the ocean better and better.
on currents and heat transfer in the ocean—and the climate If we can successfully integrate these findings into global
in the process. At the same time, they are also connected to climatecalculations, it will mean a major step forward.
rising sea levels. The very first climate model ever developed
in Hamburg (in the 1950s) was a tide model for the North Sea.
Nevertheless it wasn’t until the 21st century that internation
al research groups were able to develop models to simulate
these processes on a global scale.
At Universität Hamburg’s Center for Earth System
Research and Sustainability we have now for the first time
systematically compared and assessed these global tide
models. The result: global maps that show where and how
different tidal patterns overlap, and where the energy input is Prof. Detlef Stammer is an oceanographer and Director of Universität
especially high or low. In a second step, we used our HAMTIDE Hamburg’s Center for Earth System Research and Sustainability.
30 deep waves deep waves 311.5 million syrian peasants displaced due to drought Northeastern Syria used to be one of the most produc tive agricultural regions in the Middle East. From 2006 until 2010, however, the area endured one of the most devastating droughts in recorded weatherhistory. Water scarcity caused crop failures and increasing food prices. Mostly subsisting on small-scale family-run farms, the tradi tional population was unable to cope with these problems. Yet, the people were left to their own devices as the autocratic government had hardly taken any precautions and offered no suitable disaster response and contingency plan. In science such situations are associated with a lack of resilience. This particular case exemplifies the inability to adapt to climatic and economic change. Due to the drought 1.5 million peasants and livestock breeders lost their livelihoods and migrated to less affected regions of the country. Numerous refugee fami lies have settled in southern Syria for now. In March 2011, the first voices against the regime of Syria’s president Baschar al Assad were raised there. These protests grew into a full-blown 32 syria zeigerpflanzen 33
civil war that continues today. A large number of northern East. Although drought periods have always formed part of
migrants have thus been fleeing further towards Jordan, Tur the local climate, observations prove that Mideastern win
key, and Lebanon—this time as war refugees. ters have been significantly drier in the past twenty years
As a peace researcher at Universität Hamburg’s Center than in the eighty years before. Researchers expect precipita
for Earth System Research and Sustainability I aim to find out tion in northern Syria to decline by a further twenty percent,
what factors geared these Syrian migration waves; in particu and the mean temperature to increase by four degrees centi
lar if and to what extent environmental refugees participated grade until the end of the century.
in protest activities. The results may explain why climate Resources and an improved infrastructure are necessary
change and its impacts should generally be assessed as driv to effect successful returns of Syrian smallholders to their
ing forces behind conflicts. In 2014, I spent four weeks in homes. Efficient water use and alternative sources of income
Jordanian refugee camps and interviewed thirty Syrian fam would help returnees adapt to climate change. One thing is
ilies, some comprising up to thirty-five individuals. Among certain: whoever will reign in Syria after the war will also have
other things, I inquired whether water supplies and crops to tackle the repercussions of global change.
underwent changes during the drought years and how this
influenced the families’ decision to flee. Moreover, I asked if
environmental refugees dared to engage directly in the upris
ing. Accordingly, facing a major predicament and experienc
ing tremendous anxiety, the refugees did not protest them
selves. Nonetheless, recurrent drought periods combined with
a severe lack of political support have fuelled social unrest.
Many Syrian refugees are planning to return to their
native land and resume farming as soon as the rioting ends.
Dr. Christiane Fröhlich is a researcher at Universität Hamburg’s Center
But the Intergovernmental Panel on Climate Change (IPCC) for Earth System Research and Sustainability. Her main topics are climate
warns against climate change ramifications in the Middle change, migration and conflicts.
34 syria syria 35flooding threatens
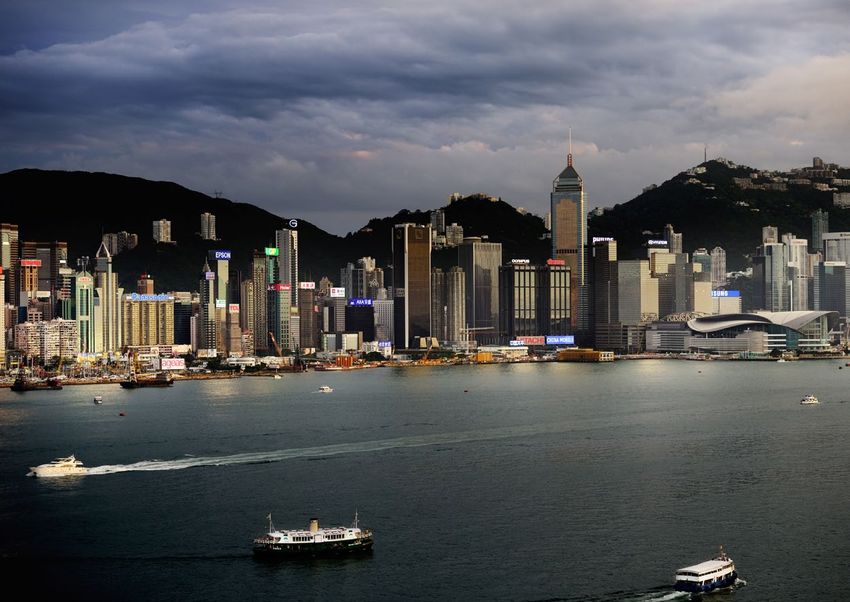
southern china’s pearl river delta
In southern China’s Pearl River Delta, eleven cities are
currently merging to form one huge megacity. But as
a result of investments from Hong Kong and Taiwan,
over the last three decades the once rural area has
been transformed into a booming factory for export
goods—and an area about the size of Lower Saxony is
now home to a population as large as Great Britain’s.
Today, the monsoon climate is already hard on the people
living there. Compared to Hamburg, there is more than twice
as much rainfall, most of which is concentrated in the six
monsoon months. The damaging effects of regular flooding
are further exacerbated by paved surfaces and channelized
riverbeds. In addition, recurring typhoons lash the land with
meter-high waves of seawater.
Will climate change worsen these threats? What adapta
tion strategies are available? This is the subject of my research
at Universität Hamburg’s Cluster of Excellence CliSAP. Using
historical measurements from the delta and a simulation
model from the Max Planck Institute for Meteorology in
36 zeigerpflanzen pearl river delta 3738 zeigerpflanzen zeigerpflanzen 39
Hamburg, I determined future scenarios for temperature, a particularly interesting example. The peninsula facesserious
precipitation, sea level and tropical cyclones. According to risks—but as a business and financial metropolis also has the
these scenarios, the average temperature in the delta will resources to take suitable preventive measures.
rise by up to three degrees in the 21st century. Precipitation How will flood protection in the delta have to be adapted?
will become more extreme, i.e., more often unusually light Apart from conventional solutions like levees, the region
or heavy. If greenhouse gas emissions go unchecked, the sea above all needs “soft measures” that promote awareness
level could rise by up to a meter compared to the 2005 mark. of the dangers: A jointly developed climate strategy, more
The result: The delta will experience more frequent and reliable weather forecasts, and official recommendations on
more severe flooding from the river, but also from the tides in what to do in case of a flood. Last but not least, social media
the South China Sea, since almost eight percent of the area is could be used to provide real-time flood information.
three meters above sea level or less. And it is precisely here—
in the flatlands—that the major industry and cities are locat
ed. The new coastal zones created through land reclamation
are particularly at risk.
But floods will have different impacts in different places.
Depending on their location and structure, cities vary in terms
of their vulnerability. On the basis of statistical data, I first esti
mated the likelihood of flooding, which depends, for exam
ple, on an area’s height above sea level. In order to rate a city’s
susceptibility to flooding, among other things I analyzed data
on the population structure. The young, the elderly and the
unemployed are especially at risk. I then considered the ability
of cities to adapt to the flood risk. This can be determined on Dr. Liang Yang is a geographer at Universität Hamburg’s Cluster of
the basis of social aspects like per capita income. Hong Kong is Excellence CliSAP.
40 pearl river delta pearl river delta 41High levels of CO2 emissions
reduce company value
Since the introduction of the European emissions
trading, CO2 has had its price: Companies with par
ticularly high emissions have to buy emissions certif
icates—that is the right to emit CO2. Climate-friendly
companies, however, can sell certificates, thus making
additional profits.
But does emissions trading really change anything for compa
nies? Theoretically, CO2 certificates are meant to provide an
incentive for more climate-friendly production. However, this
only works when they prove to be a profit or a loss—if emis
sion allowances are too cheap, the incentive gets lost. It is also
a problem if the companies simply pass on their increased
CO2 costs to consumers. Then, the customers pay the price for
excessive emissions. As scientific studies have shown, this is
the case in the energy sector.
At CEN, my colleague Nicolas Koch and I have examined
for the first time whether CO2 emissions do influence the val
ue of companies. In contrast to annuallypublished balance
sheets, the company value also reflects expectations for the
42 company value zeigerpflanzen 43future. If the company is well-prepared for future challeng In our study, we have analyzed data from more than 450
es, which may arise from climate policy, this allows for good power plants and simulated two scenarios: What happens
conditions for a high value. In order to calculate this, we have if providers replace their old plants with plants of the same
looked at several major providers: What kind of electricity mix type? And what happens if they invest in low-emission tech
does the company produce? Carbon, gas or renewables? How nologies instead?
modern are its power plants? We were particularly interested The companies‘ self-defined emission targets served as
in the question whether investments in low-emission tech our calculation basis. Additionally, we have incorporated some
nologies would pay off. further factors into both scenarios, such as commodity prices,
As a matter of fact, electricity providers are now forced to plant life and increase in CO2 prices. The result: the company
tackle this question themselves, for numerous power plants value suffers clearly when emissions are too high. In 2020, the
are aged and call for modernization. Designed for long life value of companies who take their emission targets serious
spans new plants are very cost-intensive, so investment deci ly will be 26 percent higher than when failing to reduce emis
sions require careful planning. sions, due to the expected price development for CO2 certif
Also, it is essential to control the future distribution of icates. In other words: investments in low-emission power
free energy certificates while fostering certificate auctions. production are not only climate-friendly, but make good eco
The so-called grandfathering has already been abolished. A nomic sense, provided that the statutory provisions continue
company’s eligibility for free certificates is no longer assessed to be stable.
based on its past emissions, but rather on benchmarks corre
sponding with CO2 emissions of the most energy-efficient
plants in the respective European sector. The more CO2 emis
sions, the more energy certificates plant owners must buy—
clearly, CO2 mitigation through climate-friendly technolo
Prof. Alexander Bassen investigates how climate change relates to
gies is the key to the best deal. This will certainly boost CO2 society at Universität Hamburg’s Center for Earth System Research and
certificate prices. Sustainability.
46 company value company value 47climate formulas: even extreme
weather follows rules
Extreme weather phenomena like disastrous monster
waves, typhoons, and 100-year floods seem unpre
dictable. In order to make them foreseeable, climate
researchers aim to translate them into strict mathe
matical formulas.
This goal is part of my research focus in applied mathematics
and theoretical meteorology at Universität Hamburg’s Cluster
of Excellence CliSAP. Extreme weather events share three com
mon characteristics: They are rare, deviate significantly from
mean values, and have tremendous ramifications for nature
and societies. In a nutshell, extremes are atypical which makes
them difficult to trace. Thus, statistics are crucial.
There are two approaches to determining extreme val
ues such as regional flood risks. One method focuses on pin
pointing the record water level per decade. This allows us
to analyze one single value for each time unit. Hence, oth
er aberrant high water levels occurring during the investi
gation period remain unconsidered. The second method, by
contrast, takes into account all extreme values that exceed a
48 extreme weather zeigerpflanzen 49certain limit. As a result, ten-year periods may indicate a ran
dom number of flood events or none at all. The outcomes of
both approachescan be converted into curves depicting the
frequency of certain extreme water levels.
Interestingly, all probabilities thus determined match
one of four long-known standard curves—each named for
the scientist who discovered it: Gumbel, Fréchet, Weibull und
Pareto. So, even extremes are ruled by laws that enable us
to establish the probability of future events. This is of great
interest not only to climate researchers, but also to engineers,
insurers, or finance experts. How high must dams be built to
withstand floods within the next one hundred years? What
financial losses due to major fires must be expected? How
likely is a stock market crash?
A fundamental shortcoming of the above methods is
their basic assumption that our climate system is invariable.
Quite the contrary, our global climate depends on numerous
external factors and is undergoing constant change. There
fore, I am collaborating with colleagues in France, Portugal,
and Great Britain in order to find out how to incorporate
climate change data into our extreme value distribution for
mulas. It is an incontrovertible fact that, as regards frequen
cy, intensity, and spatial distribution, even the most chaotic
weather follows universal laws. Researchers specializing in
50 zeigerpflanzen extreme weather 51extremes examine these patterns as if through a magnify ing glass. Events are more forceful and visible during unusual weather conditions. Thus, extremes are highly useful to cli mate research. They elucidate how a system—in our case the climate—behaves in principle. Prof. Valerio Lucarini is a theoretical meteorologist who worked at Universität Hamburg’s Cluster of Excellence CliSAP from 2011–16. 52 extreme weather zeigerpflanzen 53
csi climate change: in search of freak values calling for clarification. Hence, we post a “Most
co2 rivals Wanted” notice.
A prime suspect has already been identified. The relentless
rise of the greenhouse gas CO2 may explain the warming effect
The temperature curve for the Baltic Sea region throughout the year. But how do we prove this? Computer-
shows a clear trend. It indicates a rise by up to two generated climate models can lead us onto the right track.
degrees Celsius over the past thirty years. How did this These simulations provide suggestions as to what increases
happen?Looking for clues, climate researchers must in temperature may derive from higher CO2 levels. In the cur
focus on the recent past. rent case our modeling reveals that—regarding the winter
and spring months—CO2 may indeed be the sole culprit.
In doing so, we proceed just like criminal investigators facing Nonetheless, we cannot close our case yet. The estab
a tricky case: The wealthy Countess Celsius is lying dead on lished rise in summer and fall temperatures since 1980 is too
the floor. Did she die of natural causes or was she murdered? high. According to CO2-driven computer models it ought to be
Similarly, climate change detectives will ask if the Baltic Sea lower; ergo we must conclude that CO2 cannot be held respon
area’s temperature increase is due to natural fluctuations or sible alone. It still remains a mystery what other factors con
external factors. tributed to those unusually warm months.
In collaboration with my colleagues from Universität For that reason, we go on tracing further evidence. We
Hamburg’s Cluster of Excellence CliSAP, I start this climate suspect that tiny dust and dirt particles in the air may also play
murder investigation by analyzing all temperature measure a major role. These so-called aerosols reflect the sunlight and
ments since 1980. We document the scene and collect poten block out incoming light like sunshades, thus cooling the bot
tial evidence. If our data can merely be attributed to regular tom layers of the Earth’s surface. Moreover, the particles facil
variations, we do not have a case, meaning that the Countess itate the formation of clouds—a way of cooling by obscuring.
simply died from decrepitude. But as it turns out, the sum So, aerosols act as a brake on temperature. Presumably, this
mer and fall as well as the average annual temperatures are mechanism is particularly efficient in summer and autumn.
54 detective’s work detective’s work 5556 zeigerpflanzen zeigerpflanzen 57
In the course of the massive industrialization of the Baltic
Sea region, the aerosol concentration in the air had increased
significantly. We can therefore deduce that up until the 1980s,
aerosols mitigated the warming effect in the Baltic area.
Apparently, the pollution of the environment reduced regional
climate change impacts for a while. Things changed, however,
when the clean air policy became effective in the eighties. As
manufactured aerosols became less used, their summer and
fall cooling effects decreased as well. This revelation demysti
fies the immense rise in temperatures over the past decades.
Our murder case seems solved now. Carbon dioxide has
been found guilty of warming the temperature in the Baltic
region. We proved the following: until the 1980s, Countess
Celsius could still rely on servants that, at first glance,
appeared ill-suited to compensate any temperature-related
predicament. Rather paradoxically, abundant aerosols allevi
ated our fragile lady’s heat exhaustion by cooling the air, espe
cially in the summer and fall. As soon as they started dimin
ishing, she grew increasingly defenseless…
Prof. Dr. Hans von Storch is a researcher at Universität Hamburg’s Cluster
of Excellence CliSAP. Until 2015 he was Director of the Institute of Coastal
Research at the Helmholtz-Zentrum Geesthacht (HZG).
58 detective’s work zeigerpflanzen 59Image credits
©iStock.com/Pavliha (cover), ©iStock.com/aghezzi (cover, p. 1), ©iStock.com/
SlobodanMiljevic (p. 5 a.), ©UHH/CEN/M. Zapf (p. 5 b.), ©iStock.com/
Philartphace (p. 8/9), ©picture alliance/dpa/Jens Wolf (p. 11 a.), ©iStock.com/
SteveAllenPhoto (p. 11 b.), ©iStock.com/DZarzycka (p. 14/15), ©NASA - NASA
Goddard Space Flight Center Image by Reto Stöckli (p. 16 a.), ©Von Wolken
kratzer - Eigenes Werk, CC BY-SA 3.0, https://commons.wikimedia.org/w/
Published by
index.php?curid=29418750 (p. 16 b.), ©iStock.com/Seqoya (p. 18/19),
Center for Earth System Research and Sustainability (CEN),
©Alfred-Wegener-Institut/Mario Hoppmann, CC-BY 4.0 (p. 23 a.),
Universität Hamburg
©NASA‘s Scientific Visualization Studio (p. 23 b.), ©NASA Earth Observatory
www.cen.uni-hamburg.de
image by Jesse Allen, using EO-1 ALI data provided courtesy of the NASA EO-1
team, CC BY-NC-ND 2.0 https://creativecommons.org/licenses/by-nc-nd/ Editorial staff
2.0/legalcode (p. 24/25), ©iStock.com/HadelProductions (p. 29), Julika Doerffer, Stephanie Janssen, Ute Kreis,
©“Close to Aleppo, Syria” by Jurgen, https://flic.kr/p/5DtPgv, CC BY-NC-ND Franziska Neigenfind and Lisa Wolf.
2.0 https://creativecommons.org/licenses/by-nc-nd/2.0/legalcode (p. 33 a.), Center for Earth System Research and Sustainability (CEN)
©iStock.com/aliunlu (p. 33 b.), ©iStock.com/Joanna-Palys (p. 36),
Design
©iStock.com/olaser (p. 38/39), ©iStock.com/Bim (p. 43), ©iStock.com/ollo
HAAGEN design, Hamburg
(p. 44/45), ©Alessandro Pavone (p. 49 a.), ©By Trocaire from Ireland -
DSC_0974, CC BY 2.0, https://commons.wikimedia.org/w/index.php? Print run: 1,500 copies
curid=29660143 (p. 49 b.), ©iStock.com/rusm (p. 50), ©iStock.com/gece33
Hamburg, 2017
(p. 53 a.), ©iStock.com/hernan4429 (p. 53 b.), ©H. Havermeyer (p. 56/57),
©iStock.com/AVTG (p. 59) Made possible by the friendly support of the Hamburger Abendblatt.You can also read