Winners and Losers from the Protestant Reformation: An Analysis of the Network of European Universities - THEMA Working Paper n 2022-11 CY Cergy ...
←
→
Page content transcription
If your browser does not render page correctly, please read the page content below
THEMA Working Paper n°2022-11
  CY Cergy Paris Université, France

Winners and Losers from the
  Protestant Reformation:
An Analysis of the Network of
   European Universities

    David de la Croix, Pauline Morault

               April 2022
Winners and Losers from the Protestant Reformation: An
Analysis of the Network of European Universities*
David de la Croix† Pauline Morault‡
April 14, 2022
Abstract
Using a new database of European academics, we provide a global view of the effect of the Protes-
tant Reformation on the network of universities and on their individual importance within the net-
work (centrality). A connection (edge) between two universities (nodes) is defined by the presence
of the same scholar in both universities. Protestantism strongly impacted the structure of the net-
work. Dyadic regressions confirm that geography was important as well, but does not substitute for
the effect of religion. We isolate the effect of religion on each university centrality comparing simu-
lated networks with and without religious identity. The reorganization of the network induced by
the Reformation harmed Protestant universities less than Catholics. As the number of publications
per university is strongly correlated with centrality, our simulations lend credence to the view that
the loss of connectedness of the Southern European universities after the (Counter-)Reformation
was important in triggering their scientific demise.
Keywords: Upper-Tail Human Capital, Universities, Network, Centrality, Publications, Fragmenta-
tion.
JEL Classification Numbers: N33, O15, I25.
* We acknowledges the financial support of the project ARC 15/19-063 of the Belgian French-speaking Community and
of the European Research Council (ERC) under the European Union’s Horizon 2020 research and innovation programme
under grant agreement No 883033 “Did elite human capital trigger the rise of the West? Insights from a new database of
European scholars.” We thank Sascha Becker, Yann Bramoullé, Alice Fabre, Marc Goñi, Matthew O. Jackson, Gonzague
Vannoorenberghe, and jacob Weisdorf for discussions on the paper. We also thank participants at seminars in UCDublin
(economics), Carlos III Madrid (economic history) and Rome Sapienza (economic history).
† IRES/LIDAM, UCLouvain, B-1348, Belgium & CEPR, London.
‡ CY Cergy Paris Université, CNRS, THEMA, F-95000 Cergy, France.
1 Emails: david.delacroix@uclouvain.be, pauline.morault@cyu.fr1 Introduction
Medieval universities, together with other bottom-up institutions such as monasteries, guilds, and com-
munes, are considered to be central to the development of Europe (Greif 2006). Still, after having played a
pivotal role in the Scientific Revolution of the 16th-17th centuries, many of these grand institutions seem
to have plunged into an intellectual coma thereafter. This is particularly true for Southern European
universities. One possible culprit for this decline is the loss of mobility of persons and ideas following
the Protestant Reformation and the ensuing Catholic Counter Reformation. The literature has already
stressed several important effects of the Protestant Reformation on the development of Europe (Can-
toni, Dittmar, and Yuchtman 2018, Cantoni 2015, Becker and Woessmann 2009, Becker, Pfaff, and Ru-
bin 2016). In addition to the mechanisms stressed in that literature, Ridder-Symoens (1996) argues that
the Reformation led to clustering of universities, which shaped the mobility pattern of students in early
modern times.1 Beyond students’ mobility, clustering might also affect the mobility pattern of teachers
and scholars, which might be even more subject to restrictions than that of students.
In this paper, we analyse teachers’ mobility across Europe and provide a global view of the effect of the
Reformation on the network of universities and on their individual position within the network. The
objects (nodes) in the network are universities active before 1793 in Europe. A connection (edge or link) be-
tween two universities is defined as the presence of the same scholar in both universities. To take a famous
example, the English philosopher Roger Bacon (1219–1292) lectured in Oxford (c. 1233), then accepted an
invitation to teach in Paris (c. 1237). This established (or rather reinforced, as Bacon was not alone in
that case) a connection between those two universities, facilitating the flow of ideas, manuscripts, stu-
dents between the two places. Connections between universities are built from the database of university
scholars developed by De la Croix (2021e). The sources used to build this database are primary (published
cartularia and matricula), secondary (books on history of universities and on biographies of professors
in a specific university) and tertiary (biographical dictionaries by topic or regions, and encyclopedias).
Our main motivation for the study of the network of universities lies in the idea that the structure of
a network plays a crucial role in the diffusion of information (Jackson, Rogers, and Zenou 2017). The
way universities used to be connected with each other through the mobility of scholars might have af-
fected the propagation speed of knowledge, ideas, and the intensity of academic production. Our paper
aims at exploring to what extent the documented decline in scientific production of Catholic universities
1 “There were henceforth three kinds of university: the Protestant universities, many of them proselytizing, active in
training clergymen (Wittenberg, Heidelberg, Geneva and Strasburg for example); secondly, the Catholic universities of the
Counter-Reformation, also proselytizing, and dedicated to educating competent clergy (in this the Jesuits played a leading
part). The studia of Paris, Louvain, Ingolstadt, Vienna, Graz, Würzburg, Cologne, Pon-à-Mousson, Dole and others, as well
as the Iberian universities, are of this kind. The third group comprises several universities that consciously adopted a toler-
ant attitude, and did not willingly refused students who were not of their religion: for instance, Padua and Siena, Orléans
and Montpellier, all of them Catholic universities, or Leiden and the other Dutch universities, model Calvinist universities
though they were.”
1during the 17th and 18th centuries can be explained by the reorganization of the network induced by the
Reformation.
The decline in Catholic Universities echoes the debate on the little divergence occurring within Europe
in the early modern period, and on its institutional and cultural determinants (Allen 2003; De Pleijt and
Van Zanden 2016; Henriques and Palma 2019; Rota and Weisdorf 2020). Although universities them-
selves contributed little to the advancement of applied sciences in the early modern period, the quality
of universities can still impact development through enhancing the quality of human capital in general,
and of its upper tail in particular.
To study the effect of the Reformation on the network of European universities, we build seven successive
networks over the period from 1000 (creation of the first associations of professors or students dedicated
to education) until 1793 (French Revolution). Each network covers a period of about 100 years. The
Reformation started around 1523 (creation of an higher-education college in Strasbourg, followed by the
creation of the first full fledged Protestant university in Marburg, Germany). We thus obtain four net-
works before the Protestant Reformation and three networks after the emergence of Protestantism. We
analyze the main characteristics of the network through time and find that Reformation does correlate
with a lower density and to more division in the network. In fact, we observe a sharp clear-cut divide
between Protestant and Catholic universities in the network after the Reformation, with only 5,05% of
all links connecting them in 1598-1684. This is all the more striking as connections between universities
that would convert into Protestantism and universities that would remain Catholic reaches 20.78% of
all links on the brink of the Reformation. This proportion of interfaith links falls to 3.59% in 1685-1793,
suggesting a long lasting impact of the Reformation on the mobility of scholars. Of course, we need
to distinguish the effect of religion from a pure geographical effect. Using dyadic regressions, we show
that religion is a strong determinant of network structure. Moreover, fragmentation increases not only
between Protestant and Catholic universities, but also within those broad groups.
Looking at data through the lens of graph theory also endows us with powerful tools to study how well
universities are connected in the network. In particular, we find that publications of the top five scholars
in each university is strongly correlated with classical measures of centrality in the network over the period
under study. In order to isolate the impact of the Reformation on each university centrality, we predict
the network structure from dyadic regressions with and without religions. This allows us to compute
universities’ predicted centrality, along with the “natural” centrality of universities in an atheist world. We
compare these two simulated centrality measures and find that the Reformation harmed less Protestants
than Catholics on average. Finally, we find that the Reformation impacted positively the publications
of top five scholars in Protestant Universities, partly by improving their relative position in the network.
These trends seem particularly relevant to explain the scientific demise of the universities in the South of
Europe (including France) in the modern period.
2This paper speaks to the literature on the effect of Protestantism on the development of Europe. It offers
a new angle based on unique data about the mobility of university professors. Compared to Cantoni,
Dittmar, and Yuchtman (2018), Cantoni (2015), Becker and Woessmann (2009), and Becker, Pfaff, and
Rubin (2016), we see the Reformation and the Counter-Reformation as affecting the relationships be-
tween people and universities, without necessarily affecting preferences or technology (which were the
focus of the rest of the literature).
Our paper belongs to a tradition in economic history to use the conceptual framework offered by net-
work theory to describe how relations between nodes shape some economic or social outcome.2 The
seminal paper using networks in economic history is probably Padgett and Ansell (1993). They construct
a network of marriages in early Renaissance Florence and analyze its characteristics (centrality, etc.) to
understand how the Medici gained political control. Another important paper is by Puga and Trefler
(2014), who construct a similar network for Venice in the Middle Ages to study monopolization of the
galley trade. Compared to these approaches, we introduce a methodological novelty. We use a dyadic
regression to predict links, and, inspired by the quantitative macroeconomics literature, we run counter-
factual simulations to show how the network would look if religion did not play a role. A counter-factual
network is useful to illustrate the importance of religious affiliation compared to the importance of geo-
graphical proximity.3
To our knowledge, few other papers study phenomena related to the Protestant Reformation through
a network angle. Kim and Pfaff (2012) document the key role of university students in diffusing Evan-
gelical ideas or Catholic orthodox ideology in their places of origin. They explore city-to-university ties
in the Holy Roman Empire between 1523 and 1545 and show that cities exposed to Evangelical activism
through student enrollments in Wittenberg and Basel universities were more likely to institute reform.
By contrast, reform was less likely in hometowns of students enrolled in the universities of Cologne and
Louvain, the two leading bastions of Roman orthodoxy.
Our analysis is moreover related to the literature on mobility of researchers and scientific production,
2 Beyond using network maps to describe relations, there is a rising number of papers using exogenous changes in network
structure to build causal identification strategies, see for instance Telek (2018), Becker et al. (2018), Benzell and Cooke (2020).
3 To our knowledge, only two papers in the economic and social networks literature use counterfactuals. Mayer and Puller
(2008) explore how alternative university policies could reduce social segmentation among students, while Canen, Jackson,
and Trebbi (2020) investigate how political polarization in the U.S. Congress affects legislative activity. Both papers build
their counterfactual analysis on a model of network formation. We cannot use this approach as in our framework, nodes
(universities) do not decide to create or sever connections. Dyadic regressions have been widely used to study the determinants
of network formation, see for instance (De Weerdt 2004, Fafchamps and Gubert 2007, De Weerdt, Genicot, and Mesnard
2019). In the transport network literature, Swisher IV (2017) uses counterfactual networks to quantify the effect of the railroad
on U.S. growth from its introduction in 1830 to 1861. He estimates the output loss in a counterfactual world without the
technology to build railroads, but retaining the ability to construct canals. His counterfactual canal network is built through
a decentralized network formation game played by profit-maximizing transport firms. In our paper, links between universities
are created by mobile scholars. Although studying mobility decisions of scholars is beyond the scope of this paper, it can
arguably be said that the Reformation increased the cost of moving from a Protestant to a Catholic university, or vice versa.
In our atheist world, we would assume that such cost would not depend on religious considerations.
3since the network position of a university reflects by construction the mobility of scholars. Ejermo, Fas-
sio, and Källström (2020) show with contemporary Swedish data that mobility between universities in-
creases significantly the scientific publications of researchers. The arrival of new scholars in a university
department can also have positive spillover effects thanks to the diffusion of ideas (Moser, Voena, and
Waldinger 2014). In this sense, Ductor et al. (2014) study how knowledge about the coauthor network
of an individual researcher helps to develop a more accurate prediction of his or her future productivity.
Goyal, van der Leij, and Moraga-González (2006) and Ductor, Goyal, and Prummer (2018) respectively
study the broad structure of the coauthorship network among economists and gender differences within
this network.
The paper is organized as follows. We first define our network of European universities and present the
main mechanisms we have in mind (Section 2). We describe the data we built on professors and universi-
ties (Section 3), then and we describe the main features of the network before and after the Reformation
(Section 4). Section 5 is devoted to separating the role of geography vs the role of religious affiliation.
Section 6 looks at effects on academic production. Finally, Section 7 concludes.
2 Theory
A network of universities. Let N = {1, 2, . . . , n} be the set of universities in the network g. For two
universities i, j ∈ N , we define gij ∈ {0, 1} as the link or edge between them, with gij = 1 signifying that
at least one individual scholar has taught in both universities and gij = 0 otherwise. We consider that the
links are undirected: if a scholar has moved from university i to university j, this generates a link between i
and j, and not a link from i to j only. Formally, gij = gji for all universities i and j. The strength of the link
sij is given by the number of scholars who have taught in both universities i and j. If all scholars of a given
university stayed in this same university during their entire career, then this university is an isolate in the
network. This means that it has no connection with other universities in the network. The network of
universities, g, is thus the collection of universities (nodes) and the links between them. We define such a
network of universities for each period of time that we study.
Diffusion and Learning through the network of universities. The idea behind our definition of
the network is the following. When a given professor had appointments in two (or more) places over his
life, it established a relationship enhancing the flow of ideas, manuscripts, and students between the two
places, which might last well beyond the death of the professor. The network of universities can then
reflect priviledged ways of diffusion and learning (Jackson 2008 chap. 7 & 8). Several mechanisms are at
play.
First, during the pre-industrial era, knowledge was partly codified in books, but more importantly, was
embodied in people. When a scholar moves, she brings knowledge from one place to another. This is why
4competition to attract talents was fierce among universities, leading to permanent flows between them
(Denley 2013). There are many examples of knowledge diffusion through physical moves. Let us mention
the rediscovery of Roman law, which was superior to customary law at regulating complex transactions,
spread from Italy to France in the Middle Ages either through the hiring by French universities of Italian
professors, or by having some French professors be appointed to Italian universities (Arabeyre, Halpérin,
and Krynen 2007). Second, codified knowledge in books can also travel physically with scholars. Even
though books became more affordable after the invention of the movable type printing press, they were
not as accessible as today. Biographical dictionaries contain many examples of professors donating their
book collection to the university by testament. Probably the best example of the role of books carried by
scholars in the diffusion of knowledge is when the Greek scholars fled the fall of the Byzantine Empire,
bringing forgotten books by Greek philosophers to the many Italian universities in which they were hired
(Harris 1995). Third, links are established by the presence of doctoral students. When a scholar moves to
another university but maintains a connection with current or former students in her original university,
a link is established. Students and professors cannot be systematically tracked with the available data, but
some examples can be documented using the Mathematics Genealogy Project,4 linking students to masters
in the (broad) field of mathematics. Fourth, when a newly created university hires professors from an
existing one, a long lasting relationship is established. For example, the University of Dublin, founded in
1592, was originally populated by scholars coming from Cambridge (Venn 1922). This established a long
lasting, well documented, link between the two universities. This is also true for Louvain (founded 1425)
which started with several professors hired from Cologne, itself founded in 1388 (Lamberts and Roegiers
1990a).
In some cases, links are established when a professor has to flee war or persecution. This happened in
particular after the Reformation, when scholars reallocated according to their faith (or in some cases
changed faith to keep their current location). Still, an intellectual link was created by this move. For
example, the Calvinist reformation developed in Geneva in the 16th century owes much to lawyers active
in Bourges during the preceding centuries. This rejoins the literature on how practical knowledge flowed
from France to Prussia with the expulsion of the Huguenots (Hornung 2014).
Confessionalization. As soon as we classify universities as either Catholic or Protestant, we use the no-
tion of Confessionalization. According to Lotz-Heumann (2016), Confessionalization refers to the pro-
cess of “confession-building". This process occurred through “social-disciplining," as there was a stricter
enforcement by the churches of their particular rules for all aspects of life in both Protestant and Catholic
areas. This had the consequence of creating distinctive confessional identities. Every aspect of life was af-
fected by the move initiated by Luther and Calvin. This paved the way to early modern state formation,
increasing the segmentation of Europe (Schilling 1995). The extent and strength of Confessionalization
4 https://genealogy.math.ndsu.nodak.edu
5is hard to measure, particularly at the European level, and this is one contribution of our approach.
The science-religion nexus. When we raise the question of the relationship between scientific output
and religious affiliation, we implicitly touch the delicate question of the attitude of religions with respect
to science. Bénabou, Ticchi, and Vindigni (2015) propose a game-theoretic framework to think about
this issue. There are two players in the game: a government which can prevent scientific innovations to
avoid the erosion of religious beliefs, and a church which can adjust its doctrine to make it more com-
plementary with scientific progress. The model leads to describe the joint dynamics of religious beliefs
and productivity. Two of the possible stationary equilibria highlighted by the authors are of interest for
us, and resembles the Catholic/Protestant divide. One is a regime with knowledge stagnation, extreme
religiosity with no modernization effort. Another one (called “American") combines scientific progress
and stable religiosity with religious institutions engaged in doctrinal adaptation. The theory remains
however limited on the role of parameters delimiting the different regimes. Why did the Catholics en-
gage in repressing new knowledge in the sixteenth century (for example through censoring publications,
see Becker, Pino, and Vidal-Robert (2020)), while they were more open to science before the Reforma-
tion? Our analysis in terms of network of universities may highlight the different position of Catholic
and Protestant universities within the network in terms of centrality vs. being marginalized within the
network.
3 Professors and Universities
In this section we describe the data on scholars used to construct the network of universities and we report
qualitative and quantitative evidence on the decline of Southern universities in the 17 and 18th centuries.
The data on professors we use are obtained from the sources listed in detail in Appendix B. More de-
tails can be obtained in the collection Repertorium Eruditorum totius Europae with a summary in De la
Croix (2021e). We detail here the main sources for some important samples, to highlight to the reader
the strengths and weaknesses of the individual data on which the network of universities will be built.
With 3285 professors, the University of Bologna (founded 1088) provides the largest sample, thanks to
its seven centuries of existence and to the excellent coverage found in the secondary literature. Almost
all the data were encoded from the book of Mazzetti (1847) which provides short biographies for these
professors, including whether they had appointments in other universities. The university of Heidelberg
(founded 1386) is the Germanic university with the highest number of recorded scholars, 1210 professors,
thanks to the list of professors published in Drüll (1991) and Drüll (2002). For the University of Lou-
vain (founded 1425), an important university in the Renaissance and the university of one the authors of
this paper, collecting data was more complicated, as there was no Mazetti or Drull to write a catalogue
of professors for this once famous university. Data were collected from a variety of sources: Lamberts
6and Roegiers (1990a), Ram (1861) (for the list of rectors), Nève (1856) (for the history of the Collegium
trilingue), Schwinges and Hesse (2019) (for deans before 1550), and Brants (1906) (for the law faculty).
Each person was searched for in biographical dictionaries such as Eloy (1755) (doctors), Sommervogel
(1890) (Jesuits), and the national biography to find more information about careers. The combinations
of these various sources unearth 1138 professors, hence a good coverage of this university. A similar strat-
egy of combining several secondary sources was applied for the University of Paris. English universities,
Oxford and Cambridge, are covered by the books on their alumni (Venn (1922) for Cambridge, and Foster
(1891) and Emden (1959) for Oxford). Finally, we took the liberty to add some important higher education
institutions to the list of “official universities” provided by Frijhoff (1996), such as Gresham College in
London, and the Herborn Academy in the Holy Roman Empire (this is detailed in Appendix B.
Even if the coverage of the smaller universities is sometimes unequal, the coverage of the persons who
matter for our study remains high: mobile scholars are indeed more likely to be identified as they would
appear in multiple sources. Productive scholars are also more likely to be in the database, as they would
be mentioned in books about each university, even if those books are very incomplete (such as books
celebrating the xth anniversary of the university).
While searching for professors, we found many qualitative elements about the decline of universities in
the 17th century. The view of the literature is that Catholic universities became unattractive during the
17th-18th centuries, partly because of religious views (the Counter Reformation, the Inquisition). Here
are some compelling examples. (1) About the medical school at the University of Valencia during the 17th
century: “the neoscholastic ideology of the Counter-Reformation converted the Faculty, for the most
part of the century, into a nucleus of intransigent Galenism, opposed to the innovations of the Scien-
tific Revolution.” (López Piñero 2006) (2) The same view applies to Lleida where the advances of the
sixteenth century were later reversed: “The rigid vigilance exercised by the Supreme Council of the In-
quisition paralyzed the University and caused the decadence of the university body. In such cases, thought
is threatened and all innovation seems dangerous. The teacher dictates the text, students copy it, and that
is all. Medieval routines subsist and Aristotle, Galen, and Avicenna reemerge enslaved under the tyranny
of obsequious teaching, ... This state of affairs lasted for two centuries. It could be said that throughout
this long period, Spanish universities, which had been so prestigious until then, disconnected from the
European cultural rhythm.” (Esteve i Perendreu 2007) (3) On Salamanca, the most prestigious Spanish
university, we read “In the early decades of the eighteenth century, Salamanca was simply treading water.
Such a condition cannot be wholly ascribed to the often cited isolation of the Spanish university or to
the impact of the Inquisition. These two factors had an undoubted effect in the seventeenth century, but
by 1750 (...) faculty politics posed a serious handicap (...)” (Addy 1966) (4) Going now to Italy, a gen-
eral viewpoint is that “Yet in the 17th century, Italy lost its earlier pre-eminence in literary and scientific
culture, falling behind by at least 20-30 years compared to other European countries. The 17th century
7universities in Italy ceased to attract illustrious teachers for lack of adequate salaries, while political and
religious divisions considerably reduced the flow of foreign students.” (Pepe 2006) (5) For the case of
Pavia, we read that “In the last decades of ’500 and until the mid ’700, the decline of the University of
Pavia is sharp; almost abandoned, at that point it conducted a miserable existence without any hint of
the past splendour, when – crowded with students and masters of distinguished authority – it had con-
sistently contributed to the progress and diffusion of culture." (De Caro 1961) (6) About the University
of Cahors (France): “We enter the 18th century without any more highlight for her. There is no more
star standing in the pulpit. (...) There is no longer this immense crowd coming from afar to follow her
classes. There are not even any more grievances, abuses, and speculative turbulence to be charged to her;
there is no more than an earthy routine, a discolored, anonymous, needy, and penniless company. The
Age of Enlightenment is precisely for the University of Cahors as for most of her sisters the dark time of
mediocrity.” (Ferté 1975) (7) There is also the idea that they expended all of their energy in futile fights be-
tween religious factions: “Louvain was for a long time considered the center of Jansenism, as a champion
of Catholic-heretical dogma. However, as the true faith continued to be disputed among the different
orders and clerical teachers, the University was able (...) successfully to defend its status and privileges,
even at a time when its attractiveness as a center of learning already belonged to the past.” (Hammerstein
1996)
This qualitative evidence is confirmed by a more quantitative approach. We first classify universities ac-
cording to their religious affiliation as reported in Frijhoff (1996). Four broad groups are defined as fol-
lows. The set C includes all universities which have never ceased to endorse the Catholic faith over the
period considered. The set P includes the universities which either converted to Protestantism at some
point, or which were created as such from the beginning. The set M gathers “mixed” universities which
accommodated both Catholic and Protestant faiths, either moving back and forth between Protestantism
and Catholicism, or teaching both theologies in parallel. It only includes three universities: Heidelberg,
Erfurt, and Orange.5 Within C it becomes useful to distinguish universities which were run by the Je-
suits after the Counter-Reformation, belonging to CJ , from the universities which remained “secular”,
belonging to CS , where secular here means not belonging to a monastic order. The Jesuits’ congregation,
the Society of Jesus, operated a large number of schools and universities throughout Europe (Grendler
2018), with the aim of educating virtuous leaders who would act for the common good (and fight the
Reformation). The oldest and most prestigious Catholic universities fought the influence of this new
congregation and kept the Jesuits out (Louvain, Paris, Bologna, Padua, Krakow). Within P, we will dis-
tinguish the four brands of Protestantism: PP for Presbyterian (only in Scotland), PL for Lutheran (Ger-
manic, Nordic), PC for Calvinist (Dutch, French, Swiss, German), and PA for Anglican (English, Irish),
with PP ∪ PL ∪ PC ∪ PA = P.
5 There are two Orthodox universities in our database, Saint-Petersburg, Moscow, that we do not include in the analysis.
8The period under study goes from 1000 until 1793. We divide time into seven periods. Following a tra-
dition in history, we use major events to define seven periods rather than centuries: 1) from the creation
of the first associations of professors and students dedicated to education in 1000 until 1199; 2) from the
creation of the university of Paris in 1200 until 1347; 3) from the Black Death in 1348 until 1449; 4) from
the creation of the printing press in 1450 until 1522; 5) from the creation of the first Protestant university
in 1523 until 1597; 6) from the Edict of Nantes in 1598 until 1684; 7) from the Revocation of the Edict of
Nantes in 1685 until 1793, in the middle of the French Revolution.
Focusing on the two main types of universities, C and P, we compute the total number of scholars of
universities and their publications over time. Results are shown in Table 1. Detailed data are reported
in Appendix (Table C.2). These numbers are computed by summing all the publications recorded in
Worldcat by members of universities. Worlcat provides a comprehensive contemporary measure of sci-
entific output. One could argue that a measure of output should be based on the works published while
the author was still alive. What was published after the death of the person might reflect how the author
gained popularity post-mortem, which might not be relevant for determining his/her productivity. This,
however, is not possible to implement, because many first editions of books are not available anymore.
For example, there is no doubt that Pierre Abélard (1079-1142) was a philosopher of great renown during
his life. All his written output available in the libraries today, from philosophical works to love letters,
was published after 1600.
Another issue with measuring academic output from contemporaneous library catalogues arises from
the possible loss of some publications over time. This does not seem to be of major importance, though.
Chaney (2020) compares the books contained in the Universal Short Title Catalogue database of St. An-
drews (2019) (https://ustc.ac.uk/) with those referenced in VIAF (Virtual International Author-
ity File). The USTC aims to cover all books published in Europe between the invention of printing and
1650. Chaney successfully located 81% of these authors in the VIAF data. Such a high level of coverage
is consistent with the claim that VIAF provides a reasonable approximation to the population of known
European authors. As Worldcat relies on VIAF, this also holds for Worldcat.
The total publications of Catholic and Protestant universities founded before 1523 is reported in the first
two rows in section A of Table 1. It is obtained by summing the publications of their members. When a
person taught at several universities over her life, we divide her publications by the number of affiliations
and allocate this amount to each university. The numbers show the rise of publications following the
invention of the printing press. The printing press was adopted quickly throughout Europe, with no
difference between countries (Timperley 1839). Later, there is growth in the last three periods among
old Protestant universities: 326k publications in 1523-1597 to 339k and 427k publications in 1598-1684 and
1685-1793. There is a clear decline among Catholic universities, from 331k publications in 1523-1597 to
200k 1685-1793, despite a large number of scholars of the order of 4000 per period (section B of Table 1).
9Table 1: Publications and Scholars over time
1000 1200 1348 1450 1523 1598 1685
-1199 -1347 -1449 -1522 -1597 -1684 -1793
A. Total number of publications per period (÷1000)
Old universities (founded bef. 1523)
C 23.0 132.5 81.7 204.8 331.1 178.4 200.9
P 0.9 8.8 3.1 73.2 326.3 339.0 427.2
New universities (founded aft. 1523)
C 80.0 88.5 149.3
P 178.4 390.6 738.6
Ratios C/P
old 24.31 15.13 26.24 2.80 1.01 0.53 0.47
new 0.45 0.23 0.20
B. Total number of scholars per period
Old universities (founded bef. 1523)
C 230 2012 3987 5133 5023 4739 6154
P 12 78 270 909 1061 1083 1461
New universities (founded aft. 1523)
C 768 2452 3511
P 551 1566 3024
Ratios C/P
old 19.2 25.8 14.8 5.6 4.7 4.4 4.2
new 1.4 1.6 1.2
P bef. 1523 covers universities which converted later to Protestantism.
10Table 2: Publications per Publishing Scholar and of top Scholars over
time
1000 1200 1348 1450 1523 1598 1685
-1199 -1347 -1449 -1522 -1597 -1684 -1793
C. Publications per publishing scholar per period (÷1000)
Old universities (founded bef. 1523)
C 0.24 0.32 0.17 0.25 0.23 0.14 0.10
P 0.16 0.17 0.11 0.48 0.56 0.44 0.37
New universities (founded aft. 1523)
C 0.29 0.14 0.15
P 0.49 0.34 0.29
Ratios C/P
old 1.52 1.90 1.55 0.52 0.41 0.31 0.28
new 0.59 0.41 0.51
D. Publications of top 5 scholars per period
Old universities (founded bef. 1523)
C 18.7 88.5 57.8 139.8 184.4 113.0 113.1
P 0.9 6.4 3.0 66.5 234.6 146.8 166.9
New universities (founded aft. 1523)
C 54.2 60.5 105.0
P 126.4 183.5 289.0
Ratios C/P
old 19.91 13.82 19.50 2.10 0.79 0.77 0.68
new 0.43 0.33 0.36
P bef. 1523 covers universities which converted later to Protestantism.
The overtaking by Protestant scholars is even more striking when we consider new universities. The total
output of Protestant scholars is five times that one of Catholic scholars, despite some absolute growth in
the Catholic world driven mostly by the elite institutions created by the kings of France (Collège Royal
and Jardin des Plantes).
To account for heterogenous coverage of obscure scholars, we restrict the sample to publishing scholars
in section C of Table 1. We observe that the productivity of publishing scholars in old Catholic universi-
ties systematically decreases over time relative to productivity in old Protestant universities. Within new
institutions, publishing scholars are on average twice more productive in Protestant universities than in
Catholic universities, from 1523 until 1793. Finally, to address heterogeneity in the coverage of publica-
tions by publishing scholars, we consider only publications by top 5 scholars, for which we have very good
coverage. Section D of Table 1 confirms the decline of old Catholic universities relative to old Protestant
universities over time. Moreover top 5 scholars in new Protestant universities publish almost three times
more than their counterparts in the Catholic world from 1598 to 1793.
114 The Network of Universities
We build the network of European universities for each period, and thus obtain four networks before the
Reformation, that started around 1523, and three networks after. In Figures 1 and 2, we map out these
networks of universities before and after the Reformation.
A connection between two universities illustrates the transfer of one or several scholars between them,
without taking into account the direction of transfer. More specifically, each network captures all the
displacements of scholars that occurred by period. The 1523-1597 network in Figure 2 is particular, as it
witnesses a reallocation of scholars to fit the new religious conditions: French and Belgian Protestants
moving North, but also British Catholics moving to France (Rheims and Douai, see Bideaux and Frag-
onard 2003).6 We consider that this reallocation of scholars ends in 1598, when the edict of Nantes is
promulgated, granting rights to French Protestants, including the right to have their own universities.
We code universities according to their religious affiliation. Before the Reformation, all universities were
Catholic, but in the network we nonetheless distinguish between purple universities that remain Catholic
after the Reformation and orange universities that convert to Protestantism. The only three green univer-
sities, Erfurt, Heidelberg and Orange, become mixed universities. After the Reformation, each different
brand of Protestantism gets in own color: Anglican are pink, Calvinist yellow, Lutheran orange and Pres-
byterian maroon. The Jesuit universities that actively took part in the Counter-Reformation are blue,
while “secular” Catholic universities are purple. Finally, mixed universities are green. Let us point out
that the positioning of universities in these figures is determined by the standard Fruchterman-Reingold
force-directed algorithm (Fruchterman and Reingold 1991) that groups universities more closely together
when they are linked to each other. So the positioning of universities is not based on geography, reli-
gion, or other university attributes. Overall, we already observe a clear-cut divide between Protestant and
Catholic universities in the two last networks after the Reformation, based on the mobility of scholars
only.
Our figures also show the centrality of each university by changing the size of its circle. We are measur-
ing here eigenvector centrality, which will be described in more details later. Our network maps can be
used to give a crash course on the history of the academic landscape in Europe. It goes as follows. In the
first period (1000-1999), the burgeoning Paris and Bologna are, as expected, the two most central univer-
sities. The medical centers of Montpellier and Salerno are also quite central, as is the cathedral school of
Chartres. Oxford is the little sister of Paris. In the second period (1200-1348), the Bologna-Paris-Oxford-
Montpellier group is rejoined by Padova, Avignon (which may have benefitted from the presence of the
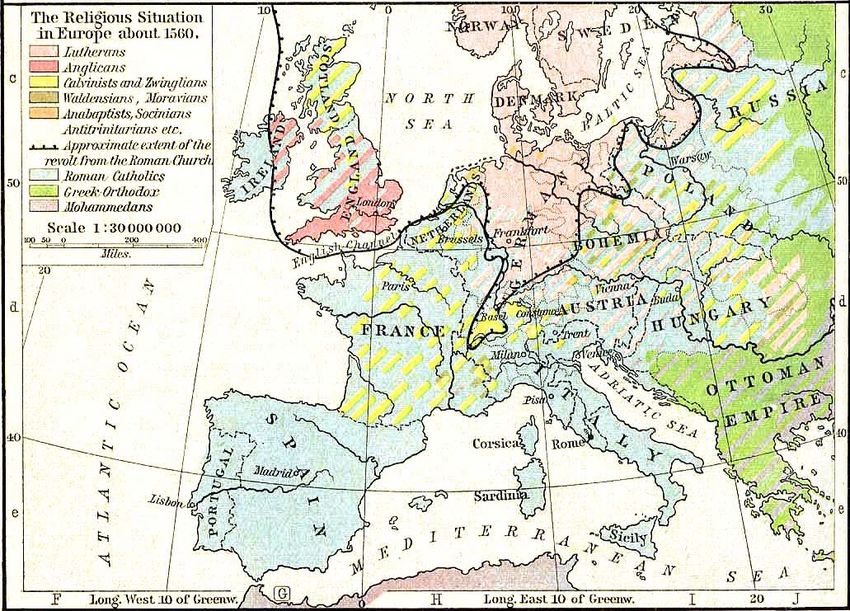
6 From 1529 to 1536, the English Parliament breaks with Rome and establishes the Church of England. In 1555, the Peace of
Augsburg allows rulers within the Holy Roman Empire to choose either Lutheranism or Roman Catholicism as the official
confession of their state. In 1560, the Scottish Parliament establishes the Kirk. In the Appendix, Table A.1 summarizes major
Reformation events and Figure A.1 shows the religious situation in Europe around 1560.
12Figure 1: Networks before the Reformation
1000 − 1199 1200 − 1347
1348 − 1449 1450 − 1522
Note: Universities that would remain Catholic after the Reformation are purple, while universities that would convert to
Protestantism are orange. Mixed universities are green.
13Figure 2: Networks after the Reformation
1523 − 1597 1598 − 1684
1685 − 1793
Note:“Secular” Catholic universities are purple, while Jesuit universities are blue-filled. Lutheran, Presbyterian, Calvinist and
Anglican universities are respectively orange, brown, yellow and pink. Mixed universities are green.
14Pope court), Toulouse, and Siena. Salerno is declining, and Chartres has disappeared from the map. Af-
ter the black death (1349-1450), it is the Italian moment. The studium in Florence, the university of the
Pope in Rome (Sapienza), and Parma rejoin the group of highly central universities. The newly founded
universities of Vienna and Louvain start to appear on the map. During the last period before the Refor-
mation (1451-1522), there are additional newcomers, some of whom will ultimately become protestants,
such as the universities of Leipzig, Greifswald and Wittenberg. Paris is still there, Louvain centrality has
grown, Oxford centrality has shrunk. The period of the Reformation (1523-1597) is one in which many
universities display a high degree of centrality. The network is made of a core of universities having mul-
tiple links between each other, with a periphery of less connected places. We remark the emergence of
a new type of universities in blue, those either founded by the Jesuits, or in which the Jesuits played a
key role. In the period during which Protestantism was tolerated in France (1598-1685), the network is
obviously split into two blocks, the Protestants and the Catholics. the Catholic universities are still the
most central. But they are of two types. The secular Catholic, not run by any specific monastic order,
and the Jesuit universities. We observe that the mothership of all Jesuit universities, the Gregoriana, is
indeed the most central one in their network. It is surprising not to see the Dutch universities emerging
at this stage. For the German universities, many were engulfed in the Thirty Year War. In the last period
(1686-1793), there is a complete reversal of situation, at least seen from the point of view of centrality. The
Lutheran universities, led by the newly founded Universities of Gottingen and Halle, are now the most
central ones, followed by the Calvinist universities in Holland. The other nodes in the network have lost
the centrality they had previously, including the Jesuit universities.
We now examine the main macro characteristics of the networks. Let us first define them. The density of
the network is the ratio of observed links in a network to the maximum number of possible links. For an
undirected network with N nodes, the maximum number of links is N (N − 1)/2 so the density for an
undirected network is: 2L/[N (N − 1)], where L is the number of observed links in the network. The
degree of a university i, di , is the number of distinct universities with which the university i is connected.
Formally di = #|j : gij = 1|. The average degree of a the network g, denoted d(g), is the mean of the
degrees of all connected universities in the network. The distance l(i, j) between two universities i and j is
the length of the shortest path between them. The diameter is the largest distance between any two uni-
versities in the network. The average distance of all pairs of universities in the network g is denoted l(g).
Note that we compute these statistics for each network without taking isolates into account. Statistics
defined above are displayed in Table 3.
First, we observe a large increase in the number universities across time, going from 18 to 151. In contrast,
the number of connected pairs of universities keeps increasing before the Reformation, until it reaches
a peak during the 1523-1597 period. As we already discussed, this period is specific as it witnesses a con-
strained reallocation of scholars due to the emergence of Protestantism. Interestingly, the number of
15Table 3: Descriptive Statistics of the Networks
1000 1200 1348 1450 1523 1598 1685
-1199 -1347 -1449 -1522 -1597 -1684 -1793
Universities 18 31 50 73 120 146 151
Connected universities 17 27 44 66 115 140 144
Connected pairs 24 93 136 231 692 535 473
Scholars in connected pairs 42 367 679 745 1555 1457 2146
Density 0.18 0.26 0.14 0.11 0.11 0.05 0.05
Average degree 2.82 6.89 6.18 7 12.03 7.64 6.57
Diameter 6 3 6 5 5 7 8
Average distance 2.62 1.88 2.54 2.54 2.46 3.1 3.47
connected pairs decreases during the two last periods after the Reformation. However, when we con-
sider the total number of scholars connecting each pair of universities, it keeps increasing over the period.
As a result, the average number of scholars connecting two universities increases from 3.22 just before the
Reformation to 4.54 in the 1685-1793 period. So a professor in a given university was more likely to move
to another university that already had a connection with his current university after the Reformation
than just before, even though the number of universities more than doubled between these two periods.
Then, the networks of universities are sparser after the Reformation: the density of the network more
than halved. This is due to both the increase in the number of universities in the networks and the de-
crease of links after the peak mentioned in the 1523-1597 period. The average degree of universities in the
networks is quite stable for the three periods just before the Reformation and the two last periods after: on
average, universities are connected to about 7 other universities over the period. This number strikingly
increases to slightly more than 12 during 1523-1597 period: again, this is due to the forced reallocation of
scholars during this troubled period which increased mobility significantly. Finally, the average distance
of the networks increases after the Reformation. For the five first periods, it requires on average 2.41 steps
to connect any pair of universities in the networks and at most 5 steps. In contrast the average distance of
the networks increases to 3.10 and 3.47, and the diameter reaches 7 and 8 in the two last periods.
We now explore to what extent the individual position of universities in the networks correlates with the
publications of their top 5 scholars. As explained in Section 3, we focus on top 5 scholars for which we
have a very good coverage. We consider five classic network measures of centrality. We already defined the
first one, the degree of a university i, di , which measures the number of university i’s neighbors. The four
other centrality measures are as follows. The strength si captures the average strength of existing links of
university i with its neighbors. The closeness centrality Ci describes how quickly university i is reachable
from all other universities in the network. The betweenness centrality Bi measures the importance of
university i in connecting other universities in the network. The eigenvector centrality Ei captures how
“well-connected" university i’s neighbors are. We provide detailed definitions of these four measures in
16Appendix F. We regress academic output of top 5 scholars in each university on the different network
measures described above, in a panel over our seven periods. Results are displayed in Table 4.
Table 4: Position in the network and Scientific Production
Dependent variable: pit
degree 0.087∗∗∗
(0.016)
strength 0.029∗∗
(0.013)
closeness 10.241∗∗∗
(1.510)
betweenness 6.947∗∗∗
(2.724)
eigenvector 1.647∗∗∗
(0.374)
Observations 589 589 538 589 589
Adjusted R2 0.639 0.618 0.629 0.619 0.630
∗ pTable 5: Connections between Catholic and Protestant Universi-
ties
1450 1523 1598 1685
-1522 -1597 -1684 -1793
Proportion of C-P edges 20.78 21.1 5.05 3.59
IH index for C univ 0.57 0.54 0.87 0.92
IH index for P univ 0.33 0.29 0.64 0.69
Modularity religion 0.10 0.18 0.37 0.43
periods after the Reformation. During the first three periods under study, this proportion is low because
there are few would-be P universities relative to C universities. Additionally, Catholic and Protestant uni-
versities tend to have more connections with universities of the same religion over and above the relative
size of their religious group. We use the inbreeding homophily index developed by Coleman (1958) (see
Appendix E for a definition) in order to compare the degree of homophily among Catholic and Protes-
tant universities across time. The inbreeding homophily index is positive and increases significantly in
the two last periods after the Reformation for C and P universities. While the IH index for C universities
equals 0.57 from 1450 to 1522, it peaks to 0.87 and 0.92 in 1598-1684 and 1685-1793 respectively. We find a
similar pattern for P universities: their IH index increases from 0.33 before the Reformation to 0.64 and
0.69 in the two last periods after the Reformation.
Finally, we use the modularity score to evaluate to what extent the partition of universities along their
religious affiliation explains the structure of the network. We consider a community structure Π based
on religions. We distinguish three communities in Π : Catholic, Protestant and Mixed. The partition of
universities along religious affiliations exhibits positive modularity scores, indicating that there are more
links in communities than we would expect in a randomly generated graph. But while the modularity
score just before Reformation is 0.10, it reaches 0.37 and 0.43 in the two last periods under study, indicat-
ing that religion is a good predictor of the network structure after the Reformation. To make sure that
the partition along religious affiliations is a significant community structure, we replicate 100 randomized
networks that have the same degree distribution as the original data and evaluate their modularity scores
for the two last periods after Reformation. We find that no randomized networks have a modularity score
higher than 0.37 and 0.43 respectively in 1598-1684 and 1685-1793. In fact, the maximal modularity scores
of these 100 networks for these two periods are respectively 0.06 and 0.04. Thus it can be said that divi-
sion along religious affiliations significantly impacts the structure of the network of universities after the
Reformation.
However, we should not omit the fact that religious affiliation is highly correlated with geography, as most
Protestant universities are located in Northern Europe and most Catholic universities are to be found in
18Southern European countries. To ensure that our previous analysis does not simply capture the impact
of closer geographic distance rather than membership of the same religious group, we disentangle these
two effects in the next Section.
5 Geography vs. Culture
In this Section we show that geography is also important, which is not surprising, but does not substitute
for the effect of religion. To study the geographical and religious determinants of a connection between
two universities, we use dyadic regressions.
Dyadic regressions in network analysis are regressions in which each observation expresses a relationship
between each possible pair of nodes. In our setting, we successively investigate the following dependent
variables for all pairs of universities i and j: (i) the presence or the absence of a link gij ; (ii) the strength
or intensity of the link sij ; and (iii) the inverse of the length of the shortest path 1/l(i, j). Our aim is to
estimate to what extent belonging to the same religious group determines the presence and the intensity
of a connection between two universities, as well as the length of the shortest path connecting them in
the network, controlling for geography. Since there may exist heterogeneous effects across subreligions,
we decompose the effect of sharing the same religious affiliation by distinguishing the effect of both being
Lutheran from the effect of both being Calvinist, and so on. Our main independent variables of inter-
est are thus the geographic distance between any pair of universities and dummy functions indicating
whether the two universities of the dyad are both Lutheran, Calvinist, etc. Our estimated model is
yij =β0 + β1 dij + β2 I(i, j ∈ PL ) + ... + β8 I(i, j ∈ M)
(1)
+β9 υij + β10 νij + γ Kij + αi + αj + ϵij
The dependent variable yij is a dyadic network measure as described above.
Distance is defined as dij = ln(costmin + costij ), where costij is the minimum cost it takes to travel from i
to j computed using Özak’s (2010, 2018) human mobility index. Parameter costmin is the minimum cost
incurred when travelling within the same city (say from Jardins des Plantes to Sorbonne). We assume
it is equivalent to the cost of walking within the old city of Rome between the Vatican City and the
Colosseum (3.5 km).
Dummy functions I(i, j ∈ PL ), etc, indicate whether or not universities i and j are both Lutheran, Mixed,
etc. We include such a dummy function for each subreligion, i.e. PL , PC , PP , PA , CS , CJ and M. For each
specification, we include cross effects to control for the differentiated impact of belonging to different
subreligious groups. We introduce dummy functions, captured by the vector Kij , for each configuration
19except the one which will be the reference category.7
We also add two other explanatory variables: the number of overlapping years during which both uni-
versities i and j are active, which is denoted vij , and the minimum coverage denoted νij = min(νi , νj )
where the coverage νi of university i is the number of observed professors who taught there divided by its
activity period length. This is to control for the fact that two universities that are simultaneously active
during a long time period are more likely to have a connection than two universities that only share a
couple of active years. We add minimum coverage controls because we are more likely to observe a con-
nection between two universities for which we have lots of information in our sample, as this is the case
for Germany and Italy, than between universities for which we have poorer coverage.
To address the issue of spatial correlation, we use a two-way fixed effect model, which includes a fixed effect
for universities i and j, αi and αj (see De Weerdt (2004) and De Weerdt, Genicot, and Mesnard (2019)).
Autocorrelation is the possible correlation between the error term associated with the dyad formed by
university i and university j, ϵij , and all the error terms associated with other dyads in which i or j appear,
ϵ.i , ϵi. , ϵ.j and ϵj. . Concretely, we include one dummy for each university that indicates whether the spe-
cific university is part of the dyad or not. This means that there are two dummy variables equal to one
for each observation. By including these university fixed effects we control for observable attribute vari-
ables, for instance the fact that big universities may have more connections than universities with small
capacity. These university fixed effects also enable us to control for unobserved attribute variables: for
instance, universities that encourage mobility are more likely to have more links than universities that do
not. Including these dummies thus purges the effects of all attribute variables and therefore eliminates
autocorrelation.
To run our dyadic regressions, we make a dataset of all possible unique combinations of two universities.
We include in this dataset all universities where at least one scholar taught during the period under study.8
For instance, in 1685-1879 we count 151 such universities, so the number of possible dyads is 11325.9 We
delete dyads for which the two universities were not active during a same period of time. This is to avoid
two potential biases in our estimates. The first one is simply the fact that two universities that were not
simultaneously active are less likely to share a connection. For instance, if university i was active until
1690, it is very unlikely that it shares a connection with university j that opened ten years later. Second,
even for universities whose active periods are separated by less than 100 years, deleting such dyads mitigates
the issue of the mobility of scholars triggered by the closing of their university. Assume that university i
closes, forcing its scholars to find another teaching position at another university that is currently active.
If university j opens only a few years after the closing of university i, we cannot know whether scholars
7 For instance, I(i ∈ PL and j ∈ PA or i ∈ PA and j ∈ PL ) ∈ K is equal to 1 if there is one Lutheran university and one
ij
Anglican university in the dyad, and 0 otherwise.
8 In other words, we include the universities that are connected and the ones that are isolated in the networks defined above.
9 In a network with N nodes, t he number of possible dyads is N (N − 1)/2.
20You can also read