Xilinx ZC702 DS-5 Getting Connected Guide
←
→
Page content transcription
If your browser does not render page correctly, please read the page content below
Xilinx ZC702 DS-5 Getting Connected Guide
Xilinx ZC702 evaluation board using ARM® DS-5™ Toolkit
  Summer 2012          Version 2.2                                   by Robert Boys,     bob.boys@arm.com

Introduction:
This document describes how to connect ARM Development Studio 5 (DS-5) to the Xilinx Zynq ZC702 evaluation board
using either DSTREAM™ or Ethernet using gdbserver. Zynq contains two ARM Cortex™-A9 processors.
DS-5:
DS-5 is a complete development suite with support for Linux, Android, bare metal and other operating systems.
It uses the Eclipse IDE with either the GCC or ARM compiler. DS-5 contains the ARM debugger. DS-5 includes the ARM
Streamline™ performance analyzer. DS-5 connects to a target with a DSTREAM debug adapter or gdbserver running over
Ethernet or USB.
With DS-5, you can create a kernel, develop drivers and application programs. You can load a program to your target, start
and stop it, set breakpoints, view CPU registers and processor peripherals. Assembly and Source windows are available.
Streamline shows you where your program has spent time, who called who and how many times, and timings for memory
accesses, cache operations and many more. Power consumption is an option.
DS-5, with DSTREAM, provides ETB and PTM instruction trace functions. RVI provides ETB but not PTM. DSTREAM
connects to your PC with USB or Ethernet.
For more information see www.arm.com/ds5. DS-5 runs on Windows or Linux. You can download DS-5 and use it without
charge for a 30 day evaluation period. This version is not crippled or limited inside the 30 days.
Using DSTREAM Debug Adapter:
Pictured below is the ARM DSTREAM debug adapter connected to the ZC702 PJTAG port J58. This is used for all modes of
debugging including Linux and Android kernel and driver plus bare metal development.
For PTM instruction trace using the Mictor connector, an additional adapter board is available from Xilinx.
RVI and RVT2 Legacy Debug Adapters:
DS-5 continues to support RVI, the predecessor to DSTREAM. RVT2, which is the trace addition to an RVI, does not support
PTM trace as found on Cortex-A9 processors. RVI does support ETB trace. ARM recommends upgrading to DSTREAM.
Using Ethernet:
Note the Ethernet cable. This can be used for Linux and Android application debugging via gdbserver. Streamline also uses
this connection: it does not use DSTREAM. The USB cable shown is used for the ZC702 UART terminal.
Contacting ARM:
For the latest version of this document and the
example files, please email: bob.boys@arm.com.
They might be attached to this document as a
renamed zip file demo.abc.
For additional information regarding DS-5, email
is an effective and fast method. Your email will
be directed to the appropriate sales or technical
person depending on your region and inquiry.
North and South America: orders@arm.com
Europe and Asia: orders-Europe@arm.com
Distributors: See www.arm.com and search for
distributors to obtain a list of distributors in your
area.
See www.embeddedsoftwarestore.com

                                                              1                  Copyright © 2012 ARM Ltd. All rights reserved

Xilinx Zynq Getting Connected with ARM® DS-5                                           www.arm.com/ds5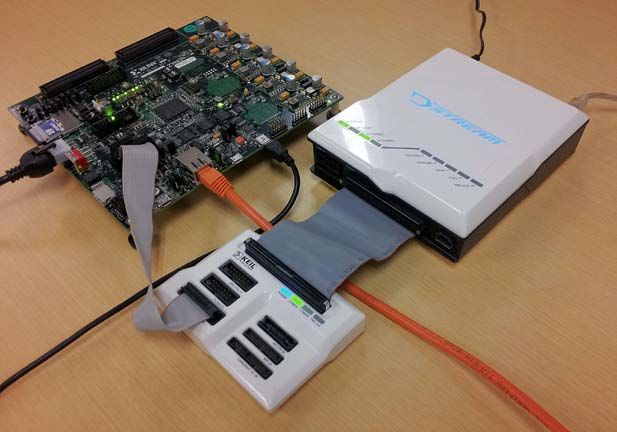
Index:

1) ZC702 Debug Configuration files:                                                                                             3

If you have a DSTREAM or RVI debug adapter hardware:
2) Creating a Zynq Debug Configuration for DSTREAM:                                                                             4
3) Connecting DSTREAM:                                                                                                          5
4) Configuring the example program dualCPU:                                                                                     6
5) Running the example program dualCPU:                                                                                         7
6) Connecting with SMP:                                                                                                         8
7) Using ETB Trace:                                                                                                             9
8) Trace Enable/Disable Filters:                                                                                                10

If you intend on connecting with gdbserver on the Ethernet port:
9) Connecting using Ethernet:                                                                                                   11
10) Adding gdbserver to the ZC702 Filesystem:                                                                                   12
11) Creating a Zynq Debug Configuration (DC) with Remote Systems:                                                               13
12) Hello World example program:                                                                                                14
13) Streamline Performance Analyzer:                                                                                            15

FAQ: What can I do if I am connected via Ethernet or JTAG ?
With Ethernet: (you can also use USB port)
              a. Linux/Android application debug via GDBserver. Is very slightly intrusive.
              b. Streamline analysis via Gator. Is intrusive. If Gator not running, is detectable but negligible.

With DSTREAM JTAG/SWD hardware:
              c. Linux kernel, device driver and application debug, bare metal, other OS/RTOS.
              d. Trace: ETB and PTM.
              e. Is non-intrusive. With Linux running, very slightly intrusive.
Upcoming Additions to this document:
Note: This document is a work in progress. These items need to be done:
    1.   PTM (Program Trace Macrocell) needs to be added and validated.
    2.   Streamline: We have a Linux kernel that works with the Gator daemon.
    3.   The Gnometris example can run on ZC702. Instructions are not provided here.

    RUN = Continue =                 STOP = Interrupt =

                                                           2                    Copyright © 2012 ARM Ltd. All rights reserved

Xilinx Zynq Getting Connected with ARM® DS-5                                         www.arm.com/ds5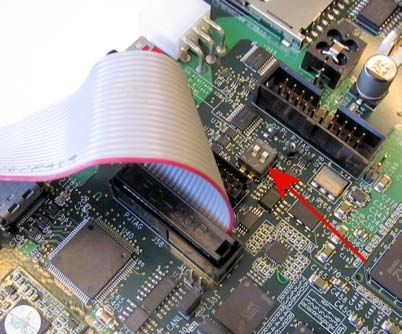
1) ZC702 Debug Configuration files:
The current version of DS-5 shipping is 5.9 as of March 2012. The Zynq ZC702 evaluation board is supported.
Two board support packages for Zynq are provided with DS-5 Version 5.9:
    •    Xilinx - Zynq-7000 EPP Emulation Board                :a special FPGA prototype from Xilinx. HW-EP107
    •    Xilinx – Zynq-7000 EPP ZC702                          : the ZC702 evaluation board.

Confirming ZC702 Platform Support:
    1.   Start DS-5. Use the suggested Workbook location.
    2.   Open Run/Debug Configurations.
    3.   Click once on any existing configuration as shown here:

    4.   Note: I clicked on New_Configuration: you might have to click on the Create New Launch Configuration icon.
TIP: You can also right-click on any entry in the Debug Control pane and select Debug Configurations.
    5.   The Debug Configurations window opens. A partial view of this window is shown below.
    6.   Select Platform and at the bottom the Zynq entries are listed as shown here:

    7.   Select Zynq – 7000 EPP ZC702 and the window at the bottom below opens (I show partial views).
    8.   Note the entries selected in Project Type and Debug Operation boxes.
    9.   Change the Project Type to see the various options available and how they change the Debug Operation options.
    10. Click on Close. Do not save the configuration by selecting Apply first. We do not want to save this configuration.
        On the next page we will create a debug configuration that you will want to keep.
TIP: You change Name: by simply writing in this box. It will subsequently appear in the configuration list (if it is saved).
You can change this name at any time.

                                                               3                  Copyright © 2012 ARM Ltd. All rights reserved

Xilinx Zynq Getting Connected with ARM® DS-5                                            www.arm.com/ds5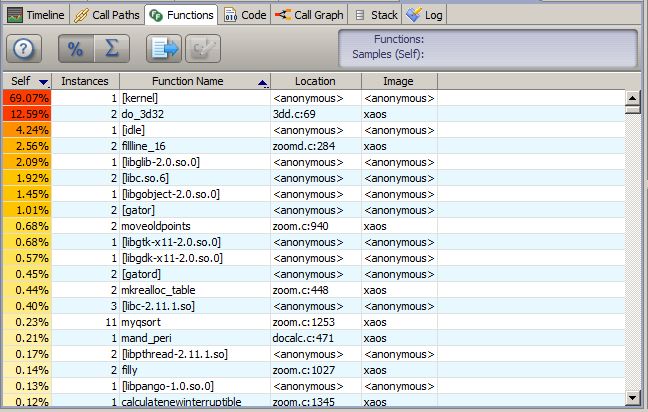
2) Creating a Zynq Debug Configuration (DC) for DSTREAM:
Creating a Debug Configuration will allow you to connect to each or both of the Cortex-A9 cores inside the Zynq. These
connections are configurable and allow you to do many tasks such as start, stop and set breakpoints. You can load programs
and run them.
You can create many Debug Configurations to connect to your target(s) in different ways and to run different programs.
We will create a debug configuration to connect to both cores. We will be able to start and stop the CPUs.
Core 0:
    1.    Connect a DSTREAM to your PC with a USB or Ethernet cable. I used USB. It need not be connected to a target yet.
    2.    Select Run/Debug Configurations. A window similar to that below opens. I show only a partial view.

    3.    Click on the New launch configuration         icon: it is on the left side of the Debug Configurations window.
    4.    Name your Debug Configuration in the Name: box. I chose Zynq ZC702 Core 0 Bare Metal. Choose your own if
          you prefer. This name will show up in the Debug Control pane or tab. You can easily change it later.
    5.    Select the Platform, Project type and Debug operation entries as shown below:

    6.    For Connections: select Browse… and a window like this opens:
    7.    Highlight the adapter of your choice and click on OK. There is usually only
          one unless you have more than one adapter connected to your computer.
TIP: If you ever encounter errors connecting to a target, repeat steps 6 and 7.
    8.    Click on the Debugger tab to open its pane.
    9.    Under Run Control, select Connect Only.

    10. Click on the Apply button.                If successful the Debug icon will be
        highlighted. If not, the reason will be displayed at the top of the window.

    11. If adding another core, go to the next step. If not, select Close.
TIP: If you select Debug at this time, you will attempt to connect to a target. We do
not want to do this at this time.
Core 1:
    12. Repeat the process above (start at instruction 3.) Use a different name in 4. I used Zynq ZC702 Core 1 Bare Metal.
        Select Debug Cortex-A9_1 via DSTREAM for the Debug connection.
    13. Select Close when completed.
You now have two new debug configurations that are visible in the Debug Control pane.
If your DSTREAM is connected to a powered ZC702 board, you are ready to connect to it using DS-5.

                                                                 4                  Copyright © 2012 ARM Ltd. All rights reserved

Xilinx Zynq Getting Connected with ARM® DS-5                                             www.arm.com/ds5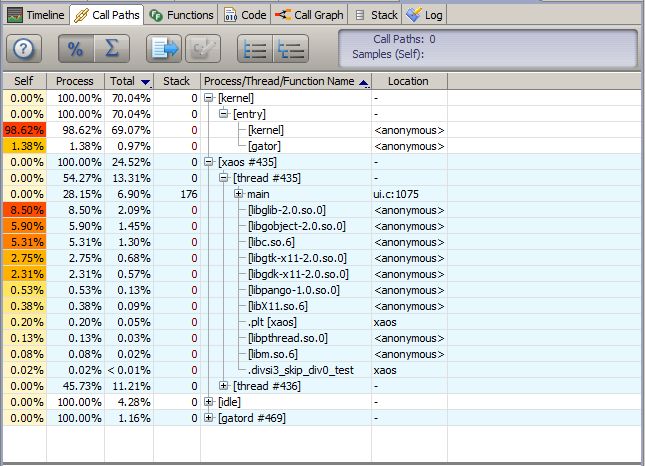
3) Connecting DSTREAM:                         Note: These instructions will also work with an RVI.
You will have created two Debug Configurations (DC) from the previous page. One will be for Core 0 and the other for Core
1 of the Zynq chip. Now you will use these DCs to connect to the ZC702.
              1) Connect the 20 pin cable on DSTREAM to the PJTAG connector J58 as shown below:
              2) Set SW10 JTAG Selector 1 and 2 to ON as shown by the red arrow.
              3) Connect your PC to the USB connector J1: USB UART.
                 This is a USB to Serial port and will provide you with the
                 ability to connect to the Linux kernel. Use a standard
                 Serial Terminal program. Speed is 115200 baud.
                 DS-5 will work without this but it is useful for testing,
                 especially confirming Linux and Ethernet are running.
                 See point 4 on page 11 under 9) Connecting using
                 Ethernet: for USB drivers for your PC for web address.
              4)   Power DSTREAM and connect its USB to your PC.
              5) Power the ZC702 board and turn it on with SW11.
              6) Linux will boot from the SD card. You will see this in
                 your terminal program. After it has booted, confirm you
                 can communicate with the kernel by pressing Enter.
Connect to Core 0 and 1:
    1.   In the Debug Control pane, highlight the DC you made for Core 0.

    2.   Click on the Connect to target icon:        You can
         also double click or right click on the DC to connect.
    3.   DS-5 will connect to Core 0 and stop it as shown here:
    4.   In a similar fashion, connect to Core 1. Now, you will
         have the next window visible:
    5.   At this point, you are connected to both Cortex-A9
         processors and they are both stopped.

    6.   Confirm that the Linux kernel is stopped by pressing
         Enter in your terminal program several times.
TIP: At this time you can view each core and the Zynq
peripheral registers in the Registers pane. Selecting Core 0 or 1
determines which core registers are visible.
The disassembly window will show the current PC location.
Start Cores 0 and 1:
    7.   While one of the processors is highlighted, click on the
         Continue icon.       Repeat for the other core.
    8.   You will be able to communicate again with the kernel with your terminal program.

TIP: You stop a core with the Interrupt icon.          Disconnect from a target:          Delete a DC:                 Be careful ! It is
easy to accidentally delete a DC by clicking on the wrong icon – if you do, just recreate it.
TIP: If you disconnect from a target while DS-5 has the core(s) stopped – you will have to reboot the target or reconnect to
start the core. If you want to leave the core running, disconnect while DS-5 has the core(s) running.
Problems:
DS-5 will attempt to give you some clues as to the origin of the problem. View the App Console, Error Log and Command
panes for such information. Dialog boxes can open providing more clues.
Make sure your Debug Configurations (DC) are set correctly. Make sure you selected the correct DC for your operations.
Reboot the ZC702 and the DSTREAM if necessary. Check your sure connections. Reselect your adapter. Steps 6 & 7 page 4.

                                                                  5               Copyright © 2012 ARM Ltd. All rights reserved

Xilinx Zynq Getting Connected with ARM® DS-5                                           www.arm.com/ds5
4) Configuring the example program dualCPU:
dualCPU is a simple example running bare metal (no RTOS). As each CPU runs, it writes ASCII art to memory location
0x30000. A semaphore at 0x20000 indicates which CPU is currently running.
Prerequisites: These items need to be true for this example to run:
1. The Terminal program connected to USB UART on ZC702. This step is not an option this time.
2. DSTREAM connected to ZC702 and everything powered.
3. The two Debug Connections you created on page 4. Both must not be connected to the target at this time.
4. Executable and source files in C:\demo\dualCPU. Original file is demo.zip. Might be renamed to demo.abc and
attached to this document.
Configure the Zynq ZC702 Core 0 Bare Metal Debug Configuration:
1. Select Run/Debug Configurations and then Zynq ZC702 Core 0 Bare Metal. The window below opens.
2. Select the Debug and ETB
option shown in Debug
operation.
3. Make sure your Bare Metal
Debug connection is correct.
4. Click on the Files tab to
open the Files pane. The
second window below opens
up.
5. Using the File System… button, insert the file C:\demo\dualCPU\CPU0.axf in the two boxes as shown:
6. Select the Debugger tab.
7. Select Debug from symbol.
Main will be entered by
default.
8. Select Execute debugger
commands. In the box enter
mem set 0x20000 32 0x0 as
shown. This presets the
semaphore to Core 0.
9. The Arguments, Environment and Event Viewer panes should be empty.
10. Click on Apply.
Configure the Zynq ZC702 Core 1 Bare Metal Debug Configuration:
11. Repeat this process for the DC Zynq ZC702 Core 1 Bare Metal using the file C:\demo\dualCPU\CPU1.axf.
12. Repeat all steps starting at 1 to 9 making appropriate substitutions.
13. Do not select the ETB option for Core 1. Select Debug Option as
shown here: At this time, you can run ETB on only one core unless you
select the SMP operation
14. Click on Apply, and then Close.
At this point, you are ready to run the dualCPU example on the next page.
TIP: If a connect action to DSTREAM fails, reselect the Connection box. See Step 6 and 7 on page 4 for instructions.
6 Copyright © 2012 ARM Ltd. All rights reserved
Xilinx Zynq Getting Connected with ARM® DS-5 www.arm.com/ds55) Running the example program dualCPU:
Reboot ZC702 and connect DS-5:
1. Reboot the ZC702 board with the terminal program connected.
You can press the SW1 POR_B button to RESET the board.
When Hit any key to stop autoboot displays, hit any key !
The pele-boot prompt will display as shown. This stops Linux
from booting so we can bare metal debug. The Cortex-A9 cores
are initialized by pele-boot.
2. In the Debug Control pane, connect Zynq ZC702 Core 0 Bare Metal to the ZC702 target board.
3. Similarly, connect Zynq ZC702 Core 1 Bare Metal to the ZC702 target board. Both must connect successfully.
TIP: It is important to connect the ETB enabled core first. In our case, this is Core 0. An error will occur otherwise.
Configure the Memory windows and set the breakpoints:
4. In the upper Memory window, enter 0x30000 and press Enter. This is the window the ASCII art will appear. In the
lower Memory window enter 0x20000 and press Enter. This is the semaphore telling which core is running: 0 or 1.
5. Select the other core in the Debug Control pane and repeat instruction 4. The other core will probably be Core 0.
6. If you see ASCII art in the Memory window, carefully adjust the width of this window so ARM or XILINX appears.
7. Select Core 0. In the source file datacopy.c, set a breakpoint at if (*semaphore==0)
8. Select Core 1. In the source file datacopy.c, set a breakpoint at if (*semaphore==1)
Run the dualCPU example program:
9. Select Core 1 and click on the Continue icon. . This equal to a RUN command.
10. Select Core 0 and click on the Select the Continue icon.
11. Quickly, one of the cores will hit the breakpoint and stop.
12. Click Continue again and the program will advance to the next breakpoint. The ASCII art will change. You might
have to select the other core. Be patient while DS-5 sometimes takes extra time to changes modes.
13. With these two breakpoints set, I was able to click on Continue and the next breakpoint was met. The memory
0x20000 toggled between 1 and 0 indicating which core was active. Here is Core 0 at the breakpoint: See memory
0x20000:
Here is the ETB trace for Core 0: Note the
percentage time spent in the two functions
and the record of the instructions executed:
1. Stop both processors with the
Interrupt icon.
2. Disconnect both CPUs from the
target.
7 Copyright © 2012 ARM Ltd. All rights reserved
Xilinx Zynq Getting Connected with ARM® DS-5 www.arm.com/ds56) Connecting using SMP:
SMP is an acronym for Symmetric MultiProcessing. SMP is ARM technology built-in to the Zynq to facilitate the two cores
running together. The Linux used with the ZC702 does this. We will briefly examine SMP and how DS-5 can handle it.
Creating a SMP Debug Configuration (DC) for DSTREAM:
We will create a debug configuration to connect to both cores at the same time. We will be able to start and stop the CPUs
together.
1. Connect a DSTREAM to your PC with a USB or Ethernet cable to a powered ZC702 target running Linux.
2. Select Run/Debug Configurations. A window similar to that below opens. I show only a partial view.
3. Click on the New launch configuration icon.
4. Name your Debug Configuration in the Name: box. I chose Zynq ZC702 SMP.
5. Select the Platform, Project type and Debug operation entries as shown below:
6. For Connections: select Browse… and a window like this opens:
7. Highlight the adapter of your choice and click on OK.
TIP: If a connect action to DSTREAM ever fails, try doing step 6 and 7 again.
8. Click on the Debugger tab to open its pane.
9. Under Run Control, select Connect Only.
10. Click on the Apply button. If successful the Debug icon will
be highlighted. If not, the reason will be displayed at the top of the
window.
11. Select close. One DC does both cores.
12. In the Debug Control pane, highlight the DC you just created and
connect to the target. The DC will look like this:
13. Note both cores are connected and both are stopped.
14. Select the Continue icon.
Select Interrupt.
15. Note both processors start and stop. When
stopped, as you click on core 0 and core 1, the
perspectives of various windows will change.
16. Disconnect from the target:
Next, we will examine ETB trace.
8 Copyright © 2012 ARM Ltd. All rights reserved
Xilinx Zynq Getting Connected with ARM® DS-5 www.arm.com/ds57) Using ETB Trace:
Cortex-A9 processors have PTM (Program Trace Macrocell) that provides all the program counter values. DSTREAM can
collect up to 4 GB of trace. It uses the Mictor connector. To use PTM trace, Xilinx has a daughtercard available.
Zynq is equipped with ETB: Embedded Trace Buffer. This is a 4 Kbyte of high speed memory embedded in the chip. Trace
frames are collected and can be displayed through the JTAG port. The trace can be configured to turn on at a specified
address and to turn off similarly. The advantage of PTM over ETB is the much larger number of frames collected.
Using the DC created on the previous page,
1. Select Run/Debug Configurations. A window similar to that below opens. I show only a partial view.
2. Highlight the SMP DC you created. Recall I named mine Zynq ZC702 SMP.
3. Change the Debug operation to DEBUG and ETB Trace Cortex-A9x2 SMP as shown below to enable trace.
4. Click on the Apply button. and then select close.
5. In the Debug Control pane, highlight the SMP DC and connect to the target.
6. Note both cores are now connected and both are stopped.
7. Select the Continue icon. Select Interrupt. This is to collect some trace frames.
8. Click on the Trace tab to open the Trace pane: Note the trace frames displayed as they were recorded:
Things to try:
1. Select each core in Debug Control pane and the appropriate trace frames will be displayed.
2. Click on the red bar and slide the gray bar along and note the trace associated frames are displayed.
3. If we had source code associated in the DC, we could see source code displayed beside the assembly language.
4. The red bar is a performance analyzer. If we had source code associated, we could see functions listed
with more than one bar. See the bottom of the next page for an example.
5. Right click on a trace frame and select Show in Disassembly. Note small blue arrow to the left of the frame number.
9 Copyright © 2012 ARM Ltd. All rights reserved
Xilinx Zynq Getting Connected with ARM® DS-5 www.arm.com/ds58) Trace Enable/Disable:
1. It is possible to turn the trace on and then off to record only those frames you are interested in viewing to save space.
2. When I clicked on Continue and then
Interrupt, I noticed the same sequence
of instructions as shown here:
Suppose I want to save in the trace
memory only the instructions DSB and
WFI. I need a Trace Filter.
3. Right click on DSB and select Toggle
Trace Start: Point:
4. Right click on WFI and select Toggle
Trace Stop: Point:
5. These are displayed in both the Trace
and Disassembly panes as well as the
Breakpoints pane.
Note the blue arrow is the current value
of the PC and it points to the next
instruction to be executed.
6. Click on Continue and then Interrupt.
7. The next window shows the frames
collected. Note only two frames are
collected and the start and stop points
are displayed.
8. Remove both the Trace Start and Stop
points by right clicking on them.
9. Click on the Single Step icon.
10. Disconnect from the target:
Notes on Trace:
1. This is ETB trace. In the Zynq ETB is 4 Kb. Compression techniques allows more that 4000 frames to be stored.
The data actually comes from PTM trace, but only a few thousand frames can be displayed in ETB. Since many
more frames can be stored in the larger 4 Gb DSTREAM buffer, a greater view of the processor time can be captured.
2. ETB and PTM trace is extremely valuable in debugging, but especially in finding bugs associated with instruction
flow and stack problems. Trace is particularly valuable in system crashes and “how did I get here” problems.
3. Zynq has PTM trace. At the time of this writing it has not been implemented in DS-5. But it will be. It has
satisfactorily been tested on the Zynq Emulation board.
4. If you right click on an assembly instruction in the Disassembly window, more options are available as shown here:
We do not have time to examine all of these at this time.
5. We demonstrated Trace using SMP. You can also select trace for
individual processor Debug Configurations by selecting the appropriate
entry in the Debug operation box.
6. Here is an example of the trace performance analysis when source code
is available:
10 Copyright © 2012 ARM Ltd. All rights reserved
Xilinx Zynq Getting Connected with ARM® DS-5 www.arm.com/ds59) Connecting using Ethernet:
DS-5 can connect to a target running Linux or Android using gdbserver via the Ethernet connector. Your are able to debug
Linux or Android applications. For Linux kernel or driver work, you must use a JTAG connection using DSTREAM.
DS-5 uses the ARM debugger. DS-5 does not use the gdb debugger.
Streamline, the ARM performance analysis program, also uses gdbserver to communicate with the target CPU.
gdbserver: gdbserver is a program that runs in user space in Linux. The ZC702 Linux distribution does not contain it. You
can download the version provided by DS-5 to the ZC702 located at C:\Program Files\DS-5\arm\gdbserver\linux\thumb2.
Ethernet Connection:
1. Connect the Ethernet connector P2 to your PC. The ZC702 uses a fixed IP address 192.168.1.10.
2. Set your PC to a fixed IP address of 192.168.1.11.
TIP: If you use a local network and your router will use DHCP to allocate a suitable address for your PC – such as
192.168.1.168, you can connect to the ZC702 using it as opposed to directly to your PC. You can find the IP address of your
PC by entering IPCONFIG in a DOS command window. In Linux, the corresponding command is ifconfig.
ZC702 Terminal Program (optional):
3. Connect your PC to the ZC702 USB connector USB UART.
4. You can get the USB drivers for your PC here: They need to be installed.
http://www.silabs.com/products/mcu/Pages/USBtoUARTBridgeVCPDrivers.aspx or VCP Driver Kit
5. Connect a terminal program to the appropriate COM port and set the speed to 115200 baud.
6. Power up the ZC702 with the red switch SW11. Or press the switch SW1 POR_B.
7. You will see Linux booting up in the terminal window. It takes about 5 seconds for first characters to appear.
8. Type ping 192.168.1.11 once booted, and if the Ethernet cable is configured and working, you will see replies. If not,
you must fix this problem. You can also open a DOS command window on your PC and type ping 192.168.1.10.
TIP: If you are connecting directly from ZC702 to your PCs Ethernet connection: you might need to use a crossover cable.
Remote Systems: DS-5 provides a connection to the target board using gdbserver over the Ethernet port using SSH and sftp.
1. Start DS-5. Click on the Remote Systems tab to open its pane.
2. Click on the “Define a connection to remote system” icon.
3. In the New Connection window select General and then Linux. Click on Next.
4. In Host Name: box enter 192.168.1.10. In Connection Name: - enter the name you want to use – this will eventually
show in the Remote Systems pane. I chose “ZC702”.
5. Click on Next and select ssh.files. Click on Finish and your new connection will be
created and displayed.
Testing Remote Systems
6. Expand Sftp and then My Home and then Root. If asked for a password, Username is
root and password is root. You will see the filesystem as shown here: If you see this:
everything is working correctly. If not, confirm everything is set as in the directions.
Test your Ethernet connection with Ping. Make sure the target booted correctly.
TIP: If you have trouble with the username or password, right click on your connection name
(ZC702 in this case) and select Clear Password and attempt a connection again.
SSH Terminal:
7. Right click on Ssh Terminals and select Launch Terminal.
8. A terminal will be created in the Terminal pane as shown here:
This will duplicate the USB terminal
but this one operates through SSH.
9. At this point, you can use a Debug
Configuration to connect through SSH
in order to debug Linux or Android applications.
11 Copyright © 2012 ARM Ltd. All rights reserved
Xilinx Zynq Getting Connected with ARM® DS-5 www.arm.com/ds510) Adding gdbserver to the ZC702 Filesystem:
Note: You must have created a Remote Systems connection in order to do this section. Your PC must be connected to the
ZC702 with an Ethernet cable.
To connect DS-5 to the ZC702 target with Ethernet, we need gdbserver copied to the target RAM. DS-5 will supply
arguments to and start gdbserver if required. When you repower the board, this file will be lost and you will need to copy it
again. Normally you also then need to change its permissions to allow execution.
DS-5 provides several versions of gdbserver if your board does not have a copy. Currently, ZC702 does not provide it. DS-5
has the copy for the ZC702 at C:\Program Files\DS-5\arm\gdbserver\linux\thumb2.
1. In the Remote Systems pane, find Local. Expand Local Files, Drives and C:\. This is
your hard drive on your PC and is shown to the right:
2. In C:\, go to directory C:\Program Files\DS-5\arm\gdbserver\linux\thumb2.
3. Highlight gdbserver, right click on it and select Copy.
4. Go to the connection to the Remote Systems you created: I called it ZC702.
5. Expand ZC702 and Sftp files. Right click on My Home and select paste. You will get a window similar to below:
6. Right click on gdbserver and select Properties. Select the Permissions as Execute. Click on Apply and OK.
TIP: “My Home” points to the Linux directory /root.
gdbserver is now ready for DS-5 to start after it has
downloaded a program.
TIP: The connection to the Remote System is the
channel to the gdbserver on the target the Debug
Configuration uses to communicate with the ZC702
target.
Summary:
1. Remote Systems configures the connection to the target’s SSH and sftp servers. It is not needed by DSTREAM.
2. A Debug Configuration describes how the target is debugged (i.e. gdbserver or DSTREAM) and specifies
executable files to be used as well as many other attributes and options.
Remember, if you repower the ZC702 board, gdbserver will be lost. It is stored in RAM.
12 Copyright © 2012 ARM Ltd. All rights reserved
Xilinx Zynq Getting Connected with ARM® DS-5 www.arm.com/ds511) Creating a Zynq Debug Configuration (DC) with Remote Systems (gdbserver):
When using DSTREAM, you created a DC for each of the processors. With gdbserver, you create only one DC.
1. Select Run/Debug Configurations. A window similar to that below opens. I show only a partial view.
2. Click on the New launch configuration icon.
3. Name your Debug Configuration in the Name: box. I chose ZC702 Hello World. Choose your own if you prefer.
This name will show up in the Debug Control pane when saved. You can easily change it later.
4. Select the Platform, Project type and Debug operation entries as shown above:
5. For RSE connection: select the Remote System you created. In this case it is named ZC702. RSE is an acronym for
Remote System Explorer.
6. Click on the Apply button.
7. The Debug icon will be greyed out. The reason is displayed at the top of the window. In this case, the program file
to be run has not yet been specified as shown here:
8. Select Close.
You now have successfully created a new
debug configuration called ZC702 Hello World
that is now visible in the Debug Control pane as
shown here:
Now, the executable program needs to be
entered. See the next page.
13 Copyright © 2012 ARM Ltd. All rights reserved
Xilinx Zynq Getting Connected with ARM® DS-5 www.arm.com/ds512) Hello World example program:
At this point, you have a Debug Configuration file called ZC702 Hello World and a Remote Systems called ZC702 configured
to communicate via gdbserver to the ZC702 target.
Note: gdbserver must have previously been downloaded to the ZC702 board and its permissions set to execute.
The Hello World executable and source files are included in demo.zip. Extract this folder to C:\.
1. Select Run/Debug Configurations. Select ZC702 Hello World.
2. Select the Files tab. The pane below opens:
3. To enter the Hello World
executable file in Application
on host to download: box
select the File
System…button. Select hello
as shown here:
4. Select the Load Symbols box.
5. Enter /tmp for the Target
download directory. Hello
will be placed here at
runtime.
6. Click on the Debugger tab.
Select the Debug from
symbol box. Main will be
entered by default.
7. Hello World is a very simple program. We need not select any other options.
8. Click on Apply and then Close .
9. Note the Debug icon is no longer greyed out. This means the debug configuration is minimally complete
and without obvious errors.
10. At this point you are ready to run Hello World on the ZC702.
Running Hello World:
1. In the Debug Control tab, highlight the ZC702 Hello World
debug configuration.
2. Select the Connect to Target icon. A progress box is
displayed as shown to the right:
3. The ZC702 DC will display as shown in the next screen. The
Call Stack is displayed:
4. Click on the Continue icon.
5. Hello World will run, display in the window and exit
as shown below in the App Console pane:
6. Close the connection when you are finished:
14 Copyright © 2012 ARM Ltd. All rights reserved
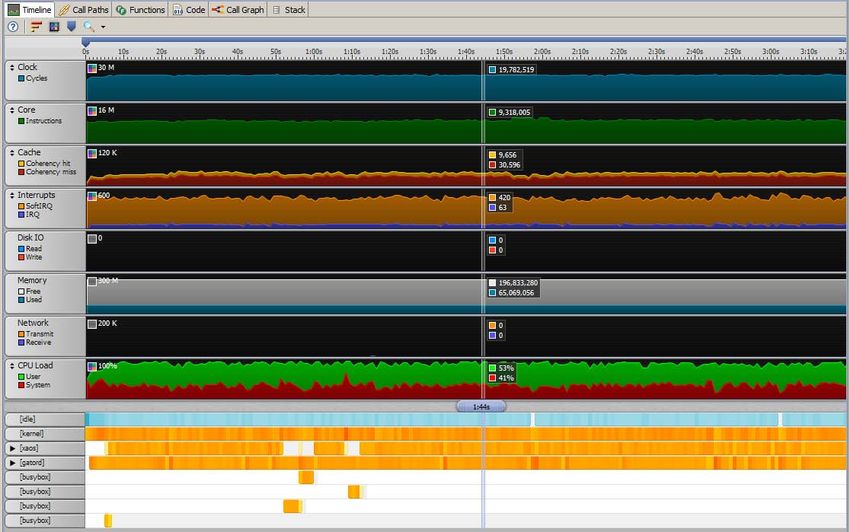
Xilinx Zynq Getting Connected with ARM® DS-5 www.arm.com/ds513) Streamline Performance Analyzer:
Streamline is a component of DS-5. It is a powerful Performance Analyzer tool.
Streamline collects information from performance counters in the Cortex-A9 processors using the Gator program. Gator is
embedded into the Linux kernel. At this time, we do not yet have Linux distribution with Gator installed…but soon…
For more information, please go to www.rm.com/ds5 and select Streamline on the left under Software Tools.
The screens shown were collected from the Zynq Emulation Platform. The first one is a Timeline of system events.
The rest show
attributes of the
Linux system.
Timings can also be
shown as number of
times called.
Streamline provides
an effective method
of looking inside
your system.
15 Copyright © 2012 ARM Ltd. All rights reserved
Xilinx Zynq Getting Connected with ARM® DS-5 www.arm.com/ds5You can also read