1212 EAST BROWARD BOULEVARD - 1212 E Broward Blvd Fort Lauderdale, FL 33301 - Offering Memorandum
←
→
Page content transcription
If your browser does not render page correctly, please read the page content below
Offering Memorandum

1212 EAST BROWARD BOULEVARD
        1212 E Broward Blvd • Fort Lauderdale, FL 33301
                                                      1
NON-ENDORSEMENT AND DISCLAIMER NOTICE

Confidentiality and Disclaimer
The information contained in the following Marketing Brochure is proprietary and strictly confidential. It is intended to be reviewed only by the party receiving it from Marcus & Millichap Real
Estate Investment Services of Florida, Inc. ("Marcus & Millichap") and should not be made available to any other person or entity without the written consent of Marcus & Millichap. This
Marketing Brochure has been prepared to provide summary, unverified information to prospective purchasers, and to establish only a preliminary level of interest in the subject property.
The information contained herein is not a substitute for a thorough due diligence investigation. Marcus & Millichap has not made any investigation, and makes no warranty or representation,
with respect to the income or expenses for the subject property, the future projected financial performance of the property, the size and square footage of the property and improvements,
the presence or absence of contaminating substances, PCB's or asbestos, the compliance with State and Federal regulations, the physical condition of the improvements thereon, or the
financial condition or business prospects of any tenant, or any tenant's plans or intentions to continue its occupancy of the subject property. The information contained in this Marketing
Brochure has been obtained from sources we believe to be reliable; however, Marcus & Millichap has not verified, and will not verify, any of the information contained herein, nor has
Marcus & Millichap conducted any investigation regarding these matters and makes no warranty or representation whatsoever regarding the accuracy or completeness of the information
provided. All potential buyers must take appropriate measures to verify all of the information set forth herein. Marcus & Millichap is a service mark of Marcus & Millichap Real Estate
Investment Services, Inc. © 2018 Marcus & Millichap. All rights reserved.

Non-Endorsement Notice
Marcus & Millichap is not affiliated with, sponsored by, or endorsed by any commercial tenant or lessee identified in this marketing package. The presence of any corporation's logo or
name is not intended to indicate or imply affiliation with, or sponsorship or endorsement by, said corporation of Marcus & Millichap, its affiliates or subsidiaries, or any agent, product,
service, or commercial listing of Marcus & Millichap, and is solely included for the purpose of providing tenant lessee information about this listing to prospective customers.

ALL PROPERTY SHOWINGS ARE BY APPOINTMENT ONLY.
PLEASE CONSULT YOUR MARCUS & MILLICHAP AGENT FOR MORE DETAILS.

1212 E BROWARD BLVD
Fort Lauderdale, FL
ACT ID ZAA0390756

                                                                                                                                                                                                2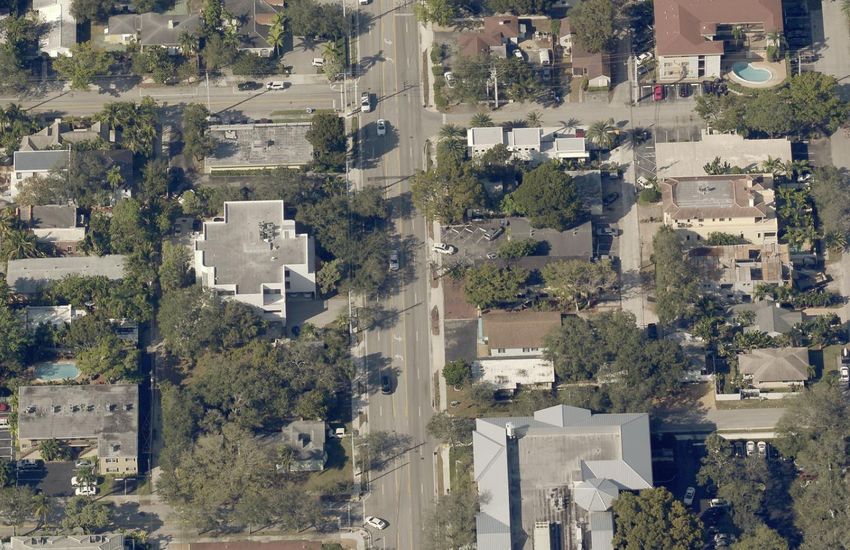
1212 E BROWARD BLVD

                                      TABLE OF CONTENTS

                            SECTION

INVESTMENT OVERVIEW             01
 Offering Summary
 Regional Map
 Local Map
 Aerial Photo

FINANCIAL ANALYSIS              02
 Tenant Summary
 Lease Expiration Summary
 Operating Statement
 Pricing Detail
 Acquisition Financing

MARKET COMPARABLES              03
 Sales Comparables
 Lease Comparables

MARKET OVERVIEW                 04
 Market Analysis
 Demographic Analysis

                                                     3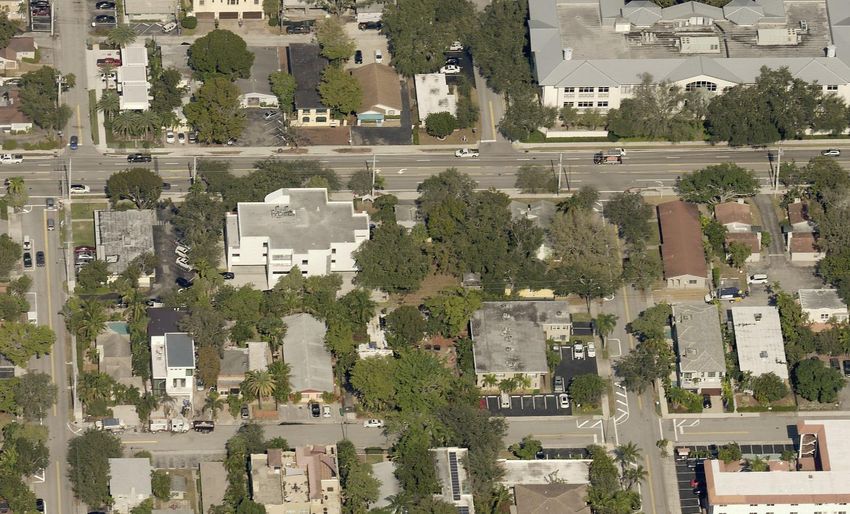
1212 E BROWARD BLVD

    INVESTMENT
    OVERVIEW

                      4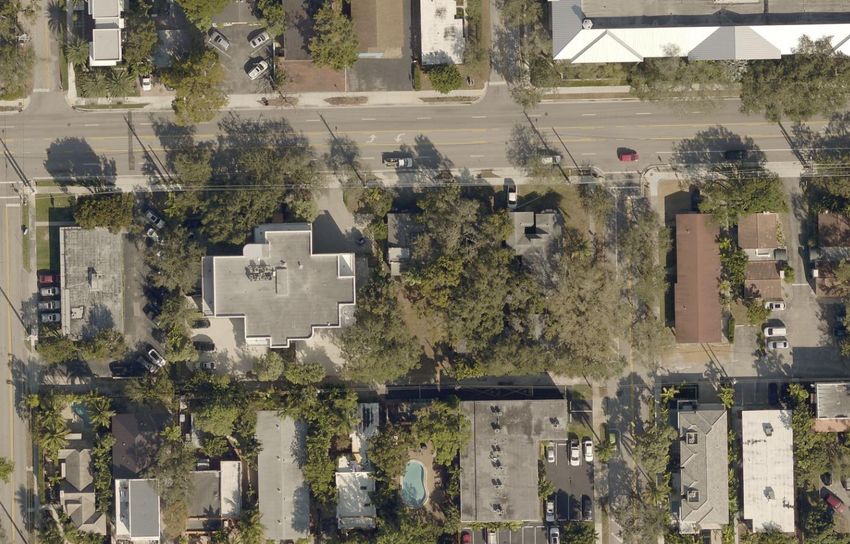
1212 E BROWARD BLVD

                                                                                                                                   OFFERING SUMMARY
EXECUTIVE SUMMARY

                                            VITAL DATA
                                                                                           PRO FORMA
Price                                 $4,200,000    CAP Rate                                      5.01%
Down Payment                   100% / $4,200,000    Net Operating Income                       $210,494
 Loan Type                               All Cash   Net Cash Flow After Debt Service   5.01% / $210,494
   Rentable SF                            14,174    Total Return                       5.01% / $210,494
   Price/SF                              $296.32
Current Occupancy                         50.02%
Year Built                                   1999
Lot Size                             0.44 acre(s)

                                             EXPENSES                                                                         DEMOGRAPHICS
                                                                    PRO FORMA                     $/SF
                                                                                                                                   1-Miles   3-Miles   5-Miles
Licenses & Permits                                                        $678                   $0.05
Janitorial                                                             $13,899                   $0.98    2018 Estimate Pop         20,306   121,481   261,936
Landscaping & Groundskeeping                                             $5,900                  $0.42
                                                                                                          2010 Census Pop           18,473   110,983   240,481
Professional Fees                                                         $450                   $0.03
Repairs & Maintenance                                                    $3,841                  $0.27    2018 Estimate HH          10,943    57,145   114,477
Water                                                                    $6,564                  $0.46
                                                                                                          2010 Census HH             9,794    51,879   104,644
Elevator                                                                 $5,738                  $0.40
Garbage                                                                  $5,577                  $0.39    Median HH Income         $67,937   $52,192   $50,439
Other Utilities                                                          $5,922                  $0.42
                                                                                                          Per Capita Income        $61,818   $41,799   $34,849
Insurance                                                                $8,438                  $0.60
Real Estate Taxes                                                      $70,771                   $4.99    Average HH Income       $113,030   $88,042   $79,200
Management Fee                                                         $10,462                   $0.74
Total Expenses                                                        $138,240                   $9.75

                                                                                                                                                            #5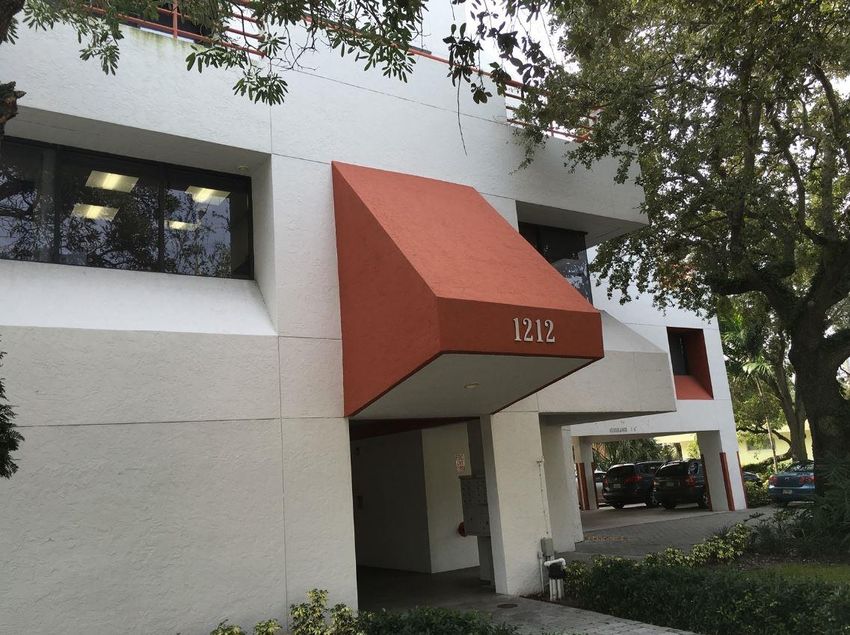
1212 E BROWARD BLVD

                                                                                                                                                    PROPERTY OVERVIEW
PROPERTY OVERVIEW
 Marcus & Millichap is proud to present 1212 East Broward Blvd, a three-story office building located in the Fort-Lauderdale Central Business District. This office building
 is situated on a .44-acre lot (18,993 square feet) and offers approximately 14,174 square feet of rentable space. 1212 E Broward Blvd is currently 50 percent occupied by
 a mix of professional tenants including a dentist, insurance company, and a real estate Investment firm on short-term leases at below market rates. This asset is
 positioned to be well received and strongly sought after by owner-users and investors alike. This three-story office building is an excellent investment opportunity for
 owner-users who are looking for a professional office building with in-place income.

 1212 East Broward Boulevard is in the Fort-Lauderdale Central Business District, which has one of the highest concentrations of bachelor’s degrees, incentivizing
 employers to look for attractive talents. Most of this CBD is occupied by law firms and financial advisory firms. This office building has strong demographics including a
 median household income of $81,221 and a population of 21,517 within a one-mile radius. The robust demographics coupled with increasing employment reflect strong
 demand drivers to meet supply in this Downtown Fort-Lauderdale office submarket. This office building is directly on East Broward Blvd, which has high traffic counts of
 over 30,000 VPD. Just East of US-1, this property provides easy access to Las Olas Blvd, US-1 and proximity to Interstate-95 and Downtown Fort Lauderdale.

 1212 East Broward boulevard has been exceptionally maintained and provides professional curb appeal and ample parking. There are approximately 20 covered parking
 spaces and 16 surface parking spaces on the first floor, providing for a parking ratio of 2.54 per 1,000 square feet of rentable space. The interior of the building consists
 of private offices and open floor space allowing for a wide range of uses and easy configuration. The 2 nd floor consist of five suites and is fully occupied. The third floor is
 vacant in shell condition with terrace access ready for tenant build-out. This asset is extremely easy to manage and is an ideal opportunity for any owner-user given the
 location, convenience, and overall condition of the property.

                                                                                   PROPERTY OVERVIEW

                                                                                    ▪ Exceptionally Maintained Three-Story Office Building With Great Exposure And
                                                                                        Excellent Visibility
                                                                                    ▪ Upside in leasing and Management
                                                                                    ▪ Below Market Rents
                                                                                    ▪ Ideal Investment Opportunity for Owner-User or Investor
                                                                                    ▪ Located on Busy E Broward Blvd, which has High Traffic Counts of Over 30,000 VPD
                                                                                    ▪ Located Within Fort Lauderdale’s CBD
                                                                                    ▪ Proximity to Interstate-95, US-1, and Las Olas Blvd
                                                                                    ▪ Robust Demographics
                                                                                    ▪    14,174 Square Feet of Rentable Space

                                                                                                                                                                                     6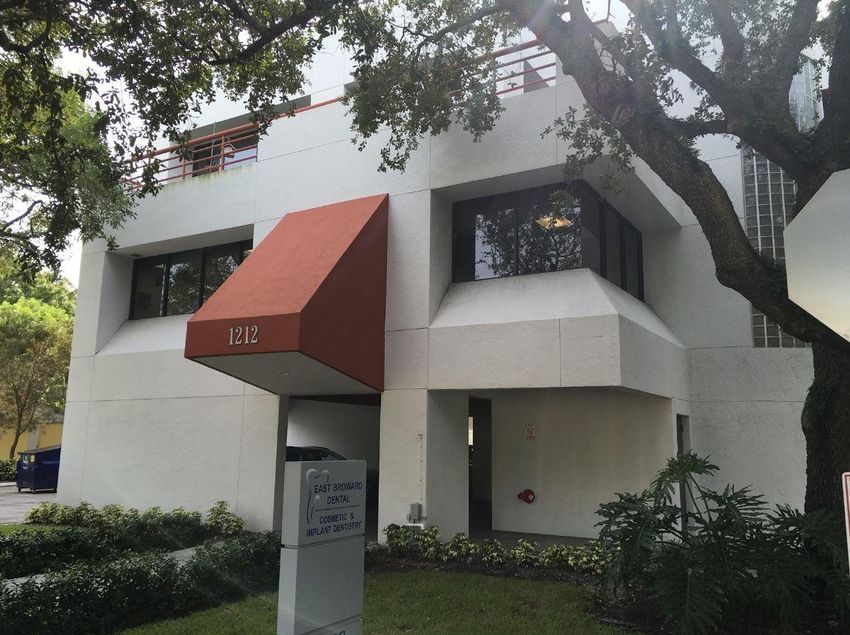
1212 E BROWARD BLVD

                                                                                          OFFERING SUMMARY
PROPERTY SUMMARY

                             THE OFFERING
Property                                                         1212 E Broward Blvd
Price                                                                      $4,200,000
Property Address                            1212 E Broward Blvd, Fort Lauderdale, FL
Assessors Parcel Number                                             50-42-11-01-1260
Zoning                          RO, Residential Office District City of Fort Lauderdale
                            SITE DESCRIPTION
Number of Floors                                                                     3
Year Built/Renovated                                                             1987
Rentable Square Feet                                                            15,204
Ownership                                                                  Fee Simple
Lot Size                                                     Acre(s):0.4 Sq Ft: 17554
Parking                                                            36 Parking Spaces
Parking Ratio                                                          2.54 : 1,000 SF
Topography                                                                       Level
Intersection/Cross Street                           East Broward Blvd & SE 12th Ave
                                UTILITIES
Electric                                                                     Yes, FPL
Water                                                     Yes, City of Fort Lauderdale
Sewer                                                     Yes, City of Fort Lauderdale
Trash                                                     Yes, City of Fort Lauderdale

                            CONSTRUCTION
Foundation                                                                  Stem Wall
Patio,Floora                                     Concrete / troweld or keystone finish
Exterior                                                                   C.B Stucco
Parking Surface                                                                Asphalt
Roof                                                               Bar Joist Concrete
Roof Material                                                             Tar & Gravel
Ceiling Height                                                                 10' -12'
                              MECHANICAL
HVAC                                                      Yes, City of Fort Lauderdale
Elevators                                                                      Yes - 2
Life Safety                                                                        Yes
Security                                                                           Yes
On-Site Maintenance                                                                Yes

                                                                                                       #7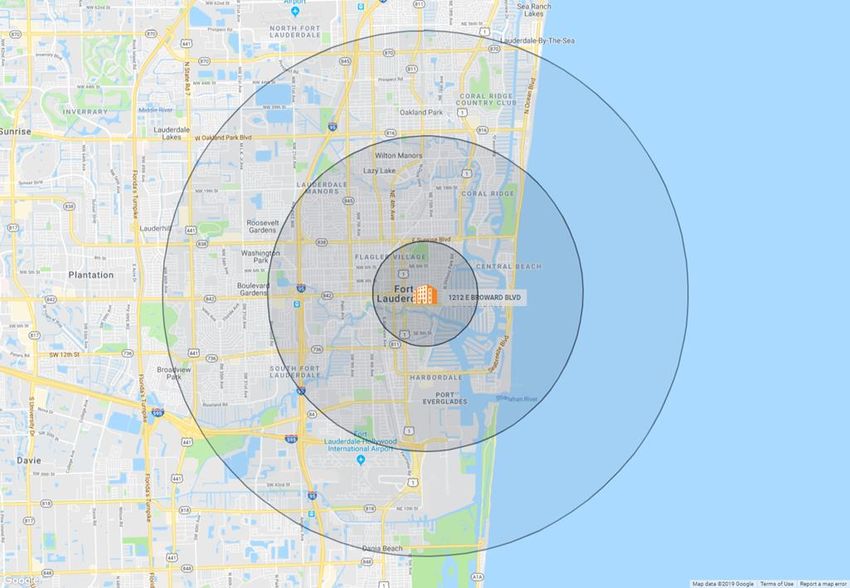
8
    1212 E BROWARD BLVD

                          REGIONAL MAP

                                    8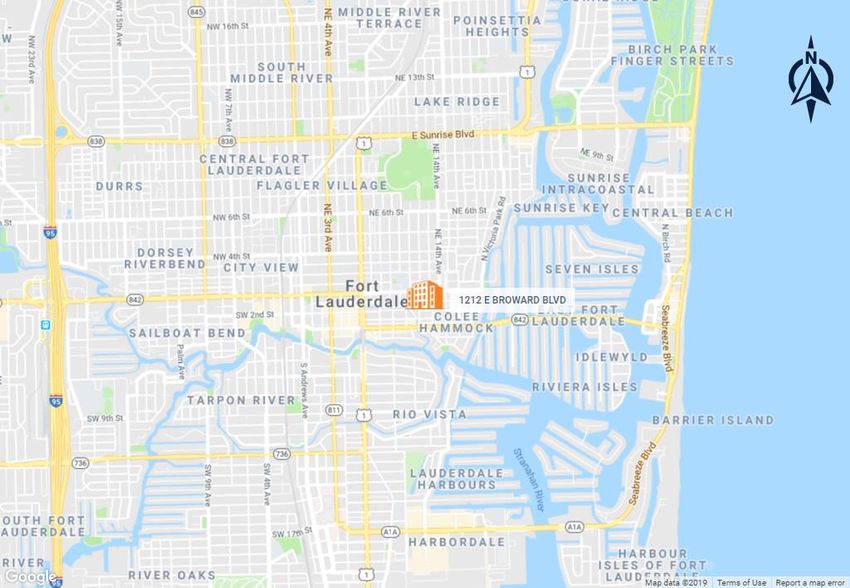
9
    1212 E BROWARD BLVD

                          LOCAL MAP

                                 9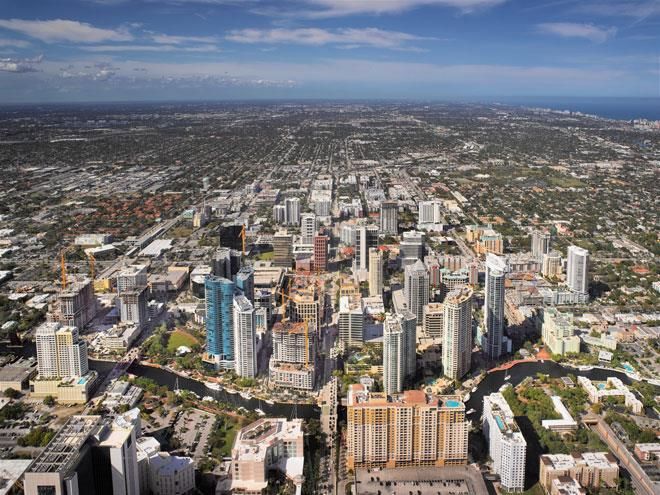
1212 E BROWARD BLVD

                      SURVEY

                         10
1212 E BROWARD BLVD
SURVEY
111212 E BROWARD BLVD
2nd FLOOR PLAN
121212 E BROWARD BLVD
3rd FLOOR PLAN
131212 E BROWARD BLVD
INVESTMENT HIHGLIGHTS
Amid the redevelopment of downtown Fort Lauderdale, lease rates for apartments,
offices and retail shops have jumped over the last five years, according to a recently
released report by the Fort Lauderdale Downtown Development Authority.
Downtown Fort Lauderdale is in the midst of a boom that is introducing micro-unit
apartment buildings to the area and the first new office project in more than a decade,
Krasnow said. Colliers prepared the 2019 state-of-the-market report for the Fort
Lauderdale Downtown Development Authority.
According to the report, office rents skyrocketed from an average of $10 per square foot
in 2013 to $34 per square foot in 2018. The average rent per month for a one-bedroom
apartment increased by $200 to $1,954 during the same time period, and retail landlords
are scoring an average of $36 per square foot triple net rent, representing a 170 percent
growth rate since 2013.
“We are at the top of the market, but we still believe this market has a lot of runway,”
Krasnow said. “People want to work here. People want to rent here. The retail market is
extremely strong. More importantly, the investor demand is there.”
During a panel discussion about Main Las Olas, the mixed-use project that features a new
office tower, speaker Mark Portner affirmed Krasnow’s assessment of downtown Fort
Lauderdale. Portner is a managing director with Shorenstein Company, the real estate
investment firm that has partnered with Stiles Corp. to build Main Las Olas, a 2.7-acre
project that includes land leased from Broward College. The development entails 357,000
square feet of Class A office space, a 341-unit apartment tower, restaurants and retail
space. About 85,000 square feet has already been leased to Akerman LLP, Berger
Singerman LLP and BBX Capital.
“We have been following the whole urbanization of downtown,” Portner said. “The
hotels, offices and new residences are all the ingredients that bring workers downtown.
Even though Fort Lauderdale is smaller than other commercial business districts we invest
in around the country, we jumped on the opportunity.”
141212 E BROWARD BLVD
INVESTMENT HIHGLIGHTS
69,863 views Apr 28, 2018, 05:55pm Fort Lauderdale Is Booming: Here's Why
Fort Lauderdale is booming with development. It’s become a city of choice for savvy investors, both commercial and residential. Once known as the mecca for spring break and teenage
beach movies — think Where The Boys Are with Connie Frances and Girl Happy starring Elvis Presley — Fort Lauderdale has grown up.
"Historically, Fort Lauderdale had always been a secondary market to Miami. Then, when prices kept rising in Miami, developers started looking for cheaper dirt and came here. We have
a relaxed coastal environment, beautiful beachfront and a strong commerce center with 7.5 million of class A office space in our downtown," notes Jenni Morejon, executive director
of Fort Lauderdale Downtown Development Authority (DDA)
"We have significant luxury development both in residential and hospitality underway. The residential component has a high level of amenities, service and finishes in beautiful ocean
front locations. On the hospitality side, the Four Seasons is building a beautiful property, and there was a $150 million renovation at the W Fort Lauderdale," Morejon adds.
To satisfy the increasing residential base, Morejon points to over 1,000 restaurant seats coming online over the next several months on Las Olas, Fort Lauderdale’s dining, shopping and
entertainment destination for tourists and residents alike. "Las Olas (Spanish for 'waves') Boulevard is our crown jewel, connecting the beach and downtown core," she says.
The privately owned Brightline, a train with diesel-electric engines, inaugurated service between Fort Lauderdale and West Palm Beach in January. Morejon sees this as another game
changer for Fort Lauderdale when the Brightline extends from Miami to West Palm Beach with a stop in Fort Lauderdale.
Who is buying in Fort Lauderdale? The Fort Lauderdale buyer is very different than in Miami. "About 75% of our buyers either have a tie to the area versus Miami, where many buyers are
investors or from South America," Campbell observes.
Craig Studnicky, principal of International Sales Group (ISG), has over 25 years of experience in the South Florida residential market. "Fort Lauderdale has always been compared to Miami
Beach, but now its value in terms of price per square foot is at an all-time high," he says. "From 1990 to 2010, the annual difference in price per square footage between these two
destinations was roughly 25%. In May 2016, this difference jumped to 261% due to the slew of new inventory. This means that a buyer can get the same ocean views, amenities, finishes
and services in Fort Lauderdale but at almost half the price.“
Fort Lauderdale’s retail market is thriving with over 2.6 million square feet of commercial real estate completed, under construction or approved since 2012.
According to Colliers International Fort Lauderdale Market Pulse Q1 2018|Overview, Fort Lauderdale jumped to sixth place in the Top 10 U.S. Markets To Watch. This is the first time Fort
Lauderdale even made it into the Top 10. Retail rents in downtown Fort Lauderdale have a five-year growth prediction of 48% compared with 42% in Miami-Dade. Since 2013, Fort
Lauderdale’s downtown retail rents have increased 51% to $35.75 per square foot compared with a 14% increase throughout Broward County. (Fort Lauderdale is in Broward County.)
With the area a vacation destination and national cruise hub, total visitors through Fort Lauderdale-Hollywood International Airport rose 11.3% from 2016 to 2017, to 32.5 million. In
addition, JetBlue, Southwest and Emirates have launched new routes within the past year to and from Fort Lauderdale, expanding the potential visitor market, an added boost to area
residents for business and leisure travel.
William Hardin, PhD, professor of finance and real estate and director of the Hollo School of Real Estate at Florida International University in Miami, explains the market dynamics: "Fort
Lauderdale offers relative value compared to Miami. There is good luxury product there now that appeals to the buyer wanting a different pace than Miami."
151212 E BROWARD BLVD
NE 13th Ave
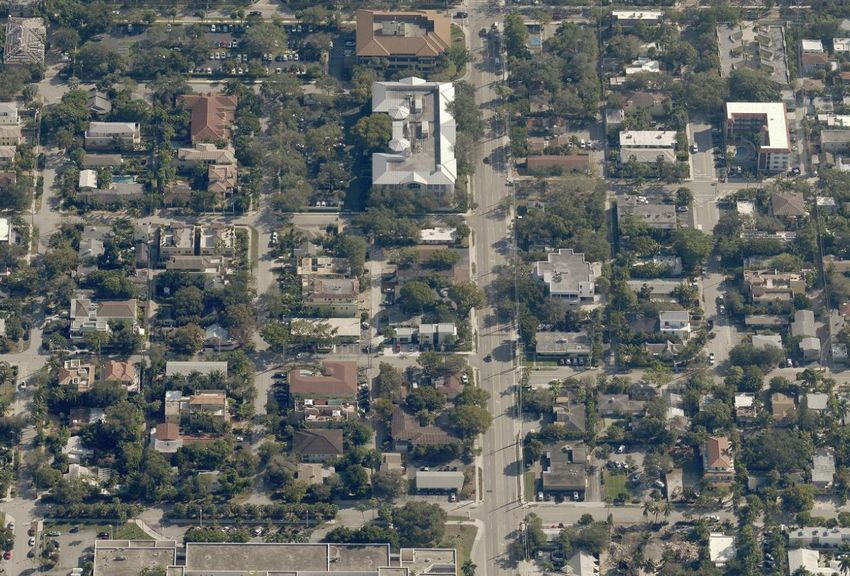
NE 12th Ave AERIAL PHOTO
East Broward Blvd – Over 30,000 VPD
SE 12th Ave
SE 13th Ave
161212 E BROWARD BLVD
AERIAL PHOTO
NE 12th Ave
East Broward Blvd – Over 30,000 VPD
SE 12th Ave
SE 1st St
171212 E BROWARD BLVD
AERIAL PHOTO
NE 12th Ave
East Broward Blvd – Over 30,000 VPD
NE 13th Ave
SE 13th Ave
181212 E BROWARD BLVD
AERIAL PHOTO
NE 14th Ave
SE 13th Ave
East Broward Blvd – Over 30,000 VPD
NE 13th Ave
NE 1st St
NE 12th Ave
SE 12th Ave
NE 11th Ave SE 11th Ave
191212 E BROWARD BLVD
PROPERTY PHOTO
201212 E BROWARD BLVD
PROPERTY PHOTO
211212 E BROWARD BLVD
PROPERTY PHOTO
Marcus & Millichap closes
more transactions than any
other brokerage firm.
12
221212 E BROWARD BLVD
FINANCIAL
ANALYSIS
231212 E BROWARD BLVD
FINANCIAL ANALYSIS
TENANT SUMMARY
% Annual Pro Forma Renewal Options
Square Bldg. Lease Dates Rent per Total Rent Total Rent Rent Lease and Option Year
Tenant Name Suite Feet Share Comm. Exp. Sq. Ft. Per Month Per Year Per Year Type Rental Information
2 5-Yr Renewal Options at FMV. Reimburse pro
East Broward Dental 200-201 3,309 23.3% 3/19/13 2/28/23 $20.22 $5,576 $66,908 $70,945 NNN
rata share Increase of Base Year Expense
Closed, LLC 202-203 2,106 14.9% 9/1/19 8/31/21 $27.35 $4,800 $57,600 $58,976 Gross Pro Forma . No Renewal Option
Offerlane 204 1,675 11.8% 9/1/19 8/31/21 $22.66 $3,162 $37,945 $46,892 Gross Pro Forma . No Renewal Option
Vacant 3rd Floor 7,084 50.0% - - $0.00 $0 $0 $198,352 Pro Forma
Total 14,174 $11.46 $13,538 $162,453 $375,165
Occupied Tenants: 3 Unoccupied Tenants: 1 Occupied GLA: 50.00% Unoccupied GLA: 50.00%
Total Current Rents: Occupied Current Rents: Unoccupied Current Rents: $0
$13,538 $13,538
NOTES
- Pro forma rent assumes annual scheduled increases and $28/sf FSG for vacant space and those tenants whose lease expires prior 1/1/2022
- East Broward Dental Reimburses all operating expenses over 2017 Base Year.
- 2017 Base Year Expenses: $118,869
- Ideal Owner-User investments
- The property is currently generating a net operating income of $40,500
241212 E BROWARD BLVD
FINANCIAL ANALYSIS
LEASE EXPIRATION SUMMARY
Lease Expiration Summary Year 4, 23.35%
Year 2, 26.68%
Year Tenant SF %of RBA 2019 Rent Expiration
2 Closed, LLC 2,106 14.86% $27.35 8/31/2021
Offerlane 1,675 11.82% $22.66 8/31/2021
4 East Broward Dental 3,309 23.35% $20.22 2/28/2023
251212 E BROWARD BLVD
FINANCIAL ANALYSIS
OPERATING STATEMENT
Income Pro Forma Per SF
Scheduled Base Rental Income 375,165 26.47
Expense Reimbursement Income
Net Lease Reimbursement
Base Stop Reimbursements 11,086 0.78
Total Reimbursement Income $11,086 8.0% $0.78
Potential Gross Revenue 386,250 27.25
General Vacancy (37,516) 10.0% (2.65)
Effective Gross Revenue $348,734 $24.60
Operating Expenses Pro Forma Per SF
Licenses & Permits 678 0.05
Janitorial 13,899 0.98
Landscaping & Groundskeeping 5,900 0.42
Professional Fees 450 0.03
Repairs & Maintenance 3,841 0.27
Water 6,564 0.46
Elevator 5,738 0.40
Garbage 5,577 0.39
Other Utilities 5,922 0.42
Insurance 8,438 0.60
Real Estate Taxes 70,771 4.99
Management Fee 10,462 3.0% 0.74
Total Expenses $138,240 $9.75
Expenses as % of EGR 39.6%
Net Operating Income $210,494 $14.85
NOTES
- Pro forma rent assumes annual scheduled increases and $28/sf FSG for vacant space and those tenants whose lease expires prior 1/1/2022
- East Broward Dental Reimburses all operating expenses over 2017 Base Year.
- 2017 Base Year Expenses: $118,869
- The property is currently generating a net operating income of $40,500
- Property taxes are based on the proposed value
- Ideal Owner-User investments
261212 E BROWARD BLVD
FINANCIAL ANALYSIS
PRICING DETAIL
Summary Operating Data
Price $4,200,000
Down Payment $4,200,000
Down Payment % 100% Income Pro Forma
Number of Suites 4 Scheduled Base Rental Income $375,165
Price Per SqFt $296.32 Total Reimbursement Income 3.0% $11,086
Rentable Built Area (RBA) 14,174 SF Potential Gross Revenue $386,250
Lot Size 0.44 Acres General Vacancy 10.0% ($37,516)
Year Built/Renovated 1999
Effective Gross Revenue $348,734
Occupancy 50.02%
Less: Operating Expenses 39.6% ($138,240)
Net Operating Income $210,494
Cash Flow $210,494
Returns Current Pro Forma Total Return 5.01% $210,494
CAP Rate 0.97% 5.01%
Operating Expenses Pro Forma
CAM $48,569
Insurance $8,438
Real Estate Taxes $70,771
Management Fee $10,462
Total Expenses $138,240
Expenses/Suite $34,560
Expenses/SF $9.75
NOTES
- Pro forma rent assumes annual scheduled increases and $28/sf FSG for vacant space and those tenants whose lease expires prior 1/1/2022
- East Broward Dental Reimburses all operating expenses over 2017 Base Year.
- 2017 Base Year Expenses: $118,869
- The property is currently generating a net operating income of $40,500
- Property taxes are based on the proposed value
- Ideal Owner-User investments
- CAM expenses include all expenses except insurance, taxes, and management
271212 E BROWARD BLVD
ACQUISITION FINANCING
MARCUS & MILLICHAP CAPITAL CORPORATION WHY MMCC?
CAPABILITIES Optimum financing solutions
to enhance value
MMCC—our fully integrated, dedicated financing arm—is committed to
providing superior capital market expertise, precisely managed execution, and
unparalleled access to capital sources providing the most competitive rates and Our ability to enhance
terms. buyer pool by expanding
finance options
We leverage our prominent capital market relationships with commercial banks,
life insurance companies, CMBS, private and public debt/equity funds, Fannie
Mae, Freddie Mac and HUD to provide our clients with the greatest range of Our ability to enhance
financing options. seller control
• Through buyer
Our dedicated, knowledgeable experts understand the challenges of financing
qualification support
and work tirelessly to resolve all potential issues to the benefit of our clients.
• Our ability to manage buyers
finance expectations
• Ability to monitor and
manage buyer/lender
progress, insuring timely,
predictable closings
• By relying on a world class
Closed 1,678 National platform $6.24 billion Access to
set of debt/equity sources
debt and equity operating total national more capital
financings within the firm’s volume in 2018 sources than and presenting a tightly
in 2018 brokerage any other firm underwritten credit file
offices in the industry
281212 E BROWARD BLVD
MARKET
COMPARABLES
291212 E BROWARD BLVD
SALES COMPARABLES MAP
1212 E BROWARD BLVD
(SUBJECT)
1 212 SE 8th St
2 14 Rose Dr
3 300 SW 1st Ave
SALES COMPARABLES
30PROPERTY
1212 E BROWARD
NAME BLVD
SALES COMPARABLES
SALES COMPARABLES SALES COMPS AVG
Average Price Per Square Foot
$400.00
Avg. $370.39
$360.00
$320.00
$280.00
$240.00
$200.00
$160.00
$120.00
$80.00
$40.00
$0.00
1212 E 212 14 Rose Dr 300 SW 1st
Broward SE 8th St Ave
Blvd
31PROPERTY
1212 E BROWARD
NAME BLVD
SALES COMPARABLES
MARKETING TEAM
SALES COMPARABLES
212 SE 8TH ST 14 ROSE DR
1212 E BROWARD BLVD 212 SE 8th St, Fort Lauderdale, FL, 33316 14 Rose Dr, Fort Lauderdale, FL, 33316
1212 E Broward Blvd, Fort Lauderdale, FL, 33301
1 2
rentpropertyname1 rentpropertyname1 rentpropertyname1
Asking Price $4,200,000 Close of Escrow 6/20/2019 Close of Escrow 1/31/2019
Price/SF $296.32 Sales Price $1,400,000 Sales Price $1,800,000
Pro Forma CAP Rate 5.01% Rentable SF 3,500 Rentable SF 5,513
Pro Forma Occupancy 90% Price/SF $400.00 Price/SF $326.50
Year Built 1999 Year Built 1990 Year Built 2004
Occupancy 50%
Parking Ratio 2.54 : 1,000 sf
rentpropertyaddress1 rentpropertyaddress1 rentpropertyaddress1
NOTES NOTES
This comparable represents an owner-user transaction. This comparable represents an owner-user transaction.
32PROPERTY
1212 E BROWARD
NAME BLVD
SALES COMPARABLES
MARKETING TEAM
SALES COMPARABLES
300 SW 1ST AVE
300 SW 1st Ave, Fort Lauderdale, FL, 33301
3
rentpropertyname1 rentpropertyname1 rentpropertyname1
Close of Escrow 7/20/2018
Sales Price $3,600,000
Rentable SF 9,359
Price/SF $384.66
CAP Rate 3.32%
Year Built 1972
rentpropertyaddress1 rentpropertyaddress1 rentpropertyaddress1
NOTES
This comparable was previously owner-occupied however at sale the
seller vacated the property. The property was generating a net operating
income of $119,520.
331212 E BROWARD BLVD
8 LEASE COMPARABLES MAP
1212 E BROWARD BLVD
(SUBJECT)
1 800 S Andrews Ave
2 Advocate Building
3 Trial Law Building
4 Andrews Office Centre
7
8
9
10
11
12
13
14
15
16
17
18
20
34PROPERTY
1212 E BROWARD
NAME BLVD
LEASE COMPARABLES
AVERAGE OCCUPANCY
93 Avg. 90.30%
84
74
65
56
47
37
28
19
9
0
1212 E 800 S Advocate Trial Law Andrews
Broward Andrews Ave Building Building Office
Blvd Centre
35PROPERTY
1212 E BROWARD
NAME BLVD
LEASE COMPARABLES
AVERAGE RENT PER SQUARE FOOT
Avg. $28
$29
$26
$23
$20
$17
$15
$12
$9
$6
$3
$0
1212 E 800 S Advocate Trial Law Andrews
Broward Andrews Ave Building Building Office
Blvd Centre
36PROPERTY
1212 E BROWARD
NAME BLVD
LEASE COMPARABLES
MARKETING TEAM
1212 E BROWARD BLVD 800 S ANDREWS AVE ADVOCATE BUILDING
1212 E Broward Blvd, Fort Lauderdale, FL, 33301 800 S Andrews Ave, Fort Lauderdale, FL, 33316 315 SE 7th St, Fort Lauderdale, FL, 33301
1 2
rentpropertyname1 rentpropertyname1 rentpropertyname1
Available SF 7,084 Survey Date 09/2019 Survey Date 09/2019
Effective Rent/SF $24 Rentable SF 16,259 Rentable SF 18,700
Pro Forma Rent/SF $28 Available SF 1,788 Available SF 1,683
Year Built 1999 Asking Rent/SF $28.00 Asking Rent/SF $27.00
Occupancy 50% Year Built 2004 Year Built 1979
Lease Type Gross Occupancy 89% Occupancy 91%
Lot Size 0.44 acre(s) Lease Type Gross Lease Type Gross
Parking Ratio 2.54 : 1,000 sf Lot Size 0.23 Lot Size 0.49
rentpropertyaddress1 rentpropertyaddress1 rentpropertyaddress1
NOTES NOTES
This comparable represents 2,159 square feet leased to TBG Partners on This comparable represents 1,486 square feet leased to Haddad &
January 2018 on a five-Year lease. Navarro Law February 2018 on a three-year lease.
37PROPERTY
1212 E BROWARD
NAME BLVD
LEASE COMPARABLES
MARKETING TEAM
TRIAL LAW BUILDING ANDREWS OFFICE CENTRE
633 SE 3rd Ave, Fort Lauderdale, FL, 33301 1777 S Andrews Ave, Fort Lauderdale, FL, 33316
3 4
rentpropertyname1 rentpropertyname1 rentpropertyname1
Survey Date 09/2019 Survey Date 09/2019
Rentable SF 30,949 Rentable SF 11,537
Asking Rent/SF $28.00 Asking Rent/SF $28.00
Year Built 1980 Year Built 1981
Occupancy 89% Occupancy 92%
Lease Type Gross Lease Type Gross
Lot Size 1.01 Lot Size 0.60
rentpropertyaddress1 rentpropertyaddress1 rentpropertyaddress1
NOTES NOTES
This comparable represents 2,166 square feet leased to David Bogenshutz This lease comparable represents 1,669 square feet leased to Curtis
and Associates PA on September 2018 on a three-year lease Schwartz June 2018 on a five-year lease
381212 E BROWARD BLVD
MARKET
OVERVIEW
391212 E BROWARD BLVD
MARKET OVERVIEW
BROWARD COUNTY
OVERVIEW
Broward County is located in South Florida and contains a population
of 1.9 million people. The county is bordered to the north and south by
Palm Beach and Miami-Dade counties, respectively. On the east is the
Atlantic Ocean and Big Cypress National Reserve is to the west. The
Everglades cover the western portion of the county, restricting
development. As limited land is available for construction, any
significant growth is upward rather than outward. Roughly 23 miles of
shoreline and 300 miles of inland waterways provide a wide range of
recreation and transport uses. Fort Lauderdale is the largest city in the
county with 180,700 residents followed by Pembroke Pines with
167,000 people.
METRO HIGHLIGHTS
STRONG POPULATION GROWTH
Broward County’s population continues to grow at a
pace well above the U.S. rate. In-migration
accounts for a large share of new residents.
DESIRABLE CORPORATE LOCATION
Companies are attracted to the metro for its
proximity to Latin American markets, large educated
workforce and desirable climate.
HOUSING AFFORDABILITY
Home prices are more affordable in Broward
County than in many other coastal counties.
401212 E BROWARD BLVD
MARKET OVERVIEW
ECONOMY
▪ Key economic drivers include tourism, healthcare, biotechnology and commerce.
▪ As a major point of access to both international trade and cruise tourism, Port Everglades
generates roughly $30 billion of economic activity per year.
▪ The significant population of elderly residents results in healthcare playing a major role in
the county’s economy.
▪ A diverse array of companies are headquartered in the area, including Citrix Systems,
AutoNation and Heico.
MAJOR AREA EMPLOYERS
Ultimate Software
Nova Southeastern University
American Express
Spirit Airlines
Kaplan Higher Education
Citrix Systems
DHL Express
JM Family Enterprises
AutoNation
* Forecast
Trividia Health
SHARE OF 2018 TOTAL EMPLOYMENT
3%
MANUFACTURING
18%
PROFESSIONAL AND
12%
GOVERNMENT
11%
LEISURE AND HOSPITALITY
7%
FINANCIAL ACTIVITIES
BUSINESS SERVICES
22%
TRADE, TRANSPORTATION
6%
CONSTRUCTION
+ 13%
EDUCATION AND
2%
INFORMATION
5%
OTHER SERVICES
AND UTILITIES HEALTH SERVICES
411212 E BROWARD BLVD
MARKET OVERVIEW
DEMOGRAPHICS
▪ Since 2000, the county’s population has increased by roughly 278,000 residents.
During the next five years, the county will add approximately 72,000 residents.
▪ In the same time period, the number of households will rise by 35,000.
▪ An increase in education attainment provides a skilled labor pool and has helped
boost income levels. Almost 31 percent of residents age 25 and older have at least a
bachelor’s degree.
2018 Population by Age
6% 18% 6% 27% 28% 16%
0-4 YEARS 5-19 YEARS 20-24 YEARS 25-44 YEARS 45-64 YEARS 65+ YEARS
2018 2018 2018 2018 MEDIAN
POPULATION: HOUSEHOLDS: MEDIAN AGE: HOUSEHOLD INCOME:
1.9M 748K 40.3 $56,200
Growth Growth U.S. Median: U.S. Median:
2018-2023*: 2018-2023*:
3.8% 4.7% 38.0 $58,800
QUALITY OF LIFE
Broward County has one of the most desirable climates in the United States and has a
wide variety of recreational opportunities and cultural amenities. The metro boasts 300 ARTS & ENTERTAINMENT
days of sunshine annually, and the average winter temperature is 78 degrees. Fort
Lauderdale is known as the “Venice of America” for its inland canals. In addition, more than
145 marinas along Fort Lauderdale’s inland waterways cater to boating and fishing needs.
Various professional sports are nearby in Miami. There are also more than 40 golf courses
in the county. Other attractions include the NSU Art Museum Fort Lauderdale, the Broward
Center for the Performing Arts, Flamingo Gardens, Museum of Discovery and Science,
Symphony of the Americas and the International Swimming Hall of Fame.
*Forecast
Sources: Marcus & Millichap Research Services; BLS; Bureau of Economic Analysis; Experian; Fortune; Moody’s
Analytics; U.S. Census Bureau
421212 E BROWARD BLVD
MARKET OVERVIEW
SOUTH FLORIDA METROS
Vacancies and Rents Improve Even as Development
Expands in Some Southeast Florida Markets Office 2019 Outlook
After moderated period, construction ramps up in West Palm Beach and Fort Y-O-Y
Asking Y-O-Y
Lauderdale while fundamentals carry momentum. A subdued development pipeline Metro Vacancy BasisPoint
Rent Change
and consistent demand for space has substantially improved office operations in Change
West Palm Beach over the past several years. The market’s vacancy rate has
dropped from a cycle high of 20.7 percent in 2010 to under 14.0 percent this year,
the most substantive recovery in the region. Availability will decline sharply again in Miami 12.7% -10 $35.81 2.4%
2019 despite a year-over-year rise in deliveries, as the metro’s largest completions
are already fully leased. A similar expansion to the construction pipeline in Fort Fort Lauderdale 12.9% 0 $29.75 4.6%
Lauderdale will hold vacancy flat this year but not impede rent growth. Monthly rates
are appreciating at a rapid clip here as biotech and business development companies West Palm Beach 13.4% -70 $30.46 4.4%
like Ultimate Software absorb more space.
Fewer arrivals pave way for rent growth in Miami. In contrast to the rest of Southeast Investment Trends
Florida, the development pipeline in Miami is contracting this year. Although Miami
deliveries will still surpass 1 million square feet, ongoing leasing by healthcare
• Greater interest from institutional investors translated into several recent
companies, coworking enterprises and business services firms sustains demand.
high-caliber trades in Downtown Miami and nearby Brickell. Initial returns for
Availability will dip this year following a supply-driven increase in 2018, with vacancy
these assets were in the mid-4 percent zone.
particularly tight in Miami City, West Miami and Medley/Hialeah. A strong interest in
occupying office space in these and other submarkets bodes well for rent growth this • Trade volume improved year over year in Kendall as multiple Class B and C
assets changed hands for under $10 million with cap rates in the high-6 to
year, even though asking rates are already some of the highest in the state of Florida.
high-7 percent range, above the high-5 percent metro average.
Fort Lauderdale
• Private investors have been more active than institutions so far this year as
regionally low entry costs attracted parties from outside the market. Sales
activity rose notably in Pompano Beach as buyers pursued Class B assets
with mid-6 to mid-7 percent initial yields.
• Medical office properties acquired in recent months provided above-market
initial returns. Several Class B and C assets in the city of Fort Lauderdale
were exchanged with cap rates up to mid-8 percent.
West Palm Beach
• West Palm Beach investors focus on business hubs in Boca Raton, Delray
Beach and other areas to obtain properties with high-credit tenants as the
metro lacks a prominent central business district.
• Buyers targeting regionally high yields have pursued opportunities in North
* Cap rate trailing 12-month average through 1Q; Treasury rate as of March 29
Includes sales $1 million and greater for Miami, Fort Lauderdale and West Palm Beach Palm Beach. Post 1980-built, sub-30,000-square-foot assets have traded
Sources: CoStar Group, Inc.; Real Capital Analytics recently with cap rates in the 7 to 8 percent zone.
431212 E BROWARD BLVD
MARKET OVERVIEW
SOUTH FLORIDA METROS: FORT LAUDERDALE
1Q19 – 12-Month Trend
EMPLOYMENT CONSTRUCTION VACANCY RENTS
increase in total square feet basis point decrease
1.6% employment Y-O-Y
325,500 completed
20 in vacancy Y-O-Y
7.5% increase in the
average asking rent
Y-O-Y Y-O-Y
• Local employers added about • The development pipeline • The metrowide vacancy rate • The average marketed rental
13,400 personnel to staffs over expanded over the past four dipped down to 13.0 percent rate improved by the highest
the past four quarters, about 600 quarters as construction year over year in the first margin in more than a decade
more jobs than were created activity increased in Cypress quarter, led by triple-digit to $28.91 per square foot in
during the previous annual Creek, Northwest contractions in Sawgrass March. A year ago, rents had
period. Broward/Coral Springs and Park, Commercial Boulevard, appreciated by 3.1 percent on
• Employment growth was higher Southwest Broward County. Northwest Broward/Coral average.
among traditionally office-using • Major deliveries to the metro Springs and Hollywood. • Declining availability in
professions at a 3.2 percent since March 2018 include a • Southwest Broward is now multiple submarkets
annual increase in March. Over pair of medical office the least vacant submarket at contributed to above-market
that time, the professional and properties, the 81,700-square- 8.0 percent in Fort Lauderdale, rent growth, particularly in
business services and the foot Cypress Creek Medical followed by Hollywood at 9.1 Sawgrass Park and Northwest
education and health services Pavilion and the Cleveland percent. All other submarkets Broward/Coral Springs.
sectors hired a combined 9,000 Clinic in Coral Springs, which have availability of 10 percent Demand for urban office
individuals. spans 63,360 square feet. or higher. space also helped drive
asking rates up more than 15
percent downtown.
* Forecast
441212 E BROWARD BLVD
MARKET OVERVIEW
SOUTH FLORIDA METROS: FORT LAUDERDALE
Submarket Trends
Lowest Vacancy Rates 1Q19*
Y-O-Y
Vacancy Asking Y-O-Y %
Submarket BasisPoint
Rate Rent Change
Change
Southwest Broward 8.0% 100 $30.34 5.0%
*1Q19
**2018 Hollywood 9.1% -220 $28.02 -2.1%
Sales Trends
Competitive Sales Pricing Drives Increased Trade Velocity for Class B/C Assets Pompano Beach 11.5% -120 $23.26 2.8%
• Trade velocity rose over the past 12 months ending in March as lower average sale
prices than in the region’s other primary metros attracted more buying activity in the Sawgrass Park 11.9% -570 $30.01 10.4%
sub-$10 million tranche.
• More Class B and C office sales contributed to an overall slower rate of price Northwest
appreciation over the past four quarters. The metro’s average sale price rose 1.4 12.9% -270 $25.79 8.1%
Broward/Coral Springs
percent to $219 per square foot in March, while the average cap rate dipped into the
mid-6 percent band.
City of Fort Lauderdale 13.1% 30 $25.36 7.2%
Outlook: Capital-constrained investors
Plantation 13.7% 320 $28.82 9.0%
from Miami may look toward Fort
Lauderdale due to comparatively lower
entry costs and an average 70-basis- Downtown Fort
16.5% 60 $41.58 15.1%
Lauderdale
point difference in first-year yields.
Cypress Creek 18.4% 0 $25.21 6.3%
Overall Metro 13.0% -20 $28.91 7.5%
* Trailing 12 months through 1Q19 over previous time period
** Includes submarkets with more than 100,000 square feet of inventory
Sources: CoStar Group, Inc.; Real Capital Analytics
451212 E BROWARD BLVD
MARKET OVERVIEW
461212 E BROWARD BLVD
MARKET OVERVIEW
471212 E BROWARD BLVD
MARKET OVERVIEW
SOUTH FLORIDA METROS
Capital Markets
• Monetary policy in transition. Despite the Fed raising its benchmark short-term rate three
times in seven months and signaling another rise before the end of the year, long-term rates
have remained stable. The yield on the 10-year U.S. Treasury bond remained in the low- to
mid-2 percent range throughout the second quarter of 2017. The Federal Reserve wants to
normalize monetary policy and, in addition to rate hikes, will start paring its balance sheet.
While short- and long-term rates do not always move in tandem, both actions by the Fed have
the potential to lift long-term rates.
• Sound economy a balancing act for Fed. With unemployment at the lowest level since 2007
at 4.3 percent, the Federal Reserve will remain vigilant regarding the possible rapid increase
in inflation if wage growth takes off. Additionally, business confidence sits close to its all-time
high. Businesses finally have the confidence to expand their footprint after years of tepid
growth following the Great Recession. Office properties stand to gain significantly from this
expansion with increased hiring adding to occupancy, plus expanding economic growth. The
Fed, however, must now balance economic growth and job creation against wage growth and
inflationary pressures.
• Underwriting discipline persists; ample debt capital remains. Overall, leverage on
acquisition loans has continued to reflect disciplined underwriting, with LTVs typically
ranging from 60 percent to 75 percent for most office properties. At the end of 2016, the
combination of higher rates, conservative lender underwriting and fiscal policy uncertainty
encouraged some investor caution that slowed deal flow, a trend that has extended into
2017. A potential easing of regulations on financial institutions, though, could liberate
additional lending capacity and higher interest rates may also encourage additional lenders
* Forecast
to participate.
Sources: CoStar Group, Inc.; Real Capital Analytics
48PROPERTY
1212 E BROWARD
NAME BLVD
DEMOGRAPHICS
MARKETING TEAM
Created on September 2019
POPULATION 1 Miles 3 Miles 5 Miles POPULATION PROFILE 1 Miles 3 Miles 5 Miles
▪ 2023 Projection ▪ Population By Age
Total Population 22,230 123,789 266,416 2018 Estimate Total Population 20,306 121,481 261,936
▪ 2018 Estimate Under 20 10.46% 17.37% 19.87%
Total Population 20,306 121,481 261,936 20 to 34 Years 30.64% 22.45% 21.16%
▪ 2010 Census 35 to 49 Years 23.74% 21.89% 20.81%
Total Population 18,473 110,983 240,481 50 to 59 Years 15.00% 16.65% 15.87%
▪ 2000 Census 60 to 64 Years 6.64% 6.65% 6.45%
Total Population 15,953 114,262 243,092 65 to 69 Years 5.44% 5.41% 5.39%
▪ Current Daytime Population 70 to 74 Years 3.59% 3.80% 4.06%
2018 Estimate 63,103 197,861 370,807 Age 75+ 4.48% 5.78% 6.41%
HOUSEHOLDS 1 Miles 3 Miles 5 Miles Median Age 39.83 42.16 41.60
▪ 2023 Projection ▪ Population by Gender
Total Households 12,161 59,544 118,804 2018 Estimate Total Population 20,306 121,481 261,936
▪ 2018 Estimate Male Population 58.23% 55.55% 53.21%
Total Households 10,943 57,145 114,477 Female Population 41.77% 44.45% 46.79%
Average (Mean) Household Size 1.71 2.05 2.24 AVERAGE HEALTH CARE
1 Miles 3 Miles 5 Miles
▪ 2010 Census EXPENDITURE
Total Households 9,794 51,879 104,644 ▪ 2018 Estimate Total Expenditure
▪ 2000 Census Percent of Total 6.93% 9.56% 11.45%
Total Households 7,942 50,321 102,543 Health Care Insurance $3,011 $2,803 $2,807
HOUSEHOLDS BY INCOME 1 Miles 3 Miles 5 Miles Percent of Total 70.27% 70.15% 70.36%
▪ 2018 Estimate Medical Services $708 $625 $616
$200,000 or More 13.83% 8.40% 6.19% Percent of Total 16.53% 15.65% 15.44%
$150,000 - $199,999 6.82% 5.37% 4.56% Medical Supplies $116 $114 $117
$100,000 - $149,000 13.47% 11.24% 10.91% Percent of Total 2.70% 2.85% 2.93%
$75,000 - $99,999 11.53% 10.47% 11.06% ▪ Percentage Change 2018-
$50,000 - $74,999 16.98% 16.07% 17.64% Health Care Insurance 20.81% 21.99% 22.05%
$35,000 - $49,999 11.15% 12.92% 13.64% Medical Services 19.16% 18.94% 18.40%
$25,000 - $34,999 7.71% 10.22% 10.98% Medical Supplies 20.89% 23.39% 24.39%
$15,000 - $24,999 8.16% 11.01% 11.56%
Under $15,000 10.11% 12.96% 12.55%
Average Household Income $113,030 $88,042 $79,200
Median Household Income $67,937 $52,192 $50,439
Per Capita Income $61,818 $41,799 $34,849
Source: © 2018 Experian
49PROPERTY
1212 E BROWARD
NAME BLVD
DEMOGRAPHICS
MARKETING TEAM
Population Race and Ethnicity
In 2018, the population in your selected geography is 20,306. The The current year racial makeup of your selected area is as follows:
population has changed by 27.29% since 2000. It is estimated that 79.64% White, 13.64% Black, 0.07% Native American and 1.90%
the population in your area will be 22,230.00 five years from now, Asian/Pacific Islander. Compare these to US averages which are:
which represents a change of 9.48% from the current year. The 70.20% White, 12.89% Black, 0.19% Native American and 5.59%
current population is 58.23% male and 41.77% female. The median Asian/Pacific Islander. People of Hispanic origin are counted
age of the population in your area is 39.83, compare this to the US independently of race.
average which is 37.95. The population density in your area is
6,473.13 people per square mile. People of Hispanic origin make up 15.13% of the current year
population in your selected area. Compare this to the US average of
18.01%.
Households Housing
There are currently 10,943 households in your selected geography. The median housing value in your area was $424,847 in 2018,
The number of households has changed by 37.79% since 2000. It is compare this to the US average of $201,842. In 2000, there were
estimated that the number of households in your area will be 12,161 3,478 owner occupied housing units in your area and there were
five years from now, which represents a change of 11.13% from the 4,464 renter occupied housing units in your area. The median rent at
current year. The average household size in your area is 1.71 persons. the time was $619.
Income Employment
In 2018, the median household income for your selected geography is In 2018, there are 43,085 employees in your selected area, this is also
$67,937, compare this to the US average which is currently $58,754. known as the daytime population. The 2000 Census revealed that
The median household income for your area has changed by 66.39% 71.75% of employees are employed in white-collar occupations in
since 2000. It is estimated that the median household income in your this geography, and 28.17% are employed in blue-collar occupations.
area will be $81,233 five years from now, which represents a change In 2018, unemployment in this area is 3.41%. In 2000, the average
of 19.57% from the current year. time traveled to work was 27.00 minutes.
The current year per capita income in your area is $61,818, compare
this to the US average, which is $32,356. The current year average
household income in your area is $113,030, compare this to the US
average which is $84,609.
Source: © 2018 Experian
501212 E BROWARD BLVD
8 DEMOGRAPHICS
51You can also read