18 Mackay City CATCHMENT MANAGEMENT AREA REPORT - Reef Catchments
←
→
Page content transcription
If your browser does not render page correctly, please read the page content below
WATER QUALITY IMPROVEMENT PLAN 2014 - 2021

CATCHMENT MANAGEMENT AREA REPORT

               18 Mackay City
Constant Creek
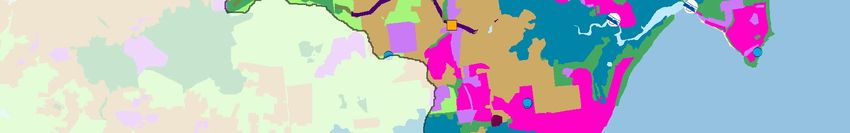
Mackay City : MAP 1
SUBCATCHMENT LANDUSE
BUCASIA
!
EIMEO
!
! DOLPHIN
HEADS
Reliance Creek
SLADE POINT
!
Mc C R E
AD
YS C R E E K
Mackay City
!
FARLEIGH
Pioneer
River GLENELLA
!
Main
G
Channel OOS K
EPO
ND C R E E
!
R I V ER MACKAY
PIO N EER
!
WALKERSTON
Key to land use
National park or reserve
Grazing or forestry
Crop land (cane and horticulture)
Intensive use (rural residential, transport corridors)
Urban
Dam or reservoir
Wetland
Town Sugar mill Bakers Creek
Highway Fish monitoring site
Catchment boundary WQ monitoring site
BAKERS CREEK
Aquaculture WQ baseline monitoring site !
Weir/dam Riparian Vegetation
Sewage treatment plant Inadequate riparian vegetation
Drinking water Riparian vegetation
Boat ramp
Data:
0 1 2 3 State of Queensland (Department of
Science, Information Technology,
Kilometres Innovation and the Arts) 2014
! MCEWENS
BEACH
WATER QUALITY IMPROVEMENT PLAN 2014 - 2021

    CATCHMENT MANAGEMENT AREA REPORT

                                          18 Mackay City

                      [ Mackay City Ecosystem Health Rating
                         Very Good        Good       Moderate     Poor       Very Poo r

                                                  VG

                                                           G                       The Mackay City freshwater
   [ FRESHWATER
   Ecosystem Health
                                                                         M
                                                                              [    ecosystem received an overall
                                                                                   score of Moderate.
                                                           M

                                                                               [
                                     VP          P                                        The Mackay City catchment area is
                                                                                          subject to pressures and demands of
                                                                                          multiple high intensity land uses that
                                                                                          include cane production, urban and
                                                                                          industrial development, and to a lesser
                                                                                          but significant level, grazing. A little under
                                                                                          15% of the catchment is National Park
                                                                                          with approximately 10% identified as
            [ Total Area by Landuse                                                       wetlands.
                        Horticulture                                                      The estuarine area of the catchment is
                        and Cropping                                                      considered amongst the lowest rated in
                         15 ha                             Sugarcane                      the region. Between 2007 and 2013, there
                                                           Production                     has been considerable effort to improve
                                                            5615 ha                       agricultural and urban water quality
Urban and
Intensive Uses                                                                            management. As a result, water quality
                                                                                          has improved, however efforts will need
 6348 ha
                                                                                          to continue to meet community values
                                                                                          for ecosystem health and water quality
                                                                                          health.
                                                                                          Grazing and cane management practices
                                                                                          that reduce nitrogen and phosphorus
                                                                                          loads are the highest priority for
                                                                                          continued water quality improvement in
                                                                                          the Mackay City catchment. As marine
                                                                Grazing and               risk exposure from pesticide and nutrient
                                                                Forestry                  loads is rated as high in the near shore
                                                                  686 ha                  environments, management practices
                                                                                          that reduce other nutrients and residual
  Wetlands and
  Waterways
                                                                                          herbicides, particularly diuron, are also a
                                             National Parks
   2503 ha
                                                                                          priority.
                                             and Reserves
                                                 1961 ha                                  All system repair actions that improve
                                                                                          fish habitat and species richness are
        Total hectares Mackay City                                                        critical to improve the poor ecological
           17128 ha                                                                       health rating for the Mackay City
                                                                                          catchment. Investment in estuary
                                                                                          and mangrove restoration to improve
                                                                                          ecological condition is also crucial to build
                                                                                          the resilience of coastal systems.
[
                   Ecosystem HEALTH

                   Table 1
                              [    Subcatchment Freshwater Ecosystem Health Indicator Score:
                                   Current Condition 2014 and Target 2021

                              Fish Community         Event Water       Ambient                                 Riparian              Barriers to
                                   Health              Quality        Water Quality         Flow              Vegetation             Migration

                                  Current Target     Current Target   Current Target     Current Target      Current Target        Current Target
                                  2014 2021           2014 2021           2014 2021      2014 2021            2014 2021             2014 2021

      [ Mackay City                M        M         VP       P          VP         P    G        G          VP      VP            VG      VG

                                                                      Very Good          Good           Moderate        Poor           Very Poo r

       Table 1: OVERVIEW

  This index presents the indicators chosen to assess the condition of freshwater ecosystem health. The index uses a
  combination of monitored data and expert opinion to provide a score for the current condition of fish community health,
  event water quality, ambient water quality, flow, riparian vegetation, and barriers to migration for each of the region’s 33
  catchment management areas. The table also presents the target for each indicator to be reached by 2021.

                   Table 2
                              [    Event Freshwater Quality: Current Condition, Targets and Objectives

              Key Pollutant                     Current Condition     Target 2021          Objective 2050             Action               Pollutant Source

                                                             MACKAY CITY SUBCATCHMENT

Dissolved Inorganic Nitrogen μg/L                     511                      420               300                    HIGH                        CIU

Particulate Nitrogen μg/L                             183                      183               183                    LOW                         CIUG

Filterable Reactive Phosphorus μg/L                   459                      377                30                    HIGH                        CIU

Particulate Phosphorus μg/L                            47                      47                 47                    LOW                         CIUG

Total Suspended Sediment mg/L                          36                      36                 36                    LOW                         CIUG

Ametryn μg/L                                          0.09                  0.08                 0.02                   HIGH                        CIU

Atrazine μg/L                                         0.84                  0.75                 0.70                   HIGH                        CIU

Diuron μg/L                                           1.96                  1.25                 0.30                   HIGH                        CIU

Hexazinone μg/L                                       0.57                  0.51                 0.20                   HIGH                        CIU

Tebuthiuron μg/L
Table 3
[ Action Targets: Ecosystem Health Management
L = Low, M = Moderate, H = High
Table 3: OVERVIEW
Planned This table presents the on-
Condition
2014
Activities to Effort $ Cost ground management actions
2021
determined to be required to
Mackay City improve ecosystem health,
including the removal of
barriers to fish migration,
Barriers 0 0 L $0 establishment of riparian
(number) vegetation, bank stabilisation,
and in-stream habitat works.
Riparian Vegetation The table displays the current
Management 280 ha 0 ha L $0 condition for each component,
(hectares)
as well as the planned activities
to be completed by 2021, the
Bank and
level of effort required and
bed stabilisation n/a 0 L $0
(kilometres) associated costs.
Tables 4 and 5: OVERVIEW
In-stream Habitat The tables below display the
n/a 0
Works L $0 current level of management
(number)
practices for Sugarcane/
Horticulture, Grazing, and Urban
Total Cost = $0 within D, C, B and A Management
Framework classifications at
2014. The table also presents the
level of voluntary adoption of
management practices required
to meet 2021 objectives and
their associated costs.
Table 4
[ Agriculture ABCD Adoption Targets
2014 Adoption % 2021 Adoption % Total Cost
Land Use
$ ‘000s
D C B A D C B A
MACKAY CITY SUBCATCHMENT
Soil 18% 27% 50% 5% 20% 25% 50% 5% 0
Cane &
Nutrient 20% 26% 46% 8% 10% 15% 65% 10% 467
Horticulture
Herbicide 20% 22% 45% 13% 10% 10% 65% 15% 475
Grazing Soil 25% 26% 44% 5% 25% 25% 45% 5% 3
D Dated practice C Common practice B Best practice A Cutting-edge practice
Table 5
[ Urban Practice ABCD Adoption Targets
2014 Adoption % 2021 Adoption % Total Cost
Land Use
$ ‘000s
D C B A D C B A
MACKAY CITY SUBCATCHMENT
Diffuse Source Water Quality
- DEVELOPMENT PLANNING
20% 75% 5% 0% 0% 50% 40% 10% 4071
AND CONSTRUCTION PHASE
Diffuse Source Water Quality
- POST-CONSTRUCTION/
10% 80% 10% 0% 0% 50% 40% 10% 3618
OPERATIONAL PHASE
D Dated practices C Conventional practices B Best practices A Aspirational


You can also read