1Q21 Earnings Presentation - May 4, 2021 - Financial Information
←
→
Page content transcription
If your browser does not render page correctly, please read the page content below

1Q21 Earnings
 Presentation

     May 4, 2021
SAFE HARBOR

This presentation contains "forward-looking" statements within the meaning of the Private Securities Litigation
Reform Act of 1995, including but not limited to statements relating to estimates and projections of future
earnings per share, cash flow and revenue growth and other financial results, developments relating to our
customers and end-markets, and plans concerning business development opportunities. Words such as
"believes," "intends," "anticipates," "plans," "expects," "projects," "forecasts," "will" and similar expressions,
and references to guidance, are intended to identify forward-looking statements. Such statements are based
on management's current assumptions and expectations and no assurances can be given that our
assumptions or expectations will prove to be correct. A number of important risk factors could cause actual
results to differ materially from the results described, implied or projected in any forward-looking statements.
These uncertainties may cause our actual future results to be materially different than those expressed in our
forward-looking statements. A detailed description of these risk factors can be found under the caption “Risk
Factors” in our most recent annual report on Form 10-K and in our other filings with the Securities and
Exchange Commission. We disclaim any intention or obligation to update any forward-looking statements as
a result of developments occurring after the date of this presentation.

In addition to financial measures prepared in accordance with generally accepted accounting principles
(GAAP), this presentation also contains non-GAAP financial measures. A reconciliation of these measures to
the most directly comparable GAAP measures is included in the embedded hyperlink and is available on the
“Financial Information” section of our website at www.perkinelmer.com.

                                                                                                                     2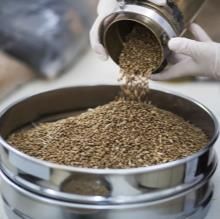
1Q ‘21 FINANCIAL RESULTS

 Org. Rev                          Adj Op                               Adj EPS                                           Revenue Mix (%) & Organic Growth Highlights
 Growth            92%             Margin          2610bps              Growth             455%

                                                                                                                                                                                       DAS
 Adjusted Revenue: $1.31 billon; +101% y/y                                                                                                                                      35%
                                                                                                                                                                                +MSD
 • Organic: +92%; M&A: +5%; FX: +3%                                                                                                      DX         65%
 •    COVID: $550 million vs. $12 million in 1Q20                                                                                                  +TD*

 •    Non-COVID: +10% organic growth

 Adj Op Margin: 41.4%; +2,610 basis points y/y
 •    +1,200 basis point adj gross margin expansion to 61.9%                                                                                                                                         Non-
                                                                                                                  APAC                                                                             Recurring
 •    Drivers: volume leverage, business mix, and productivity                                                           22%                           Americas                                 18%
      programs                                                                                                          +DD                                                                      +DD
                                                                                                                                                  44%
 Adj EPS: $3.72; +455% growth y/y                                                                                                                 +TD

 Adj Free Cash Flow: $479 million (114% non-GAAP conversion)
                                                                                                                            34%
                                                                                                                            +TD                                                           82%
                                                                                                                                                                                         +TD
                                                                                                                       EMEA
                                                                                                                                                                                       Recurring

*+TD = triple-digit growth; Reconciliations to the most directly comparable GAAP measure for the non-GAAP terms presented above are provided on our website and in this hyperlink
                                                                                                                                                                                                               3
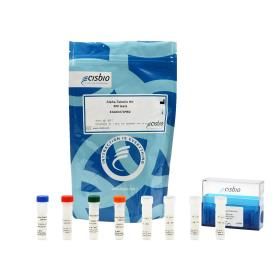
DISCOVERY & ANALYTICAL SOLUTIONS
                                                                1Q21 Performance                                                             ✓ LSD organic growth with Pharma/Biotech
                                   Food*                                                                                       Life            up LSD and Acad/Gov’t down LSD
                                                                                                                             Sciences        ✓ Discovery (+DD) and Informatics (+HSD)
                                                                •       +14% reported growth
                                                                                                                                               drove Pharma/Biotech performance
                                                                    •   Organic: +6%; M&A: +5%; FX: +3%
                                                                    •   Higher backlog in all three end-                                     ✓ HSD organic growth
                                                                        markets exiting 1Q21
                       $0.5B                                                                                                   Food
                                                                                                                                             ✓ Food Safety demand increased DD
                       1Q21 revenue                                                                                                            despite tough y/y comparison
                                                                •     Adj Op margins of 16.6% increased
                                                   Ind/Env            approximately 300 basis points y/y
                                                                    • Higher volume and mix offset                                           ✓ DD Industrial & Env. organic growth
 Life Science                                                          additional investments
                                                                                                                              Ind/Env
                                                                                                                                             ✓ Env. & Safety led the way up strong DD
                                                                                                                                               driven by European and APAC demand

                   NexION ICP-MS               Cisbio Alpha Kit             QSight Triple Quad          ELN & Signals Notebook             Opera Phenix HCS        OneSource

*Food is split from Applied to illuminate the business segment. Applied in the chart above is comprised of Industrial & Environmental end-markets
Reconciliations to the most directly comparable GAAP measure for the non-GAAP terms presented above are provided on our website and in this hyperlink                                   4
DIAGNOSTICS
                                                                 1Q21 Performance                                                             ✓ HSD organic growth driven by clinical
                                              Applied                                                                       Reproductive        diagnostics franchise
                                             Genomics                                                                          Health
                                                                • +236% reported growth                                                       ✓ Ongoing birth rate pressures offset by
 ImmunoDx
                                                                                                                                                improved utilization & menu expansion
                                                                 • Organic: +227%; M&A: +5%; FX:
                                                                   +4%
                                                                 • All three regions more than doubled                                        ✓ TD organic growth
                        $0.9B
                        1Q21 revenue
                                                                   y/y                                                       ImmunoDx
                                                                                                                                              ✓ Non-COVID portfolio grew DD led by
                                                                                                                                                EuroImmun and Tulip
                                                                • Adj Op margins of 56.6% expanded
                                                                  3,350 basis points y/y
                                                                                                                                              ✓ TD growth y/y
                                                                 • Favorable business mix and volume                          Applied
                                             Reproductive
                                                Health                                                                       Genomics         ✓ Automated liquid handling & NA
                                                                                                                                                Extraction grew 10x and 9x, respectively,
                                                                                                                                                y/y

                    GSP                     GSP MM Kit                   Vanadis View®*                  chemagic 360             EUROIMMUN ELISA Kit         EUROLabWorkstation

*Vanadis View® is one of three systems in the Vanadis NIPT workflow: Vanadis Extract®, Vanadis Core®, and Vanadis View®
 Reconciliations to the most directly comparable GAAP measure for the non-GAAP terms presented above are provided on our website and in this hyperlink                                      5
UPDATED FINANCIAL GUIDANCE

                               2Q21 Guidance                                                                                        2021 UPDATE

 • Reported Revenue: $1.11 billion; 37% reported growth                                              • Revenue: $4.37 billion; 15% reported growth
      • Organic: +29%; M&A +5%; FX +4%                                                                    • Organic: +9%; M&A +4%; FX +2%

         Assumptions COVID vs. Non-COVID Outlook                                                             Assumptions COVID vs. Non-COVID Outlook
         • Non-COVID products: High-teens organic growth                                                     • Non-COVID products: +11% organic growth
         • COVID products: $325 million (vs. $196 million in 2Q20)                                           • COVID products: +5% growth (vs. $1.05B in 2020)

 • $16 million of Interest Expense & Other                                                           • $60 million of Interest Expense & Other
 • 21% adjusted tax rate                                                                             • 20% adjusted tax rate

 • Adjusted EPS: $2.35                                                                               • Adjusted EPS: $9.40
      • Average diluted share count of 112-113 million shares                                             • Average diluted share count of 112-113 million shares

Reconciliations to the most directly comparable GAAP measure for the non-GAAP terms presented above are provided on our website and in this hyperlink
                                                                                                                                                                    6
INNOVATING
                                                                       for a healthier world
Bryan Kipp | Vice President, Investor Relations | 781.663.5583 | bryan.kipp@perkinelmer.com
                                                                                               7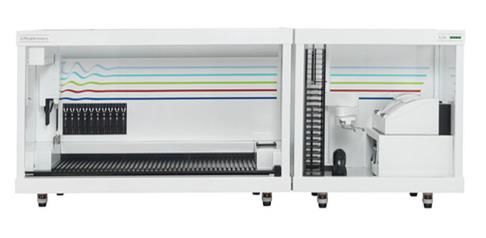

You can also read