Amanda Owen
Area Manager, South Africa
←
→
Page content transcription
If your browser does not render page correctly, please read the page content below
Amanda Owen Area Manager, South Africa

Agenda               2

Corporate Overview
Booking Trends
New Tools

3

      1996 – 2016
20 YEARS OF EXPEDIA
Back in 1996…                 4

                R1.88 per Litre
5

Then and Now                       6

      20
     Years ago
                   10
                 Years ago
                             Now
7

    2016
TRAVEL REVIEW
8

Welcome to the family

9
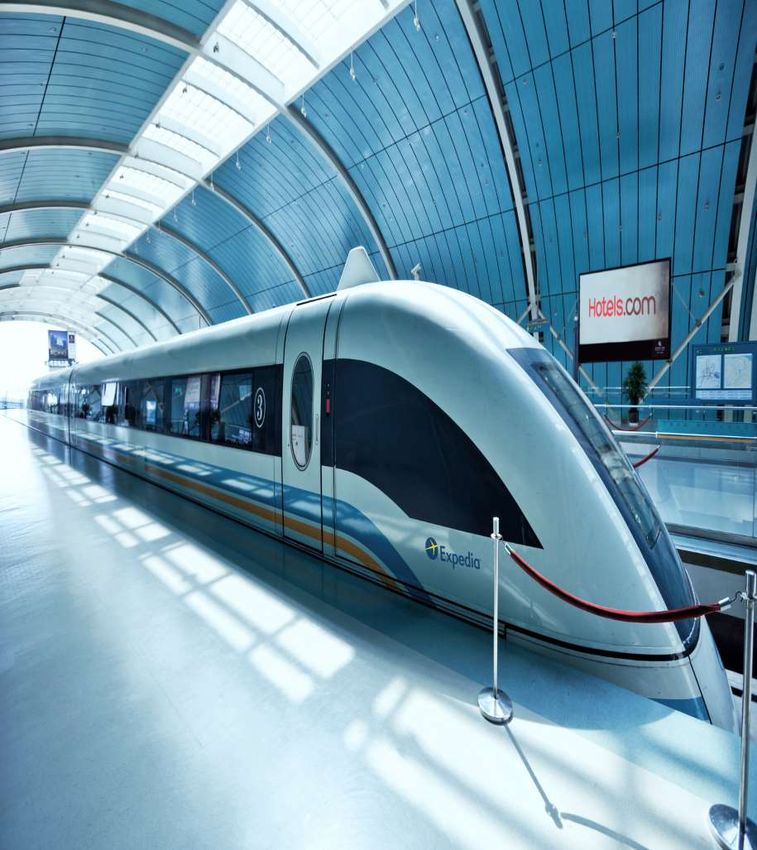
Rail
$130
Business opportunity
BILLION
Based on Phocuswright 2016 data
10

                 MOBILE

>50% >40%
      of transactions
     of traffic
                                                    AND
                                                           >40%
                                                  GROWING!
   Hotels.com and Wotif traffic, Q3 2016

                                           2012    Hotels.com, Q3 2016   2016
11
TREND
EXPECTED 79%
to continue 75%
68%
Mobile
share of
global
Internet
usage: 40%
2012 2016 2017 2018
Source: Zenith Media, Mobile Advertising Forecasts, October 201612 SEAMLESS EXPERIENCE ACROSS DEVICES
13
14

         COMPLEXITY

OF NEW CUSTOMER AQUISITION
       HAS ALSO CHANGED
15
All these complexities Social
Meta
when someone is booking a trip Email
App
Online
Offline
CHANNELS SEO/SEM Korea
10
English UK
French Japan
Korean Mexico
Spanish Canada
Chinese Singapore
Arabic Germany
LANGUAGES COUNTRIES
35 240
DEVICES
6 5 9
Expedia
PRODUCTS Hotels.com PAYMENT Credit
TYPES Debit
400
Lodging Orbitz
Wotif Installments
Air
Cruise Travelocity PayPal
BRANDS EAN IBP
Million
Car
17
Package Bitcoin
Activities
combinations!16
WITH ALL OF THE COMPLEXITY
THE INDUSTRY SPENDS
+$10 Billion
1
1 Assumes global hotel chain revenue is $200B ($181 from composite of top 115 Global & Key accounts), 5% of chain revenue assumed to be technology
segment (per 5% transaction fee within franchise fees). Of 5%: we assume 2% is online distribution, 1.5% is loyalty, and 1.5% is CRS funded by chains with
up to an additional 1% PMS / Hotel operations (outside the franchise fee) funded by owners. Franchise fees are from Franchisedirect.com17
EXPEDIA INVESTS
+$1 Billion
1
ON DATA & TECHNOLOGY
1 Spent over LTM through Sep 30th 201618
PMS Revenue Digital Website CRM &
& CRS management marketing & Guest
Mobile ExperienceBooking Trends
Country of Origin into South Africa   GERMANY               20
                                      R1912
                         UK           78 Days
     USA                              2.4 Nights
                    R2180
R2037               64 Days
37 Days             2.7 Nights
2.3 Nights

                                                    AUSTRALIA
                                                    R2088
                                                    69 Days
                                                    2.5 Nights

      BRAZIL
 R2422                                  S. AFRICA
 50 Days                              R1281
 2.4 Nights                           16 Days
                                      1.8 Nights
Mobile – South Africa 21
Mobile
Mobile
26% 28 Day Booking Window
South 2 Night Avg. Length of Stay
Africa
Mobile Non Mobile
Share 39 Day Booking Window
2.3 Night Avg. Length of Stay
Non Mobile
74%Package 22
+ +
Package Bookings Accommodation Only Bookings
47 Day Booking Window VS. 41 Day Booking Window
3.2 Night Avg Length of Stay 2.2 Night Avg Length of StayFX Rate 23
Jan 2016 R15.50 – R16.80
Jan 2017 R13.22 – R13.78
Feb 2016 R15.59 – R16.20
Feb 2017 R12.91 – R13.48
Mar 2016 R14.90 – R15.90
Mar 2017 R12.40 – R13.32
Apr 2016 R14.29 – R14.90
Apr 2017 R12.40 – R13.32
South Africa Australia Brazil Thailand
2016 $124 2016 $136 2016 $91 2016 $87
2017 $147 2017 $143 2017 $100 2017 $88
18% Growth 5% Growth 10% Growth 0.5% GrowthNew Tools
WE ALSO
                                           27

              BUILD FOR YOU
                                 EPC
   VALUE                    CONVERSATIONS
  ADDED
PROMOTIONS                    REV+
UPGRADES                     PROMOTIONS

  REAL TIME                  ACCELERATOR
  FEEDBACK
                               POINTS OF
                               INTEREST
GUEST SENTIMENT
   ANALYSIS
                              EPC MOBILE
  TRAVELADS

CONNECTIVITY
 SOLUTIONS
28
Guest Review Insights 29
30

                48% of travel
       shoppers will
     look for another
     hotel if it doesn’t
            offer
                 free parking

Source: Expedia Inc May 2016. Based on a survey sampled of 400 online hotel shoppers, half were explicitly Expedia
                            account holders and half were general travel shoppers
31
What if there was a promotional tool to
help you…?
Draw attention to your hotel listing
Keep your Average Daily Rates stable
Help drive revenue to onsite amenitiesValue Add Promotions 32
FREE FOOD
44%
FREE PARKING
12%
FREE LATE
CHECKOUT 5%Upgrade Promotions 33
Leisure travelers upgrade
15-20%
Of guests pay for
50%
more often than
upgrade when offered business travelers
Customers who had the Customers with enhanced
“Best Experience” spend up to experiences have up to
140% more 25% higher
satisfaction34 Upgrades
Rev+                   35

1 to 3
  hours researching
  competitor pricing

 41%
can’t afford revenue
management systems
36

                                    Partners like you told us:
                                    • their daily or weekly performance
                                      review and price setting process
                                      involves up to 45-steps

                                    • they spend between 1-3 hours on
                                      price setting activities; such as
                                      review multiple reports and
                                      competitor pricing

                                    • they check competitor pricing 3 or
Less than 15% of the global hotel     more times per day in urban markets
market uses revenue management
           technology.              • some even spend between $1,000 to
                                      $3,000+ per year on Rate Shopping
                                      tools alone
What if there was a FREE revenue 37
management tool to help you…?
make smarter pricing decisions
optimize your revenue
save time38
Meet Rev+
A new, free tool in Expedia
PartnerCentral (EPC) that
provides competitive pricing data
and market demand intelligence
to help you make smarter pricing
decisions and optimize revenue,
in less time.You can also read