2015 "Fixing America's Surface Transportation Act" - A Comprehensive Analysis
←
→
Page content transcription
If your browser does not render page correctly, please read the page content below

2015 "Fixing America's
Surface Transportation Act"

     A Comprehensive Analysis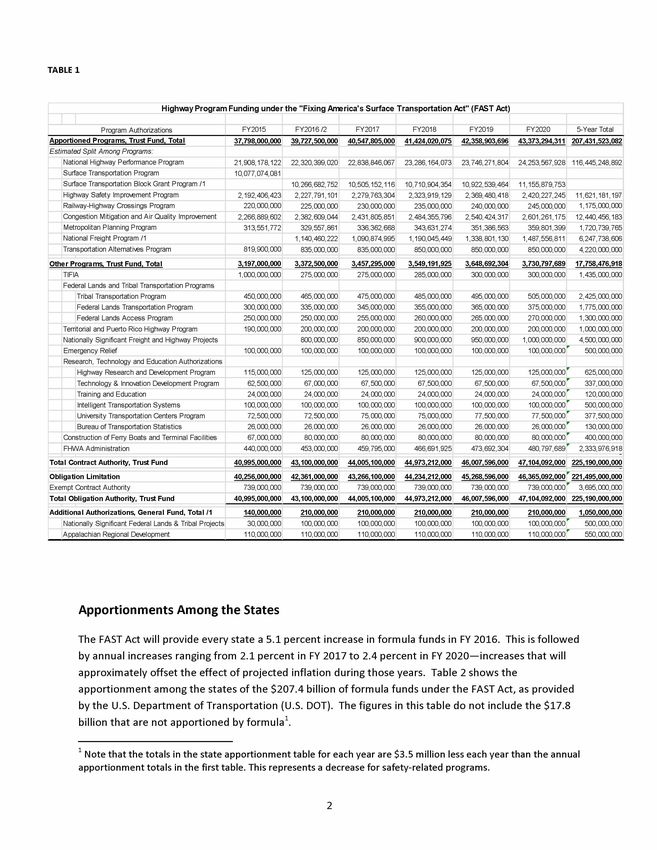
ANALYSIS:

   2015 "Fixing America's Surface Transportation (FAST) Act:"

        The "Fixing America's Surface Transportation Act," or FAST Act, released Dec. 1 by the
conference committee appointed to reconcile the different surface transportation reauthorization bills
passed by the House and Senate, will reauthorize the federal highway and public transportation
programs for fiscal years (FY) 2016-2020 and stabilize the Highway Trust Fund (HTF) during that five-year
period.

Highway Program Funding

         The bill includes $225.2 billion from the HTF for highway investment, a $20.2 billion increase
over five years compared to maintaining FY 2015 funding. About half of the increase, or $10.7 billion,
will support two new proposed initiatives—a National Freight Program and a program of Nationally
Significant Freight and Highway Projects. The remainder will provide small annual increases in core
highway program funding.

        Of the $225.2 billion total, $207.4 billion will be apportioned among the states by formula.
States use these funds for highway and bridge improvements authorized by the main highway programs
such as the National Highway Performance Program, the new Surface Transportation Block Grant
Program, and a few others. The apportionment formulas are set by Congress.

         The remaining $17.8 billion will fund a handful of additional programs that are either run
directly by the federal government, are for research and development programs, fund Federal Highway
Administration (FHWA) administrative expenses, or finance competitive grants to state and local
governments under programs administered by the Secretary of Transportation.

         An
   additional $1.05 billion is authorized from the general fund for significant projects on federal
or tribal lands and for the Appalachian Regional Highway Development program.

        Funding details by program and year are shown in Table 1: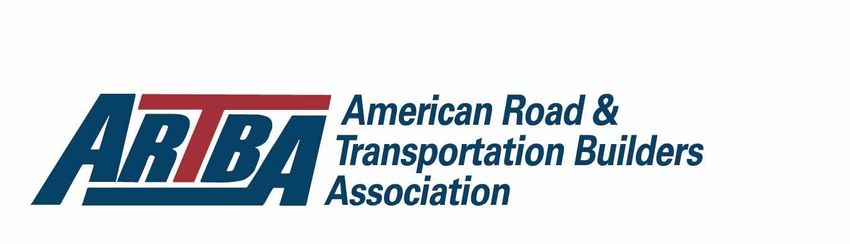
1
TABLE 1
Highway
H ig h w a y Program
P r o g r a m Funding
F u n d in g under
u n d e r the
t h e "Fixing
" F ix in g America's
Ame r i c a 's Surface
S u r f a c e Transportation Act"
T r a n s p o r t a t io n A c t" (FAST Act)
(F A S T A c t)
Program A
Authorizations
uthorizations FY2015 FY2016 /2 FY2017 FY2018 FY2019 FY2020 5-Year Total
Aeeortioned Programs, Trust Fund, Total 37,798,000,000
3 7 ,7 9 8 ,0 0 0 ,0 0 0 39,727,500,000
3 9 ,7 2 7 ,5 0 0 ,0 0 0 40,547,805,000
4 0 ,5 4 7 ,8 0 5 ,0 0 0 41,424,020,075
4 1 ,4 2 4 ,0 2 0 ,0 7 5 42,358,903,696
4 2 ,3 5 8 ,9 0 3 ,6 9 6 43,373,294,311
4 3 ,3 7 3 ,2 9 4 ,3 1 1 207,431,523,082
2 0 7 ,4 3 1 ,5 2 3 ,0 8 2
Estimated
E stim a te d Split Among
S plit A m ong Programs:
Program s:
National Highway Performance
Perform ance Program 21,908,178,122 22,320,399,020 22,838,846,067 23,286,164,073 23,746,271,804 24,253,567,928 116,445,248,892
116,445,248,892
Surface
S urface Transportation Program 10,077,074,081
10,077,074,081
Surface Transportation Block
B lock Grant Program /1 10,266,682,752 10,505,152,116
10,505,152,116 10,710,904,354 10,922,539,464
10,922,539,464 11,155,879,753
11,155,879,753
Highway Safety Improvement
lmprrn,ement Program 2,192,406,423 2,227,791,101 2,279,763,304 2,323,919,129 2,369,480,418 2,420,227,245 11,621,181,197
11,621,181,197
Railway-Highway Crossings
C rossings Program 220,000,000 225,000,000 230,000,000 235,000,000 240,000,000 245,000,000 1,175,000,000
1,175,000,000
Congestion Mitigation
C ongestion M Air
itigation and A Quality
ir Q lmprrn,ement
uality Improvement 2,266,889,602 2,382,609,044 2,431,805,851 2,484,355,796 2,540,424,317 2,601,261,175 12,440,456,183
12,440,456,183
Metropolitan
M etropolitan Planning Program 313,551 ,772
313,551,772 329,557,861 336,362,668 343,631 ,274
343,631,274 351 ,386,563
351,386,563 359,801,399 1,720,739,765
National Freight Program /1 1,140,460,222
1,140,460,222 1,090,874,995
1,090,874,995 1,190,045,449
1,190,045,449 1,338,801,130
1,338,801,130 1,487,556,811
1,487,556,811 6,247,738,606
Alternati1.es Program
Transportation Alternatives 819,900,000 835,000, 000
835,000,000 835,000,000 850,000,000 850,000, 000
850,000,000 850,000,000 4,220,000,000
Other
O th e r Program~
P r o g ra m s , Trust
T ru s t Fund,
F u n d , Total
T o ta l 3,197,000,000
3 ,1 9 7 ,0 0 0 ,0 0 0 3,372,500,000
3 ,3 7 2 ,5 0 0 ,0 0 0 3,457,295,000
3 ,4 5 7 ,2 9 5 ,0 0 0 3,549,191,925
3 ,5 4 9 ,1 9 1 ,9 2 5 3,648,692,304
3 ,6 4 8 ,6 9 2 ,3 0 4 3,730,797,689
3 ,7 3 0 ,7 9 7 ,6 8 9 17,758,476,918
1 7 ,7 5 8 ,4 7 6 ,9 1 8
TIFIA 1,000,000,000
1,000,000,000 275,000,000 275,000,000 285,000,000 300, 000, 000
300,000,000 300,000,000 1,435,000,000
1,435,000,000
Federal Lands and Tribal Transportation Programs
Program s
Tribal Transportation Program 450,000,000 465,000,000 475,000,000 485,000,000 495,000,000 505,000,000 2,425,000,000
Federal Lands Transportation Program 300,000,000 335,000, 000
335,000,000 345,000,000 355,000,000 365,000,000 375,000,000 1,775,000,000
1,775,000,000
Federal Lands A
Access
cce s s Program 250,000,000 250,000,000 255,000,000 260,000,000 265,000,000 270,000,000 1,300,000,000
1,300,000,000
Territorial and Puerto Rico Highway Program 190,000,000
190,000,000 200,000,000 200,000,000 200,000,000 200,000,000 200,000,000 1,000,000,000
1,000,000,000
Nationally Significant Freight and Highway Projects 800,000, 000
800,000,000 850,000,000 900,000,000 950,000, 000
950,000,000 1,000,000,000
1,000,000,000 4,500,000,000
Emergency
Em ergency Relief 100,000,000
100,000,000 100,000,000
100,000,000 100,000,000
100,000,000 100,000,000
100,000,000 100,000,000
100,000,000 100,000,000
100,000,000 • 500,000,000
Research, Technology and Education Authorizations
Highway Research and Development
De1.elopment Program 115,000,000
115,000,000 125,000,000
125,000,000 125,000,000
125,000,000 125,000,000
125,000,000 125,000,000
125,000,000 125,000,000
125,000,000 • 625,000,000
& Innovation Development
Technology & De1.elopment Program 62,500,000 67,000,000 67,500,000 67,500,000 67,500,000 67,500,000 • 337,000,000
Training and Education 24,000,000 24,000,000 24,000,000 24,000,000 24,000,000 24,000,000 • 120,000,000
120,000,000
Intelligent Transportation Systems
S ystem s 100,000,000
100,000,000 100,000,000
100,000,000 100,000,000 100,000,000 100,000,000 100,000,000
100,000,000 • 500,000,000
Uni1.ersity Transportation Centers Program
University 72,500,000 72,500,000 75,000,000 75,000,000 77,500,000 77,500,000 · 377,500,000
Bureau of
o f Transportation Statistics
S ta tis tic s 26,000,000 26,000,000 26,000,000 26,000,000 26,000,000 26,000,000 • 130,000,000
130,000,000
Construction of Ferry Boats and Terminal Facilities 67,000,000 80,000,000 80,000,000 80,000,000 80,000,000 80,000,000 • 400,000,000
FHWA Administration
FH W A Adm inistration 440,000,000 453,000, 000
453,000,000 459,795,000 466,691,925 473,692,304 480,797,689 • 2,333,976,918
Total
T o ta l Contract
C o n tr a c t Authority,
A u th o rity , Trust
T ru s t Fund
Fund 40,995,000,000
4 0 ,9 9 5 ,0 0 0 ,0 0 0 43,100,000,000
4 3 ,1 0 0 ,0 0 0 ,0 0 0 44,005,100,000
4 4 ,0 0 5 ,1 0 0 ,0 0 0 44,973,212,000
4 4 ,9 7 3 ,2 1 2 ,0 0 0 46,007,596,000
4 6 ,0 0 7 ,5 9 6 ,0 0 0 47,104,092,000
4 7 ,1 0 4 ,0 9 2 ,0 0 0 225,190,000,000
2 2 5 ,1 9 0 ,0 0 0 ,0 0 0
Obligation
O b lig a tio n Limitation
L im ita tio n 40,256,000,000
4 0 ,2 5 6 ,0 0 0 ,0 0 0 42,361,000,000
4 2 ,3 6 1 ,0 0 0 ,0 0 0 43,266,100,000
4 3 ,2 6 6 ,1 0 0 ,0 0 0 44,234,212,000
4 4 ,2 3 4 ,2 1 2 ,0 0 0 45,268,596,000
4 5 ,2 6 8 ,5 9 6 ,0 0 0 46,365,092,000
4 6 ,3 6 5 ,0 9 2 ,0 0 0 • 221,495,000,000
2 2 1 ,4 9 5 ,0 0 0 ,0 0 0
Exempt
Exem pt Contract
C ontract Authority 739,000,000 739,000,000 739,000,000 739,000,000 739,000,000 739,000,000 • 3,695,000,000
Total
T o ta l Obligation Authority,
O b lig a tio n A u th o rity , Trust
T ru s t Fund
Fund 40,995,000,000
4 0 ,9 9 5 ,0 0 0 ,0 0 0 43,100,000,000
4 3 ,1 0 0 ,0 0 0 ,0 0 0 44,005,100,000
4 4 ,0 0 5 ,1 0 0 ,0 0 0 44,973,212,000
4 4 ,9 7 3 ,2 1 2 ,0 0 0 46,007,596,000
4 6 ,0 0 7 ,5 9 6 ,0 0 0 47,104,092,000
4 7 ,1 0 4 ,0 9 2 ,0 0 0 225,190,000,000
2 2 5 ,1 9 0 ,0 0 0 ,0 0 0
Additional Authorizations,
A d d it io n a l A u th o riz a tio n s , General
G e n e r a l Fund,
F u n d , Total
T o ta l /1 140,000,000
1 4 0 ,0 0 0 ,0 0 0 2 1 o,
21 000,
0 ,0 0 0 ,0000
00 210,000,000
2 1 0 ,0 0 0 ,0 0 0 210,000,000
2 1 0 ,0 0 0 ,0 0 0 2 1 o,
21 000,
0 ,0 0 0 ,0000
00 210,000,000
2 1 0 ,0 0 0 ,0 0 0 1,050,000,000
1 ,0 5 0 ,0 0 0 ,0 0 0
& Tribal Projects
Nationally Significant Federal Lands & P rojects 30,000,000 100,000,000
100,000,000 100,000,000
100,000,000 100,000,000
100,000,000 100,000,000
100,000,000 100,000,000 •
100,000,000 500,000, 000
500,000,000
Appalachian
A De1.elopment
ppalachian Regional Development 110,000,000
110,000,000 110,000,000
110,000,000 110,000,000
110,000,000 110,000,000
110,000,000 110,000,000
110,000,000 110,000,000
110,000,000 • 550,000, 000
550,000,000
Apportionments Among the States
The FAST Act will provide every state a 5.1 percent increase in formula funds in FY 2016. This is followed
by annual increases ranging from 2.1 percent in FY 2017 to 2.4 percent in FY 2020-increases that will
approximately offset the effect of projected inflation during those years. Table 2 shows the
apportionment among the states of the $207.4 billion of formula funds under the FAST Act, as provided
by the U.S. Department of Transportation (U.S. DOT). The figures in this table do not include the $17.8
billion that are not apportioned by formula 1.
1
Note that the totals in the state apportionment table for each year are $3.5 million less each year than the annual
apportionment totals in the first table. This represents a decrease for safety-related programs.
2
TABLE 2

    C O M P A R IS O N O F AAC T U A L F Y 2 0 1 5 A P P O R T IO N M E N T S U N D E R T H E H IG H W A Y A N D T R A N S P OO R T A T IO N F U N D I NG A C T O F 2 0 1 4 A S A M E N D E D , A N D E S T IM A T E D
                                             F Y 201 6 - F Y 2 0 2 0 A P P O R T IO N M E N T S U N D E R T H E C O N F E R E N C E R E P O R T F O R H .R . 2 2 ( F A S T A C T )
                                                          ( b e f o r e p o s t-a p p o r t io n m e n t setasi
Market Impact
While the FAST Act's total core highway investment increase during the life of the bill will be just
over 15 percent, yearly assessments are a better gauge of the measure's market impact. As noted
earlier, highway investment will jump 5.1 percent in FY 2016 and then slow to rates of growth between
2.1 percent and 2.4 percent for the remainder of the bill. The chart below shows the investment levels
will exceed projected inflation by a total of $1.7 billion over five years and beat projected construction
material cost increases by $1 billion over the same period. As a result, federal highway investment will
see narrow increases in purchasing power through FY 2020, but the FAST Act's biggest impact on the
highway construction market will be the stability it provides states and the private sector.
FAST Act Proposed Obligations for
Federal Aid Highway Program
$47
$46.4
$46
$45
$44
Billions
of
$
$43
$42
$42.0
$41.3
$41
$40.3
$40
$39
2015
2016
2017
2018
2019
2020
Nominal
Obligations
Adjusted
for
Project
Costs
Adjusted
for
Inflation
Source: ARTBA analysis of FAST Act. Inflation forecast from CBO’s August 2015 report "An Update to the Budget and
Economic Outlook: 2015 to 2025." Project costs expected to grow at historical average of 3 percent a year.
Highway Trust Fund (HTF)
The FAST Act provides five years of highway program authorizations, one less than bills passed
by both the House and Senate. But it transfers enough resources into the HTF —$51.9 billion into the
Highway Account and $18.1 billion into the Mass Transit Account— to fund the full five years of program
authorizations. This is a significant improvement compared to the House and Senate bills, whichgenerated only enough revenues to guarantee funding for the first three years. The FAST Act also is the
longest duration reauthorization of the programs in a decade.
It also includes a provision that will automatically increase authorized highway and public
transportation investment if Congress were to pass a subsequent law adding additional revenues to the
HTF. It is worth noting that virtually all HTF revenue enhancements in the last 30 years have been part
of budget and tax legislation enacted outside of the surface transportation reauthorization process. This
provision assures that if such action were to happen again there would be no delay in passing these
resources through to needed surface transportation improvements.
Nonetheless, the transfer of money from the general fund into the HTF is only a temporary fix.
Without a permanent increase in current trust fund excise taxes or enactment of a new revenue source,
the HTF will exhaust the funds provided under the FAST Act by the end of FY 2020. Furthermore,
because the underlying HTF revenue deficit has not been addressed, the current $14 billion annual
shortfall between incoming trust fund revenues and the amount needed to support authorized surface
transportation investment levels will grow over the next five years without remedial action by Congress.
The Congressional Budget Office official budget score of the FAST Act, released Dec. 2, predicts Congress
will need to find over $100 billion in additional HTF revenues to fund the next five year authorization bill
from FY 2021 through FY 2025 - an average of at least $20 billion per year. In addition, if the past
several years of trust fund revenue shortfalls are any guide, we could see states beginning to scale back
planned projects well before the FAST Act expires.
Highway Program Structure
The FAST Act retains the highway program structure enacted in the 2012 Moving Ahead for
Progress in the 21st Century (MAP-21) surface transportation law with only a few major additions or
changes.
National Highway Performance Program (NHPP). The NHPP is the most significant highway
program, focusing on maintaining and improving the Interstate Highway System and other major
highways designated as part of the National Highway System. The program receives 63.7 percent of
formula funds remaining after funding is provided for the Congestion Mitigation & Air Quality (CMAQ)
Program, metropolitan planning and national freight programs. The bill will add two permissible uses
for NHPP funds: to pay subsidy and administrative costs for TIFIA projects and for improvements to
bridges that are not on the National Highway System.
Surface Transportation. The bill expands the existing Surface Transportation Program (STP) into
a "Surface Transportation Block Grant Program (STBGP)" based on the thought that most of the benefits
of STP funds accrue locally and that decisions about how such funds are obligated should be determined
by state and local governments, which can best respond to unique local circumstances and implement
the most efficient solutions. The bill rewrites and simplifies the list of uses eligible for program funds
and increases the ways that STP funds can be used for local roads and rural minor collectors. The new
program still requires that a fraction of program funds be distributed within each state on the basis ofpopulation, and the fraction subject to this requirement grows from 50 percent in 2015 under the
existing STP program to 55 percent in FY 2020 and FY 2021.
Furthermore, $835 million to $850 million of the annual funding for this program is set aside for
the transportation alternatives program, which supports a variety of pedestrian, bicycling, and
environmental activities. This maintains the same funding for enhancements as in MAP-21. The bill also
requires states to invest the same amount each year in recreational trails as in 2009, although states are
able to opt out of the Recreational Trails Program. The STBGP block grant program receives the same
29.3 percent of formula funds as did the STP
program under MAP-21.
Congestion Mitigation & Air Quality (CMAQ) Program. This long-standing program focuses on
reducing highway traffic congestion and improving air quality with a particular focus on states and areas
that do not meet current air quality standards. The FAST Act makes only a few changes to the CMAQ
program: CMAQ funds can be used not only for attainment of ambient air quality standards, but also to
maintain standards in an attainment area; the diesel retrofit program is expanded to include port-
related off-road equipment and vehicles; and low-population-density states are exempt from PM 2.5
attainment requirements if the non-attainment area has no projects that are part of a transportation
plan and vehicles are an insignificant contributor to PM 2.5 non-attainment. The CMAQ program
receives the same share of formula funds as applied under MAP-21.
Highway Safety Improvement Program (HSIP). The legislation ends the ability of states to shift
funds designated for infrastructure safety projects to behavioral or educational activities, ensuring
resources remain in construction-related programs. It also designates several new safety improvements
eligible for funding including vehicle-to-infrastructure communication and roadway improvements that
provide separation between pedestrians and motor vehicles.
With regards to unpaved roads, the FAST Act allows states to "opt out" of collecting safety
inventory data for unpaved/gravel roads if certain conditions are met, as long as the states continue to
collect data related to serious crashes and fatalities. It also requires the U.S. DOT to review data and
report to Congress on best practices for roadway infrastructure improvements that enhance commercial
motor vehicle safety. This is in line with an ARTBA project to develop guidance related to the
disproportionate number of large truck crashes in work zones.
Transportation Alternatives. MAP-21 combined the Transportation Enhancement Program, Safe
Routes to School and the Recreational Trails Program into a comprehensive Transportation Alternatives
Program. The most significant FAST Act modification to this program changes its funding from percent
of annual apportionments (about $820 million per year) to a flat $835 million in FY 2016 and FY 2017
and then to $850 million per year thereafter. The FAST Act also expands eligible recipients for funds to
include nonprofits responsible for administration of local transportation safety programs and requires
annual reports from state and local planning organizations on the number of project applications and
awards.
The FAST Act's two new initiatives are:National Freight Program. The FAST Act transforms the National Freight Policy provisions of
MAP-21 into a new program that funds freight-related highway improvements. It authorizes a five-year
total of $6.2 billion for the program. Funds are apportioned among the states by formula, but states
must establish a freight advisory committee and develop a state freight investment plan before
obligating any funds. Under the proposal, the Secretary of Transportation and the states will designate a
national freight network comprised of the Interstate highways and other roads, both urban and rural,
that are critical to the safe and efficient shipment of freight. The national and state networks will be
updated every five years. Program funds will be directed under national and state strategic plans to
projects that improve highway freight transportation.
States will be able to obligate up to 10 percent of their freight program funds for improvements
to freight rail or ports, statutorily breaking a long-standing practice against opening up HTF resources to
modes of transportation other than highways and public transportation. It should also be noted that
freight rail companies and users do not contribute to the HTF and the port community has its own
separate federal trust fund.
Nationally Significant Freight and Highway Projects Program. This program will provide an
average of $900 million per year in grants of at least $25 million for highway, bridge, rail-grade crossing,
intermodal and freight rail projects costing more than $100 million that improve movement of both
freight and people, increase competitiveness, reduce bottlenecks, and improve intermodal connectivity.
Projects will be awarded competitively by the Secretary of Transportation based on criteria listed in the
bill. At least 25 percent of the funds must be spent in rural areas, and the federal share of project costs
will be 60 percent. While the program allows HTF resources to be diverted to freight rail projects, it will
impose a $500 million limitation on the total amount that can be awarded over the next five years to
freight and intermodal projects. It also reserves 10 percent of the annual grant awards for projects that
do
not meet the program's cost threshold. The Secretary of Transportation must report all grant awards
to Congress, which will have 60 days to reject a project by joint resolution.
Accelerated Project Delivery
The FAST Act builds upon MAP-21's improvements to the project delivery process by expanding
opportunities for their use in addition to creating additional reforms aimed at reducing delay.
Reduction of Duplication. The FAST Act focuses on reducing duplicative efforts throughout the
environmental review process in multiple ways. First, the legislation requires "to the maximum extent
practicable" the combination of a final environmental impact statement (EIS) and record of decision into
a
single document. As both types of documents can often be quite voluminous, eliminating one is a
significant reduction in paperwork. The measure also allows, and encourages, the use of a single
environmental review document throughout the entire process and among multiple agencies, as
opposed to the current practice of having each agency conduct separate reviews.
Further, the FAST Act expands on combining the transportation planning and National
Environmental Policy Act (NEPA) environmental review processes "to the maximum extent practicable
and appropriate." For transportation projects, an extensive amount of information is gathered duringthe planning process, which often occurs prior to the actual triggering of NEPA review requirements.
This allows information gathered during the planning process, to the extent it is still current and
relevant, to satisfy NEPA requirements, limiting duplicative reviews and reducing the amount of delay in
the NEPA process. Additionally, alternatives to proposed transportation projects analyzed and rejected
during the planning process do not need to be re-analyzed during NEPA review.
The FAST Act also prevents regulatory issues that have been resolved early in the process to be
raised again later. The bill says that any such issue that has been resolved by the lead agency with the
concurrence of the participating agencies cannot be re-examined unless "significant new information or
circumstances arise." Unfortunately, what exactly constitutes "significant new information or
circumstances" is not addressed in the statute, but could be addressed later via guidance or regulation.
If the phrase is not clarified, there could be an opportunity for litigation.
Deadlines. The FAST Act adds to MAP-21's efforts to use deadlines to reduce delay in the
transportation project review and approval process. Specifically, the legislation creates the following:
• A
45-day deadline from the beginning of the environmental review process to identify all
participating agencies;
• A
45-day deadline for the receipt of a project application for U.S. DOT to decide whether or not
the environmental review process may be initiated;
• A
45-day deadline for U.S. DOT to respond to a request to designate a specific modal
administration as lead agency (this deadline may be extended up to an additional 45 days if new
information is received); and
• A 90-day deadline from the beginning of the environmental review process to develop a
coordination plan to obtain comments from participating agencies.
Categorical Exclusions. The FAST Act also continues MAP-21's expansion of the use of
categorical exclusions (CEs). Currently, according to the FHWA, CEs account for more than 90 percent of
transportation project reviews. Despite being the least burdensome form of environmental review, CEs
can take still take more than a year to complete.
The FAST Act allows the use of programmatic agreements to process CEs as a group, rather than
on a case-by-case basis in an effort to reduce their approval time. This programmatic approach to CEs
was a key recommendation of the ARTBA Trans 2020 Reauthorization Task Force, which noted that
reducing the amount of time it takes to process CEs could free up resources for more complicated
environmental assessment (EA), EIS and permitting decisions.
Programmatic Agreements. The FAST Act encourages the use of "programmatic agreements"
during project review and approval by directing U.S. DOT to establish a programmatic agreement
"template," which could be widely used by individual projects. Programmatic agreements are a means
of delineating responsibilities at the beginning of the environmental review and approval process.
Ideally, programmatic agreements strive to specify clear roles and responsibilities for those involved inthe project review and approval process, eliminating or reducing duplication of effort, while also seeking
to establish clear expectations for review timeframes and processing options. The FHWA has
highlighted the use of programmatic agreements in its "Every Day Counts" program as an effective tool
in reducing project delay.
Once a programmatic agreement is finalized, the FAST Act requires that its terms be given
"substantial weight" by all agencies involved in the review and approval process.
Delegation of Regulatory Responsibilities to States. The FAST Act expands on past efforts to
delegate federal environmental and regulatory responsibilities to states. In order to encourage greater
participation in the program, the measure allows the U.S. DOT to offer training and information-sharing
to states not currently utilizing the delegation program.
In addition, the legislation creates a delegation pilot program for up to five states currently
enrolled in U.S. DOT's NEPA delegation program to substitute their state laws and regulations for NEPA
and its associated regulations. Currently, states in the delegation program are administering NEPA in
place of the federal government. Under the new program, a state could use its own laws and
regulations. States enrolled in this new delegation pilot program may also use their authority over
locally administered transportation projects.
The FAST Act also instructs the department "to the maximum extent practicable" to delegate
responsibility to states for "project design, plans, specifications, estimates, contract awards, and
inspection of projects, both on a project specific and programmatic basis." While the bill's use of "to the
maximum extent practicable" is clearly an attempt in the duplication and delegation sections to
motivate state and federal agencies to utilize the efficiencies that will be available, such an approach
does not require them to do so and it is unclear how or if such language is enforceable.
Coordination of Agency Reviews. The FAST Act also directs U.S. DOT, in coordination with other
federal agencies likely to have review or permitting authority over transportation projects, to develop
guidelines for conducting coordinated project reviews. Coordinated reviews allow for multiple
regulatory processes to occur at the same time as opposed to one-after-the-other, reducing delay.
Additionally, the bill directs U.S. DOT to develop an "environmental checklist" for transportation
projects to be used when a lead agency and participating agencies set project review schedules.
Historic Preservation Requirements. The FAST Act simplifies historical preservation and
mitigation requirements. Under the legislation, the Secretary of Transportation may determine that no
practical alternative exists when a project might impact a historical resource. When such a
determination is made, there will no longer be a need for any further alternatives analysis.
Bridge Repair Projects. The FAST Act seeks to streamline the environmental review process for
bridge repair projects by exempting "common post 1945 concrete or steel bridge[s] or culvert[s]" from
individual review. This was actually done through regulation by FHWA in 2012, but the bill makes the
change permanent. Also, the measure loosens requirements under the Migratory Bird Treaty Act forrepairs made to bridges in "serious" condition (as classified by U.S. DOT's Recording and Coding Guide
for the Structure Inventory and Appraisal of the Nation's Bridges) or worse.
Transparency in the Environmental Review Process. The FAST Act expands upon the current
federal Permitting Dashboard, which is a website the public can access to track the review process for
nationally or regionally significant projects, by creating a website allowing the public to track the process
of all transportation projects requiring either an EIS or EA.
Expediting or Exempting Regulatory Requirements in Emergency Situations. Building upon the
creation of a CE for emergency situations in MAP-21, the FAST Act provides further exemptions and
expedited regulatory procedures for "any road, highway, railway, bridge or transit facility that is
damaged by an emergency." Specifically, regulatory requirements under the federal Clean Water Act,
Endangered Species Act, National Historic Preservation Act, and Migratory Bird Treaty Act are either
required to be expedited or exempted in order to speed repair of critical infrastructure during
emergency situations.
TIFIA and Innovative Financing
The FAST Act will cut annual investment for the Transportation Infrastructure Finance and Innovation
(TIFIA) credit assistance program from the $1 billion per year authorized in FY 14 and FY 15 to the
following levels:
FY16 -$275 million
FY17 -$275 million
FY18 -$285 million
FY19 -$300 million
FY20 - $300 million
While this reduction is likely the result of the FAST Act's revenue constraints rather than opposition to
the TIFIA Program, it should be noted the FHWA was required to transfer $639 million in TIFIA funds to
the highway formula programs on April 27, 2015, because TIFIA's uncommitted balance exceeded the
statutory limit Congress imposed as part of MAP-21. Moreover, the FAST Act eliminates that mandatory
redistribution of uncommitted balances, ensuring all resources allocated to the TIFIA program are
reserved only for that activity.
At the same time, the FAST Act will allow more diversification of the TIFIA program's portfolio by
expanding or facilitating the eligibility for several types of projects. These include projects associated
with transit-oriented development, located in rural areas, smaller in scale (i.e. less than $75 million), or
administered by local governments.
The TIFIA section also provides a new streamlined process for applicants using conventional loan terms
from the program, as established by U.S. DOT. To be eligible, the requested TIFIA loan must by $100million or less, secured and payable from pledged revenues not affected by project performance, with
repayment beginning within five years. In addition, the FAST Act establishes increased funding levels for
U.S. DOT's administration of the TIFIA program.
The FAST Act also clarifies that availability payments made by states under certain P3 concession models
are eligible for federal reimbursement.
Other Notable Provisions
• Hours of Service and Motor Carrier Operators. The FAST Act widens a current exemption to the
hours of service rule for interstate drivers of commercial motor vehicles used for construction.
The new law allows those operating within a 75-mile radius to restart their work week after 24
hours of rest, rather than 34 hours, which is the standard for other drivers. (The previous
allowable radius was 50 miles.) However, a state may establish its own radius between 50 and
75
miles for intrastate operation of these construction vehicles.
It also codifies a recent regulatory exemption for drivers of ready mix concrete delivery
vehicles, through which they are exempt from many requirements of the hours of service rule,
provided they meet certain conditions as to radius of operation, on-duty time and drive time.
Within four years after the FAST Act takes effect, U.S. DOT is to provide a report to
Congress on the safety and enforcement impacts of these and other hours of service
exemptions in the new law.
The bill directs U.S. DOT to convene a task force and establish a pilot program enabling
certain veterans or armed forces reserve members between 18 and 21 years of age to operate
commercial motor vehicles under various restrictions.
• DBE Program. The FAST Act reauthorizes the current provisions of the Disadvantaged Business
Enterprise (DBE) program. It adjusts the annual gross receipts limit for eligible DBE firms to
$23.98 million consistent with recent inflation-based adjustments, and maintains the
requirement for future annual adjustments as well.
The DBE section also includes a "sense of Congress" offered by Rep. Gwen Moore (D-
Wis.), directing U.S. DOT to "take additional steps" and ensure that state DOTs are complying
with existing rules requiring prompt payment to DBE firms. U.S. DOT is also instructed to track
complaints on this issue and make this information available publicly.
• Highway Trust Fund Transparency. Requires semi-annual reports to be published on the
Internet with detailed data on the use of federal highway funds. Data will be provided by the
states on the use of funds from each highway program, with details on all federally-funded
highway projects, including cost, type of improvement, location and project ownership.
• Tolling. States that have been awarded approval to toll existing portions of the Interstate
Highway System as part of a pilot project created in 1998 will be required to move forward with
those projects within one year after the FAST Act takes effect, including submitting a final
application, completing the NEPA process and executing a toll agreement with U.S. DOT. A statemay request a one-year extension if it is making substantial progress on those tasks. Otherwise
a state's "slot" under the pilot program will expire. Similarly, states that receive new,
provisional approval under this pilot program will have three years to complete those
requirements or request a one-year extension.
Several other tolling-related provisions of the FAST Act enable certain privately-owned
bus services to utilize toll facilities under similar terms as public transit vehicles.
• Bundling of Bridges. States will be authorized and encouraged to bundle multiple similar bridge
projects into one project that can be awarded as a single contract, either as a package of
projects or as a statewide bridge improvement program.
• Every Day Counts Program. The FAST Act instructs the FHWA to continue its Every Day Counts
program, developing a new collection of market-ready innovations and best practices at least
every two years.
• Work Zone Safety. Despite ARTBA-supported directives in MAP-21 to develop regulations to
protect roadway construction workers from motorist intrusions into work zones, FHWA has not
promulgated the new rules. The FAST Act directs FHWA "to move rapidly to finalize
regulations" as directed in MAP-21 and "do all within its power to protect workers in highway
work zones."
• Roadside Safety Hardware. Finally, to ensure roadway safety hardware continues to function
properly, even years after initial installation, the FAST Act directs FHWA to conduct a study to
obtain more inventory information on
existing roadside safety devices.
• National Surface Transportation and Innovative Finance Bureau. The FAST Act establishes this
new entity within U.S. DOT, with an executive director to be selected through a competitive
process with presidential approval. In this provision, Congress charges the new bureau with:
• providing state and local transportation agencies with assistance and best practices relating
to project financing and funding, particularly including innovative financing;
• administering the application process for competitive grant and loan programs such as
those for Nationally Significant Freight and Highway Projects (NSFHP) and TIFIA, and
allocation of private activity bonds (PABs);
• reducing uncertainty and delays in environmental reviews and project permitting, through
coordinating with other federal agencies, offering technical assistance and tracking NEPA-
related reviews and decisions; and
• promoting best practices and tracking developments in project procurement "to reduce
costs and risks to taxpayers."
This section of the FAST Act also empowers the Secretary of Transportation to eliminate
or consolidate offices within U.S. DOT to eradicate redundancies and realize savings.Finally, the FAST Act establishes a Council on Credit and Finance, chaired by the deputy
secretary of transportation and comprised of senior U.S. DOT and modal officials. The Council is
to review and recommend applications for project grants and loans as described above. This
formalizes an existing entity within U.S. DOT that had been created by administrative action.
Highway Research, Technology and Education Authorizations
The FAST Act will continue most MAP-21 provisions dealing with the federal highway research,
technology and education programs with only a few significant changes. Major provisions include:
Funding. Most of the highway research, technology and training programs will receive either
the same annual funding as during FY 2015 or small increases.
Advanced Technology Deployment. The bill will expand the scope of the Innovative Pavement
Research and Deployment Program by requiring the Secretary to develop a program to stimulate
deployment of advanced transportation technologies to improve system safety, efficiency and
performance. Grants could be used for advanced traveler (travel?) information systems, advanced
transportation management technologies, advanced public transportation systems, advanced safety
systems including vehicle-to-vehicle communications, among others. Federal share will be 50 percent
and awards could total up to $60 million per year.
Intelligent Transportation System (ITS) Program Goals. The bill expands the list of ITS program
goals to include enhancement of the national freight system and support to national freight policy goals.
Use of ITS Program Funds. The FAST Act specifies that ITS funds for operational tests may not be
used for construction of physical surface transportation infrastructure unless the construction is
incidental and critically necessary to implement an ITS project.
Assistant Secretary and Duties. The bill creates a new Assistant Secretary for Research and
Technology. The bill expands the list of explicit responsibilities of the Secretary of Transportation to
include coordination of departmental research and development activities, advancement of innovative
technologies, development of comprehensive statistics and data, and coordination of multimodal and
multidisciplinary research, among others. The bill also provides that the Secretary may enter into
cooperative contracts with other federal, state and local agencies, and others to carry out departmental
research on a 50/50 cost-sharing basis.
Research and Innovative Technology Administration. The bill repeals the section of the U.S.
Code establishing the Transportation Department's Research and Technology Administration, thus
moving responsibility for transportation research and technology into the Office of the Secretary. The
bill also eliminates the Office of Intermodalism in the Research and Technology Administration.
University Transportation Centers (UTC). The bill will continue the University Transportation
Centers program with a few changes. Funding will increase from $72.5 million in FY 2015 to $77.5
million by FY 2019. Funding for the three UTC levels will be flexible within ranges rather than a fixed
amount as under MAP-21, including $2 million to $4 million for the five National Transportation Centerconsortia; $1.5 million to $3.0 million for the 10 Regional Transportation Center consortia; and $1
million to $2 million for the Tier I centers. Selection of centers will remain competitive and made by the
Transportation Secretary, the new Assistant Secretary for Research and Technology and the FHWA
Administrator. The Federal Transit Administration Administrator is no longer involved. Matching
requirements remain as under MAP-21.
Transportation Funding Alternatives. The bill directs the Secretary to make grants to states to
demonstrate alternative user-based revenue mechanisms that could maintain the long-term solvency of
the HTF. The goal is to test at least two alternative user-based revenue mechanisms and to provide
recommendations for adoption and implementation at the federal level. Funding will be up to $15
million in FY 2016 and $20 million per year thereafter, and the federal share will be 50 percent.
Future Interstate System. The bill provides for a $5 million study by the Transportation Research
Board that focuses on the actions needed to restore the Interstate System as a premier system that
meets the growing and shifting demands of the 21st century, with a report due in three years.
Public Transportation
The FAST Act will substantially boost public transportation investment from the current $10.7
billion to $12.6 billion by FY 2020. Total public transportation authorizations grow by 17.8 percent over
the life of the bill. Of particular note to the transportation construction industry, the FAST Act increases
transit capital investment grants from $1.9 billion in FY 2015 to $2.3 billion in FY 2016 (a 21 percent
increase) and this level of investment is maintained through FY 2020. It should be pointed out,
however, the transit capital grant program is supported by federal general funds—as opposed to HTF
resources—and final investment decisions are made in the annual appropriations process. If this new
increased funding level is met each year, it will mark a 21 percent increase in capital funding for transit
projects above the current mark.
The House-Senate compromise bill includes language allowing up to eight transit capital projects
that are part of a public-private partnership to be considered for fast-track approval process as long as
the projects receive less than 25 percent of funding from the federal program. This builds on a similar
pilot program created in MAP-21 that allowed for three projects receiving less than 50 percent federal
funds to receive the expedited approval process.
The measure also contains $200 million for Positive Train Control upgrades - a rail safety capital
technology program being mandated at the federal level with the intent of cutting down on train
crashes. The funds for this initiative come from the HTF's Mass Transit Account. Table 3 depicts the
specific programmatic and yearly public transportation investment levels that will be provided.TABLE 3
P u b l i c T r a n s p o r t a t i o n P r o g r a m F u n d i n g U n d e r t h e " F i x i n g A m e r i c a 's S u r f a c e T r a n s p o r t a t i o n A c t " ( F A S T A c t ) )
Program A u th o rizatio n s FY2015 FY2016 FY2017 FY2018 FY2019 FY2020 5 -Y e a r Total
A u t h o r iz a t io n s - T r u s t F u n d
F o r m u la G r a n ts , T o ta l 8 ,5 9 5 ,0 0 0 ,0 0 0 9 ,3 4 7 ,6 0 4 ,6 3 9 9 ,5 3 4 ,7 0 6 ,0 4 3 9 ,7 3 3 ,3 5 3 ,4 0 7 9 ,9 3 9 ,3 8 0 ,0 3 0 1 0 ,1 5 0 ,3 4 8 ,4 6 2 4 8 ,7 0 5 ,3 9 2 ,5 8 1
U rb a n iz e d A r e a F o rm u la G ra n ts 4 ,4 5 8 ,6 5 0 ,0 0 0 4 ,5 3 8 ,9 0 5 ,7 0 0 4 ,6 2 9 ,6 8 3 ,8 1 4 4 ,7 2 6 ,9 0 7 ,1 7 4 4 ,8 2 7 ,1 1 7 ,6 0 6 4 ,9 2 9 ,4 5 2 ,4 9 9 2 3 ,6 5 2 ,0 6 6 ,7 9 3
S ta te o f G o o d R e p a ir G ra n ts 2 ,1 6 5 ,9 0 0 ,0 0 0 2 ,5 0 7 ,0 0 0 ,0 0 0 2 ,5 4 9 ,6 7 0 ,0 0 0 2 ,5 9 3 ,7 0 3 ,5 5 8 2 ,6 3 8 ,3 6 6 ,8 5 9 2 ,6 8 3 ,7 9 8 ,3 6 9 1 2 ,9 7 2 ,5 3 8 ,7 8 6
B u s an d F a c ilit ie s F o rm u la G ra n ts 4 2 7 ,8 0 0 ,0 0 0 4 2 7 ,8 0 0 ,0 0 0 4 3 6 ,3 5 6 ,0 0 0 4 4 5 ,5 1 9 ,4 7 6 4 5 4 ,9 6 4 ,4 8 9 4 6 4 ,6 0 9 ,7 3 6 2 ,2 2 9 ,2 4 9 ,7 0 1
F o rm u la G ra n ts f o r R u ra l A re a s 6 0 7 ,8 0 0 ,0 0 0 6 1 9 ,9 5 6 ,0 0 0 6 3 2 ,3 5 5 ,1 2 0 6 4 5 ,6 3 4 ,5 7 8 659 ,3 2 2 ,0 3 1 6 7 3 ,2 9 9 ,6 5 8 3 ,2 3 0 ,5 6 7 ,3 8 7
G r o w in g a n d H ig h D e n s it y S ta te
F o rm u la G ra n ts 5 2 5 ,9 0 0 ,0 0 0 536 ,2 6 1 ,5 3 9 5 4 4 ,4 3 3 ,7 8 8 5 5 2 ,7 8 3 ,5 4 7 5 6 1 ,3 1 5 ,1 2 0 5 7 0 ,0 3 2 ,9 1 7 2 ,7 6 4 ,8 2 6 ,9 1 1
F o rm u la G ra n ts f o r E n h a n c e d
M o b ilit y o f S e n io r s and
In d iv id u a ls w ith D is a b ilit ie s 2 5 8 ,3 0 0 ,0 0 0 2 6 2 ,9 4 9 ,4 0 0 2 6 8 ,2 0 8 ,3 8 8 2 7 3 ,8 4 0 ,7 6 4 279 ,6 4 6 ,1 8 8 2 8 5 ,5 7 4 ,6 8 8 1 ,3 7 0 ,2 1 9 ,4 2 8
M e tro p o lita n P la n n in g 1 2 8 ,8 0 0 ,0 0 0 130 ,7 3 2 ,0 0 0 13 3 ,3 9 8 ,9 3 3 1 3 6 ,2 0 0 ,3 1 0 1 3 9,087,757 14 2 ,0 3 6 ,4 1 7 6 8 1 ,4 5 5 ,4 1 7
T r a n s it O r ie n te d P la n n in g 1 0 ,0 0 0 ,0 0 0 1 0 ,0 0 0 ,0 0 0 1 0 ,0 0 0 ,0 0 0 1 0 ,0 0 0 ,0 0 0 1 0 ,0 0 0 ,0 0 0 1 0 ,0 0 0 ,0 0 0 5 0 ,0 0 0 ,0 0 0
P ilo t P ro g ra m f o r In n o v a tiv e
A c c e s s s a n d M o b ility 2 ,0 0 0 ,0 0 0 3 ,0 0 0 ,0 0 0 3 ,2 5 0 ,0 0 0 3 ,5 0 0 ,0 0 0 3 ,5 0 0 ,0 0 0 1 5 ,2 5 0 ,0 0 0
R e s e a rc h , D e v e lo p m e n t , D e m o
an d D e p lo y m e n t P ro g ra m 2 8 ,0 0 0 ,0 0 0 2 8 ,0 0 0 ,0 0 0 2 8 ,0 0 0 ,0 0 0 2 8 ,0 0 0 ,0 0 0 2 8 ,0 0 0 ,0 0 0 1 4 0 ,0 0 0 ,0 0 0
T e c h A s s is t a n c e an d D e v e lo p m e n t 4 ,0 0 0 ,0 0 0 4 ,0 0 0 ,0 0 0 4 ,0 0 0 ,0 0 0 4 ,0 0 0 ,0 0 0 4 ,0 0 0 ,0 0 0 2 0 ,0 0 0 ,0 0 0
B u s T e s t in g F a c ility 3 ,0 0 0 ,0 0 0 3 ,0 0 0 ,0 0 0 3 ,0 0 0 ,0 0 0 3 ,0 0 0 ,0 0 0 3 ,0 0 0 ,0 0 0 3 ,0 0 0 ,0 0 0 1 5 ,0 0 0 ,0 0 0
N a tio n a l T ra n s it In s titu te 5 ,0 0 0 ,0 0 0 5 ,0 0 0 ,0 0 0 5 ,0 0 0 ,0 0 0 5 ,0 0 0 ,0 0 0 5 ,0 0 0 ,0 0 0 5 ,0 0 0 ,0 0 0 2 5 ,0 0 0 ,0 0 0
N a tio n a l T ra n s it D a ta b a se 3 ,8 5 0 ,0 0 0 4 ,0 0 0 ,0 0 0 4 ,0 0 0 ,0 0 0 4 ,0 0 0 ,0 0 0 4 ,0 0 0 ,0 0 0 4 ,0 0 0 ,0 0 0 2 0 ,0 0 0 ,0 0 0
B u s C o m p e titiv e G ra n ts & Lo w
E m is s io n s G ra n ts 2 6 8 ,0 0 0 ,0 0 0 2 8 3 ,6 0 0 ,0 0 0 3 0 1 ,5 1 4 ,0 0 0 3 2 2 ,0 5 9 ,9 8 0 3 4 4 ,0 4 4 ,1 7 9 1 ,5 1 9 ,2 1 8 ,1 5 9
R e se a rc h , D e v e lo p m e n t , D e m o n s t ra tio n
an d D e p lo y m e n t P ro g ra m 7 0 ,0 0 0 ,0 0 0 2 0 ,0 0 0 ,0 0 0 2 0 ,0 0 0 ,0 0 0 2 0 ,0 0 0 ,0 0 0 2 0 ,0 0 0 ,0 0 0 2 0 ,0 0 0 ,0 0 0 1 0 0 ,0 0 0 ,0 0 0
T e c h A s s is t a n c e an d T r a in in g 7 ,0 0 0 ,0 0 0 5 ,0 0 0 ,0 0 0 5 ,0 0 0 ,0 0 0 5 ,0 0 0 ,0 0 0 5 ,0 0 0 ,0 0 0 5 ,0 0 0 ,0 0 0 2 5 ,0 0 0 ,0 0 0
A u t h o r iz a t io n s - G e n e r a l F u n d
C a p ita l In v e s t m e n t G ra n ts 1 ,9 0 7 ,0 0 0 ,0 0 0 2 ,3 0 1 ,7 8 5 ,7 6 0 2 ,3 0 1 ,7 8 5 ,7 6 0 2 ,3 0 1 ,7 8 5 ,7 6 0 2 ,3 0 1 ,7 8 5 ,7 6 0 2 ,3 0 1 ,7 8 5 ,7 6 0 1 1 ,5 0 8 ,9 2 8 ,8 0 0
A d m in is t r a t io n 1 0 4 ,0 0 0 ,0 0 0 1 1 5,016,543 11 5 ,0 1 6 ,5 4 3 115 ,0 1 6 ,5 4 3 1 1 5,016,543 11 5 ,0 1 6 ,5 4 3 5 7 5 ,0 8 2 ,7 1 5
T o ta l A u t h o r iz a t io n s 1 0 ,6 8 3 ,0 0 0 ,0 0 0 1 1 ,7 8 9 ,4 0 6 ,9 4 2 1 1 ,9 7 6 ,5 0 8 ,3 4 6 1 2 ,1 7 5 ,1 5 5 ,7 1 0 1 2 ,3 8 1 ,1 8 2 ,3 3 3 1 2 ,5 9 2 ,1 5 0 ,7 6 5 6 0 ,9 1 4 ,4 0 4 ,0 9 6
Similar to the FAST Act's highway investments, the measure's public transportation investment
levels will see a significant 10.4 percent increase in FY 2016, followed by annual increases of 1.6 percent
to 1.7 percent over the subsequent four years. These investment levels exceed projected inflation by a
total of $700 million over the next five years. (See chart below.)FAST Act Proposed Obligations for
Federal Aid Transit Program
$13.0
$12.6
$12.5
$12.0
Billions
of
$
$11.5
$11.4
$11.0
$10.7
$10.5
$10.0
2015
2016
2017
2018
2019
2020
FAST
Act
Nominal
Transit
Obligations
Adjusted
for
Inflation
Source: ARTBA analysis of FAST Act. Inflation forecast from CBO’s August 2015 report "An Update to the Budget and
Economic Outlook: 2015 to 2025."You can also read