2016 CIBC Gold Forum - London Frank Herbert - President - TSX: CG www.centerragold.com
←
→
Page content transcription
If your browser does not render page correctly, please read the page content below
2016 CIBC Gold Forum - London
Frank Herbert - President

                                TSX: CG
                                www.centerragold.com
Caution Regarding Forward-Looking Information
Information contained in this presentation which are not statements of historical facts, and the documents incorporated by reference herein, may be “forward-looking information” for the purposes of Canadian securities
laws. Such forward-looking information involves risks, uncertainties and other factors that could cause actual results, performance, prospects and opportunities to differ materially from those expressed or implied by such
forward looking information. The words “believe”, “expect”, “anticipate”, “contemplate”, “target”, “plan”, “intends”, “continue”, “budget”, “estimate”, “may”, “will”, “schedule” “understand” and similar expressions identify
forward-looking information. These forward-looking statements relate to, among other things: expectations relating to the Company’s 2016 outlook; the Company’s 2016 cash flow, cash and short-term investments, future
business plans, production and cost estimates, reserve and resource estimates, development project pipeline, future dividends, exploration opportunities, grades, strip ratios and recoveries, and future financing; matters
specific to the Öksüt Project, including timing and manner of future mining and processing, financial projections, including net present value and internal rate of return; matters specific to the Greenstone Gold Property,
including investments into the project, future tax savings, the timing of a bankable feasibility study and sensitivities; matters specific to the Gatsuurt Project, including expected mine life and capital estimates; matters
relating to the Kumtor Project, including underground opportunities and business process opportunities.

Forward-looking information is necessarily based upon a number of estimates and assumptions that, while considered reasonable by Centerra, are inherently subject to significant political, business, economic and
competitive uncertainties and contingencies. Known and unknown factors could cause actual results to differ materially from those projected in the forward looking information. Factors that could cause actual results or
events to differ materially from current expectations include, among other things: (A) strategic, legal, planning and other risks, including: political risks associated with the Company’s operations in the Kyrgyz Republic,
Mongolia and Turkey; resource nationalism including the management of external stakeholder expectations; the impact of changes in, or to the more aggressive enforcement of, laws, regulations and government practices
in the jurisdictions in which the Company operates including any unjustified civil or criminal action against the Company, its affiliates or its current or former employees; the impact of any actions taken by the Kyrgyz
Republic Government and Parliament relating to the Kumtor Project Agreements which are inconsistent with the rights of Centerra and KGC under the Kumtor Project Agreements; any impact on the purported cancellation
of Kumtor’s land use rights at the Kumtor Project pursuant to a court claim commenced by the Kyrgyz Republic General Prosecutor’s Office; the risks related to other outstanding litigation affecting the Company’s
operations in the Kyrgyz Republic and elsewhere; the impact of the delay by relevant government agencies to provide required approvals and permits, including the delay currently being experienced at the Kumtor Project
over the Kumtor 2016 life of mine plan and ecological passport; the terms pursuant to which the Mongolian Government will participate in, or to take a special royalty rate in, the Gatsuurt Project; the impact of changes to,
the increased enforcement of, environmental laws and regulations relating to the Company’s operations; the impact of any sanctions imposed by Canada, the United States or other jurisdictions against various Russian
individuals and entities; the ability of the Company to negotiate a successful development agreement for the Gatsuurt Project; potential defects of title in the Company’s properties that are not known as of the date hereof;
the inability of the Company and its subsidiaries to enforce their legal rights in certain circumstances; the presence of a significant shareholder that is a state-owned company of the Kyrgyz Republic; risks related to anti-
corruption legislation; risks related to the concentration of assets in Central Asia; Centerra’s future exploration and development activities not being successful; Centerra not being able to replace mineral reserves;
difficulties with Centerra’s joint venture partners; and aboriginal claims and consultative issues relating to the Company’s 50% interest in the Greenstone Gold Property; potential risks related to kidnapping or acts of
terrorism; (B) risks relating to financial matters, including: sensitivity of the Company’s business to the volatility of gold prices, the imprecision of the Company’s mineral reserves and resources estimates and the
assumptions they rely on, the accuracy of the Company’s production and cost estimates, the impact of restrictive covenants in the Company’s revolving credit facility which may, among other things, restrict the Company
from pursuing certain business activities, the Company’s ability to obtain future financing, the impact of global financial conditions, the impact of currency fluctuations, the effect of market conditions on the Company’s
short-term investments, the Company’s ability to make payments including any payments of principal and interest on the Company’s debt facilities depends on the cash flow of its subsidiaries; and (C) risks related to
operational matters and geotechnical issues, including: movement of the Davidov Glacier and the waste and ice movement at the Kumtor Project and the Company’s continued ability to successfully manage such matters,
including the continued performance of the buttress; the occurrence of further ground movements at the Kumtor Project and mechanical availability; the success of the Company’s future exploration and development
activities, including the financial and political risks inherent in carrying out exploration activities; inherent risks associated with the use of sodium cyanide in the mining operations; the adequacy of the Company’s insurance
to mitigate operational risks; mechanical breakdowns; the Company’s ability to obtain the necessary permits and authorizations to (among other things) raise the tailings dam at the Kumtor Project to the required height;
the Company’s ability to replace its mineral reserves; the occurrence of any labour unrest or disturbance and the ability of the Company to successfully re-negotiate collective agreements when required; the risk that
Centerra’s workforce may be exposed to widespread epidemic; seismic activity in the vicinity of the Company’s operations; long lead times required for equipment and supplies given the remote location of some of the
Company’s operating properties; reliance on a limited number of suppliers for certain consumables, equipment and components; illegal mining on the Company’s Mongolian properties; the Company’s ability to accurately
predict decommissioning and reclamation costs; the Company’s ability to attract and retain qualified personnel; competition for mineral acquisition opportunities; and risks associated with the conduct of joint
ventures/partnerships, including the Greenstone Gold Partnership; the Company’s ability to manage its projects effectively and to mitigate the potential lack of availability of contractors, budget and timing overruns and
project resources. See “Risk Factors” in the MD&A dated February 24, 2016 and in the Company’s most recently filed Annual Information Form available on SEDAR at www.sedar.com.

Furthermore, market price fluctuations in gold, as well as increased capital or production costs or reduced recovery rates may render mineral reserves containing lower grades of mineralization uneconomic and may
ultimately result in a restatement of reserves. The extent to which resources may ultimately be reclassified as proven or probable reserves is dependent upon the demonstration of their profitable recovery. Economic and
technological factors which may change over time always influence the evaluation of reserves or resources. Centerra has not adjusted mineral resource figures in consideration of these risks and, therefore, Centerra can
give no assurances that any mineral resource estimate will ultimately be reclassified as proven and probable reserves. There can be no assurances that forward-looking information and statements will prove to be
accurate, as many factors and future events, both known and unknown could cause actual results, performance or achievements to vary or differ materially, from the results, performance or achievements that are or may
be expressed or implied by such forward-looking statements contained herein or incorporated by reference. Accordingly, all such factors should be considered carefully when making decisions with respect to Centerra, and
prospective investors should not place undue reliance on forward looking information. Forward-looking information is as of April 18, 2016. Centerra assumes no obligation to update or revise forward looking information to
reflect changes in assumptions, changes in circumstances or any other events affecting such forward-looking information, except as required by applicable law. Except as otherwise noted herein, Gordon Reid, Professional
Engineer and Centerra’s Vice President and Chief Operating Officer, has reviewed and approved the scientific and technical information contained in this presentation. Mr. Reid is a Qualified Person within the meaning of NI
43-101. For more information, please refer to the Company’s 2014 AIF and the technical reports referenced therein, which are available on SEDAR. All figures are in United States dollars unless otherwise stated.

April 2016                                                                                                                                                                                                                       2
Centerra: Built For Success
Built for Success Kumtor Five Year Gold Production Profile
600,000 4.50
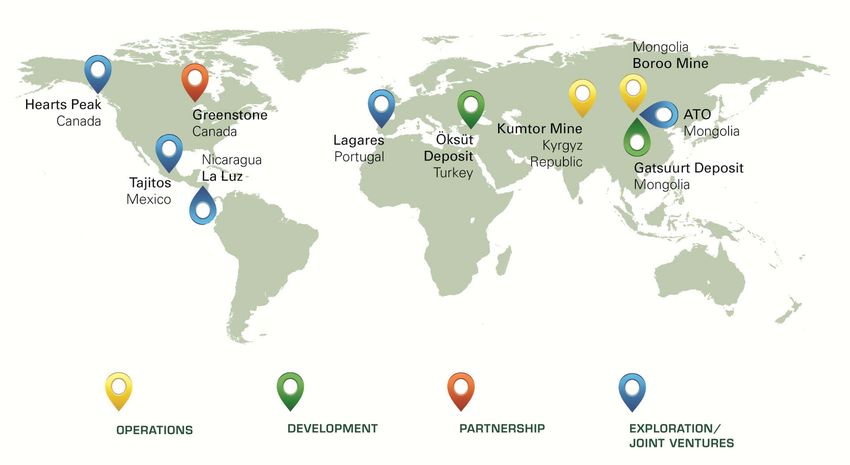
Internationally Diversified Gold Producer
500,000 4.00
3.50
400,000
Up to 530kozpa at AISC1 of up to $877 per ounce
3.00
grade g/t
Ounces
300,000
2.50
Significant operational cash flow profile 200,000
2.00
100,000 1.50
Internally funded, late-stage development pipeline
0 1.00
2015 2016 2017 2018 2019 2020
Projects drive 100% increase in gold production by 2020 Profitably Growing to 1Moz’s Per Annum
1,000
Net Cash Position of US$466MM2
Trading at a discount to peers
Ounces (000’s)
Quarterly Dividend Distributions (2.7% Yield4)
Positive Retained Earnings of US$728MM2 0
Kumtor Oksut Gatsuurt Greenstone Total
April 2016 3
Centerra: Capital Markets Profile

  Capital Structure (CG:TSX)                                                          Internally Funded Business (US$)
   Share Price                                C$6.75                          800
   (as of April 13, 2016)                                                                          158              76
                                                                              700
                                                                                                                                73
   Basic Shares Outstanding                   242.0MM
                                                                              600      562                                                     29
                                                                                                                                                            542

                                                              US$ Millions
   Market Capitalization                     C$1,634MM                        500

                                                                              400
   Cash on Hand2                             US$542MM
                                                                              300
   Debt2                                     US$76MM
                                                                              200
                                                                                     2014 Cash     Kumtor      Greenstone      Other        Shareholder 2015 Cash
   Enterprise Value                          US$810MM                                             Cashflow     Acquisition   (Projects,      Dividends
                                                                                                                             G&A, etc)

                     Strong Balance Sheet (US$)                                                   Stable Share Count
                                                                     300.0
 (as of Dec. 31, 2015)

                                                                     250.0                                          235.5 236.1 236.4 236.4 236.4 237.9
                                                                                                         226.7
                                                                                    216.2 216.3 216.3

                                                                     200.0
                                                         millions

                            Debt      Cash                           150.0

                         $76MM      $542MM
                                                                     100.0

                                                                             50.0

                                                                              0.0
                                                                                    2006   2007   2008       2009   2010     2011    2012     2013   2014    2015

April 2016                                                                                                                                                          4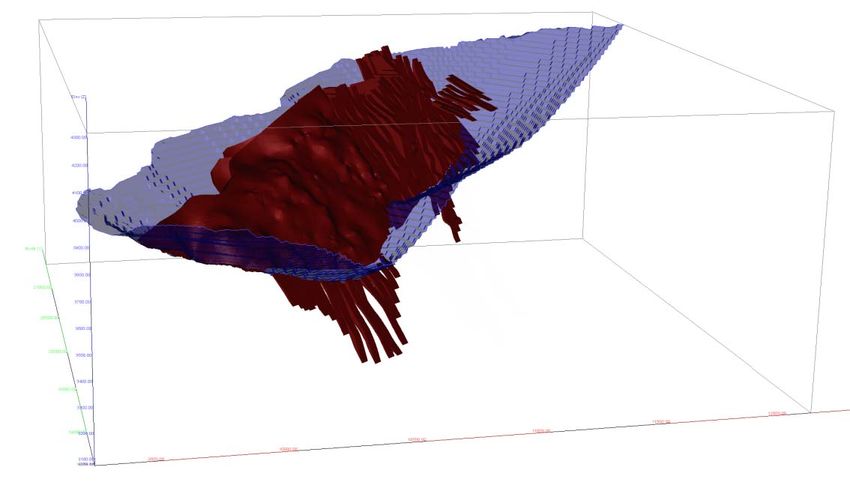
Centerra: Capital Markets Profile

                 Top Ten Shareholders3              Diversified Portfolio (Consensus NAV)
                                                              Greenstone,
                                                                  9%              Net Cash,
    32.0%    Kyrgyzaltyn JSC
                                                                                    24%
                                                        Gatsuurt,
                                                          12%
     9.4%    Paulson & Co

     6.5%    Van Eck Associates                     Oksut, 13%

     4.0%    BlackRock Investment Management (UK)

                                                                                 Kumtor,
     2.3%    Dimensional Fund Advisors                                            42%

                                                                    Shareholder Base
     1.8%    Newton Investment Management Ltd.
                                                             Retail, 30%

     1.8%    USAA Investment Management Company

     1.4%    Gabelli Funds

     1.3%    Franklin Advisers Inc.                                                           Institutional,
                                                                                                  38%

                                                      Kyrgyzaltyn
     1.0%    The Vanguard Group
                                                       JSC, 32%

April 2016                                                                                                     5
Centerra: Internationally Diversified Portfolio

April 2016                                        6
Centerra: Robust Financial Margins in all Cycles

                              Cash Reserves Profile (US$)                                                                            2014 Free Cash Flow Profile (US$)
                1,000                                                                             2,000

                 800                                                                              1,600

                                                                                                               Gold Price (US$/oz)
 US$ Millions

                 600                                                                              1,200

                                                                                                                                          Cash Flows    Operating
                 400                                                                              800                                      Invested     Cash Flows
                                                                                                                                           $282 MM       $376 MM

                 200                                                                              400

                   0                                                                              0
                        2004 2005 2006 2007 2008 2009 2010 2011 2012 2013 2014 2015

                            Cumulative Dividends            Cash Balance            Gold Price

                          Retained Earnings Profile (US$)                                                                            2015 Free Cash Flow Profile (US$)
                1,200                                                                            2,000

                1,000
                                                                                                 1,600
                                                                                240                   240
                                                                                                          Gold Price (US$/oz)

                  800
                                                                              U/G miners          U/G miners
                                                                                                 1,200
US$ Millions

                  600                                                                                                                                  Operating
                                                                                                                                          Cash Flows   Cash Flows
                                        YE target of                                             800                                       Invested     $334 MM
                  400                    4,000tpd                                                                                          $244 MM
                                                                                                 400
                  200                      170
                                         U/G miners

                    0                                                                            0
                        2004 2005 2006 2007 2008 2009 2010 2011 2012 2013 2014 2015

                           Retained Earnings           Cumulative Dividends          Gold Price
April 2016                                                                                                                                                               7
Centerra: Shareholder Value Creation
Financial Discipline Equals Peer Leading Dividend Distributions
Historical cumulative dividend payments of US$240 million
Peer leading dividend
Quarterly dividend distribution of C$0.04 cents per share
Annual Dividend Declared (US$MM’s) Dividend Yield4
$99
3.00% 2.7%
2.4%
2.50%
2.00%
1.5%
1.50% 1.3%
$36 $34 0.9% 0.9%
$28 $29 1.00% 0.8%
0.7%
0.6%
0.4% 0.4%
$14 0.50% 0.3%
0.1%
0.00%
2010 2011 2012 2013 2014 2015
Source: Scotiabank GBM
April 2016 8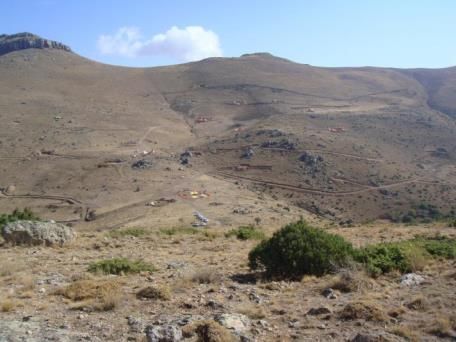
Centerra: Operational Execution

    2015 GUIDANCE: GROWING PRODUCTION AND DECLINING COSTS
    2015 production and costs exceed revised guidance, production increased: 3%; costs declined: 5%;

    ›   Underpins strong financial performance

                                    2015 Company-Wide Operational Guidance Highlights

                 Increased Gold Production Guidance - Mid-Points, Actual                                 Reduced All-In Sustaining Cost Per Ounce Guidance (US$/oz) -
                                                                                                                               Mid Points, Actual
 550,000                                                                536,921
                                            520,000                                              1,000
                 507,500
 500,000                                                                                                             915
                                                                                                   900
                                                                                                                                              852
 450,000                                                                                                                                                           814
                                                                                                   800
 400,000

                                                                                                   700
 350,000

                                                                                                   600
 300,000

 250,000                                                                                           500
                  Original                   Revised                      Actual                                   Original                 Revised                Actual
                     Gold Production and cost guidance includes 15,000 oz from secondary leaching and mill clean out from Boroo which is in care and maintenance
April 2016                                                                                                                                                                  9
Kumtor: World Class Open Pit Gold Mine

                                                         2015            2016E                                       Kumtor Five Year Gold Production Profile
     Gold Production (koz)                               521             480-530                           600,000                                                                                     4.50
    Adjusted Operating Costs ($/oz) (1)                  $326           $426-$471
                                                                                                           500,000                                                                                     4.00
     All-In Sustaining Costs   ($/oz) (1)                $731           $817-$902
                                                                                                                                                                                                       3.50
                                                                                                           400,000
     Growth Capital ($MM)(1)                             $14              $26
                                                                                                                                                                                                       3.00

                                                                                                                                                                                                              grade g/t
                                                                                       Ounces
     Projected Asset Life (years)                                 +10                                      300,000
                                                                                                                                                                                                       2.50
     Reserves (Moz) (5)                                           5.6
                                                                                                           200,000
                                                                                                                                                                                                       2.00
       Au Grade (g/t)                                             2.5
                                                                                                           100,000                                                                                     1.50
     Resources M&I (Moz) (5)                                      2.6

       Au Grade (g/t)                                             2.7                                                 0                                                                                1.00
                                                                                                                              2015             2016       2017          2018     2019         2020

                  World Class Cornerstone Asset                                                                                  Reserve Replacement Profile
                                                                                                           12,000
               +18 years of uninterrupted profitable production                                                              Kumtor Reserves
                                                                                                           10,000
                                                                                                                             Kumtor Ounces Mined
                                                                                                             8,000

               Over 10M ounces produced since 1997                                                           6,000

                                                            240             240                              4,000
                                                          U/G miners      U/G miners
               5.6M ounces remaining in open pit reserves                                                    2,000
                                                                                       Au Ounces (000's)

                                              207                                                                0

                          YE target of      U/G miners
               Low cost,4,000tpd
                         long life production
                                                                                                            (2,000)

                                                                                                            (4,000)

                             170                                                                            (6,000)
               High-grade
                        U/G underground
                            miners      opportunity                                                         (8,000)

                                                                                                           (10,000)

               Strong stable platform to grow Centerra                                                     (12,000)
                                                                                                                      2004     2005      2006      2007   2008   2009    2010   2011   2012   2013   2014   2015

April 2016                                                                                                                                                                                                           10
Kumtor: Continuous Improvement Opportunities
2015/16 Business Process Opportunities
Work force optimization
Mill availability up to 96.5%
Mill throughput up to 18,000 tpd
Blending: Gold recovery up to 80%
‘Hot shift’ changes in mining operations
Increase truck tray size to improve fill factor
240 240
U/G miners U/G miners
Two haul trucks parked in 2016
207
YE target of U/G miners
4,000tpd
One shovel to be parked in Q4-2016
170
U/G miners
Processing of carbon gold fines
April 2016 11Kumtor: Over 18 Years Uninterrupted Operations
Kyrgyz Republic: Kumtor Cash Reserves Profile (US$)
1,000 2,000
Successful Parliamentary elections Oct.2015
800 1,600
Gold Price (US$/oz)
US$ Millions
600 1,200
New Government formed (continuity)
400 800
200 400
Largest employer
0 0
2004 2005 2006 2007 2008 2009 2010 2011 2012 2013 2014 2015
Cumulative Dividends Cash Balance Gold Price
Largest taxpayer
Paid >US$1 Billion to budget and social fund
240 240
U/G miners U/G miners
207
Spend >US$80MMpa
YE target of in local procurement
U/G miners
4,000tpd
170
U/G miners
Kyrgyz: Long-term shareholder since IPO
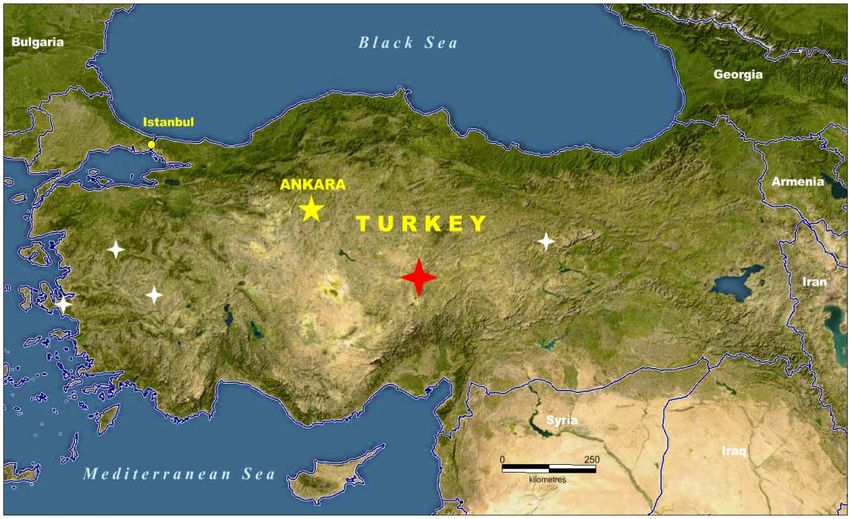
April 2016 12Öksüt: Fully Funded High Margin Gold Production
2015 Feasibility Highlights
Mine Type Open Pit, Heap Leach
Avg. LOM Annual Production 110koz Au
Avg. LOM AISC1 (US$/oz) $490
Reserve Mine Life 8 years
Development Capex (US$MM) $221
Reserves6 (Moz) at $1,250 gold 1.2
Öksüt Gold
Au grade (g/t) 1.40 Project
Life of Mine Strip Ratio (w:o) 2:1
First Gold Pour Q3-2017
IRR (after tax) 43%
NPV(8%) - after tax >$240MM
Catalyst Schedule Near-Term Gold Production
EIA approval received in November 2015 250 2.50
Construction expected in mid-2016 200 2.00
2 stage crushing, stack at 11,000 tpd
Process Grade (g/tonne)
Gold Production (000's)
150 1.50
Life of mine recovery of 77%
100 1.00
Significant exploration upside
50 0.50
Bought back Stratex and Teck royalties
0 0.00
2016 2017 2018 2019 2020 2021 2022 2023 2024
$150MM low-cost +5-year financing in-place
April 2016 13Gatsuurt: Gold Development Project
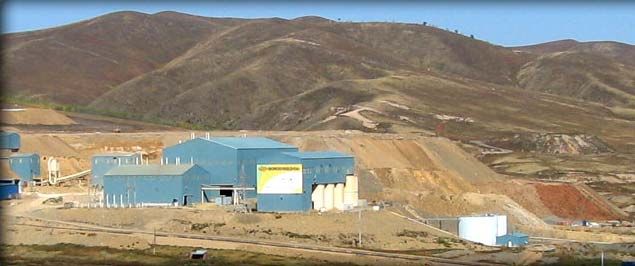
2015 Highlights
Boroo mill on care & maintenance awaiting Gatsuurt approval
Gatsuurt declared strategic January 2015
3% royalty (versus 34% ownership) approved by government
Investment development agreement negotiations commenced
Potential production 12-18 months after approval
Reserves8 of 1.6M contained ounces @ 2.9 g/tonne
Strip ratio of 6:1 and process recoveries in excess of 76%
Significant exploration upside
Boroo’s Historical Cumulative Net Cash Generation (US$MM) In-Place 5ktpd Processing Facility (Boroo)
600
500
400
300
200
100
0
(100)
2004 2005 2006 2007 2008 2009 2010 2011 2012 2013 2014
April 2016 14Greenstone: One of Canada’s Largest
Undeveloped Open Pit Gold Mines
Cornerstone Canadian Development Project Ontario: Top Tier Mining Jurisdiction
50:50 development partnership with Premier Gold
Open pit resources7 (100%) in excess of 4M oz @ 1.47 g/t
Historic gold production of 4.12M oz (~1934-1970)
Large land package covers 337km2, good infrastructure
Significant exploration and underground resource potential
Greenstone Gold Greenstone Development Project
Property
Location: Ontario, Canada
Bankable feasibility study expected in H1-2016
Brookbank Deposit
Brookbank Geraldton
11
Jellicoe
Viper
Hardrock
Hardrock Deposit
Beardmore
Beardmore – Geraldton Greenstone Belt +110 km
April 2016 15Greenstone: Greenstone Gold Property Resources
Hardrock Deposit*
In-Pit Resources at 0.50 g/t Au cutoff grade
Indicated: 83.87 Mt @ 1.47 g/t Au for 3.97 Moz
Inferred: 10.23 Mt @ 1.53 g/t Au for 0.50 Moz
Underground Resources at 3.00 g/t Au cutoff grade
Indicated: 5.17 Mt @ 5.40 g/t Au for 0.90 Moz
Inferred: 12.92 Mt @ 5.40 g/t Au for 2.24 Moz
Hardrock Deposit
Indicated Resource Model Blocks
Inferred Resource Model Blocks 500m
Oblique Longitudinal View to North
* As reported in Premier Gold Mines’ NI 43-101 Technical Brookbank Deposit*
Report and Mineral Resource Estimate Update for the Hardrock Open Pit Resources at 0.50 g/t Au cutoff grade
Deposit, Issue Date: August 22, 2014, Effective Date: July 4, Indicated: 2.64 Mt @ 2.01 g/t Au for 171,000 oz
2014 and in Centerra and Premier’s NI 43-101 on the Trans- Inferred: 0.17 Mt @ 2.38 g/t Au for 13,000 oz
Canada Property, Issue Date: February 5, 2015, Effective Date:
March 20, 2015. Underground Resources at 2.80 g/t Au cutoff grade
Indicated: 1.85 Mt @ 7.21 g/t Au for 429,000 oz
Inferred: 0.40 Mt @ 4.02 g/t Au for 53,000 oz 16
April 2016Centerra: Built For Success
Kumtor: World Class Open Pit Gold Mine
World class cornerstone asset underpinning Company’s growing production portfolio
Long lived, lower cost quartile asset generating significant positive cash flow
Öksüt: High Margin Open Pit Heap Leach Gold Mine
Fully funded, late-stage gold development project
Near-term high margin gold production
Gatsuurt: Large Scale Open Pit Gold Mine
Investment agreement negotiations underway
Surface processing infrastructure in-place (gold production 12-18 months after approval)
Greenstone: Large Scale Open Pit Gold Mine
One of Canada’s largest undeveloped open pit gold mines
Feasibility and mine permitting work underway
April 2016 17April 2016
BVN $2.20
GOLD $7,594
DGC $1.99
NGD $6,453
Source: Scotiabank GBM
K $1.84
DGC $5,458
GFI $1.76
ELD $4,753
NGD $0.90
SMF $4,247
DPM $0.81
BVN $4,148
SSRI $0.51
OGC $3,830
BTO $0.44
ELD $0.40 BTO $3,686
AGI $0.10 AGI $3,674
OGC $0.02 GFI $2,832
IMG $0.01 ASR $2,433
ACA ($0.26) K $2,224
Net Debt per Share (US$)
SMF ($0.26) DPM $2,057
TAHO ($0.43) ACA $1,960
ASR ($1.24) SSRI $1,643
CG ($1.93) CG $1,308
Enterprise Value/2016E Production (US$/oz)
GOLD ($2.27) IMG $1,145
SSRI $2.96 GOLD 19.3x
GOLD $2.29 TAHO 14.1x
Centerra: Investment Opportunity
CG $2.24 ELD 13.8x
IMG $1.66 DGC 12.3x
ASR $1.24 AGI 12.2x
AGI $1.13 BVN 11.4x
DGC $1.00 NGD 10.7x
K $0.73 BTO 9.3x
TAHO $0.71 SMF 8.5x
NGD $0.64 SSRI 8.0x
ACA $0.57 OGC 7.1x
GFI $0.56 K 6.5x
Cash per Share (US$)
SMF $0.56 GFI 6.1x
ELD $0.44 ACA 6.1x
Enterprise Value/2016E CFPS
BVN $0.31 DPM 5.5x
OGC $0.30 IMG 5.4x
DPM $0.26 ASR 4.4x
BTO $0.09 CG 2.7x
18Centerra: Footnotes
(1) Adjusted operating costs, all-in sustaining costs (AISC), all-in costs and all-in costs - including taxes as well as sustaining capital, growth capital,
average realized gold price per ounce and cost of sales per ounce sold are non-GAAP measures and are discussed under “Non-GAAP Measures”
in the Company’s MD&A filed on SEDAR.
(2) As of December 31, 2015.
(3) According to Thomson Reuters as of April 8, 2016.
(4) As of April 7, 2016 according to Thomson Reuters, Scotiabank GBM.
(5) The mineral reserves at Kumtor have been estimated based on a gold price of $1,200 per ounce, as at December 31, 2015. The open pit
reserves and resources at Kumtor are estimated based on a cut-off grade of 0.85 grams of gold per tonne for the Central Pit and 1.0 grams of
gold per tonne for the Southwest and Sarytor deposits. Open Pit resources at Kumtor are constrained by a pit shell developed using a gold price
of $1,450 per ounce. Mineral resources are in addition to reserves. Mineral resources do not have demonstrated economic viability. Further
information including key assumptions, parameters and methods used to estimate mineral resources and reserves, as well as legal, political,
environmental and other risks are described in Centerra’s 2014 Annual Information Form dated March 31, 2015 filed on SEDAR.
(6) The mineral reserves at Öksüt have been estimated based on a gold price of $1,200 per ounce, as at December 31, 2015. The open pit reserves
are estimated on a cut-off grade of 0.3 grams of gold per tonne. Further information including key assumptions, parameters and methods used
to estimate mineral resources and reserves, as well as legal, political, environmental and other risks are described in the Technical Report on the
Öksüt Gold Project dated September 3, 2015, Effective Date: June 30, 2015 filed on SEDAR.
(7) As reported in Centerra Gold Inc. and Premier Gold Mines NI 43-101 Technical Report on the Trans-Canada Property, Issue Date: March 20,
2015, Effective Date: February 5, 2015 filed on SEDAR.
(8) The mineral reserves at Gatsuurt have been estimated based on a gold price of $1,200 per ounce, as at December 31, 2015. The open pit
reserves are estimated using a 1.4 grams of gold per tonne cut-off grade. Further information including key assumptions, parameters and
methods used to estimate mineral resources and reserves, as well as legal, political, environmental and other risks are described in Centerra’s
2014 Annual Information Form dated March 31, 2015 filed on SEDAR.
April 2016 19TSX: CG www.centerragold.com
April 2016 Appendix
Centerra: Senior Management
Industry
Background
Experience
SCOTT PERRY • Appointed Chief Executive Officer in November, 2015
Chief Executive Officer
20 years
• Former Chief Executive Officer at AuRico Gold
FRANK HERBERT • Appointed President in November, 2015
25 years
President
• Joined Centerra in 2004
GORDON REID • Appointed Chief Operating Officer in January, 2013
30 years
Chief Operating Officer • Joined Centerra in 2004
DARREN MILLMAN • Appointed Chief Financial Officer in April, 2016
18 years
Chief Financial Officer • Joined Centerra in 2013
April 2016 22Centerra: Directors
Board of Directors Background
STEPHEN A. LANG Chairman Appointed Director of Centerra’s Board, June 2008
BRUCE V. WALTER Vice Chair Appointed Director of Centerra’s Board, May 2008
SCOTT G. PERRY Director Appointed Director of Centerra’s Board, January 2016
RICHARD W. CONNOR Director Appointed Director of Centerra’s Board, June 2012
RAPHAEL A. GIRARD Director Appointed Director of Centerra’s Board, August 2010
EDUARD KUBATOV Director Appointed Director of Centerra’s Board, March 2016
MICHAEL S. PARRETT Director Appointed Director of Centerra’s Board, May 2014
SHERYL K. PRESSLER Director Appointed Director of Centerra’s Board, May 2008
TERRY V. ROGERS Director Appointed Director of Centerra’s Board, February 2003
BEKTUR SAGYNOV Director Appointed Director of Centerra’s Board, March 2016
KYLYCHBEK SHAKIROV Director Appointed Director of Centerra’s Board, July 2013
April 2016 23Centerra: Capital Markets Profile
Analyst Coverage Diversified Portfolio (Consensus NAV)
Greenstone,
9% Net Cash,
BMO Capital Markets 24%
Gatsuurt,
12%
BofA, Merrill Lynch
Oksut, 13%
Canaccord Genuity
GMP Securities L.P.
Kumtor,
42%
RBC Capital Markets Shareholder Base
Retail, 30%
Scotiabank
TD Securities Inc.
TSO & Associates Institutional,
38%
UBS Kyrgyzaltyn
JSC, 32%
April 2016 24Centerra: 2016 Guidance
2016 All-in Sustaining
2016 Gold Production
Costs1
(ounces) (per ounce sold)
Kumtor Mine 480,000 – 530,000 $817 – $902
Centerra 480,000 – 530,000 $877-$968
Projects 2016 Growth Capital1 2016 Sustaining Capital1
(millions) (millions)
Kumtor Mine $26 $84
Öksüt Project $157 -
Greenstone Property $12 -
Corporate and other - $1
Consolidated Total $184 $85
1 Non-GAAP measure, see discussion under “Non-GAAP Measures” in the Company’s MD&A filed on SEDAR.
2 Greenstone growth capital excludes $4.5 million representing capitalized expenditures related to the Greenstone Property.
April 2016 25Centerra: 2016 Expected All-in Costs1
($ per ounce sold) Kumtor Centerra
Operating costs(1) $400-442 $400-442
Changes in inventories (8)-(9) (8)–(9)
Operating costs (1) $392-433 $392-433
Adjusted operating costs(1) $426-471 $426-471
Capitalized stripping costs - cash 230-254 230-254
Capital expenditures (sustaining)(1) 158-174 161-177
Accretion expense (reclamation) 3 4
Corporate general & admin costs - 56-62
All-in sustaining costs $817-902 $877-968
Capital expenditures (growth)(1) 49-54 49-54
Other costs(2) - 39-44
All-in costs (excluding growth projects)(1,3) $866-956 $965-1,066
Revenue-based tax(4) 157 157
All-in costs excluding growth projects
including taxes(1,3,4) $1,023-1,113 $1,122-1,223
1 Non-GAAP measure, see discussion under “Non-GAAP Measures” in the Company’s MD&A filed on SEDAR.
2 Other costs include $14-$16 of Boroo costs for maintaining the mill on care and maintenance and ongoing closure costs, net of gold sales, and global exploration expenses,
business development expenses and project development costs not related to current operations.
3 Excludes Öksüt and Greenstone growth projects.
4 Includes revenue-based tax that reflects a forecasted gold price assumption of $1,125 per ounce sold.
April 2016 26Centerra: Reserves & Resources
Centerra Gold Inc. 2015 Year‐End Gold Reserve and Resource Summary (as of December 31, 2015)
Gold Mineral Reserves (1) (11) (12)
(tonnes and ounces in thousands)
Proven Probable Total Proven and Probable
Property (3) Tonnes Grade Contained Tonnes Grade Contained Tonnes Grade Contained
(g/t) Gold (oz) (g/t) Gold (oz) (g/t) Gold (oz)
Kumtor (5) 8,832 1.4 402 60,406 2.7 5,240 69,239 2.5 5,641
Gatsuurt (7) - - - 17,129 2.9 1,603 17,129 2.9 1,603
Öksüt(10) - - - 26,137 1.4 1,161 26,137 1.4 1,161
Total 8,832 1.4 402 103,672 2.4 8,004 112,505 2.3 8,405
Gold Measured and Indicated Mineral Resources(2) (11) (12)
(tonnes and ounces in thousands)
Measured Indicated Total Measured and Indicated
Property (3) Tonnes Grade Contained Tonnes Grade Contained Tonnes Grade Contained
(g/t) Gold (oz) (g/t) Gold (oz) (g/t) Gold (oz)
Kumtor Open Pit (4) (5) 19,450 2.9 1,787 10,151 2.4 777 29,602 2.7 2,564
Boroo (6) 452 2.2 32 4,464 1.5 210 4,916 1.5 242
Gatsuurt (7) - - - 5,098 2.4 398 5,098 2.4 398
Ulaan Bulag (8) - - - 1,555 1.5 73 1,555 1.5 73
ATO (9) 9,663 1.5 465 8,920 1.1 306 18,583 1.3 771
Öksüt(10) 2,100 0.7 45 4,698 0.7 111 6,798 0.7 156
Total 31,665 2.3 2,329 34,886 1.7 1,875 66,552 2.0 4,204
Gold Inferred Mineral Resources(2) (11) (12) (13)
(tonnes and ounces in thousands)
Property (3) Tonnes Grade Contained
(g/t) Gold (oz)
Kumtor Open Pit (4) (5) 3,894 1.2 148
Kumtor Stockwork Underground (5) 931 11.6 348
Kumtor SB Zone UG (6) 3,806 10.7 1,315
Boroo (6) 7,323 1.0 235
Gatsuurt (7) 5,475 2.5 440
Ulaan Bulag (8) 315 1.3 13
ATO (9) 386 0.6 8
Öksüt (10) 2,380 0.8 65
Total 24,511 3.3 2,573
See footnotes page 27
April 2016 27Centerra: Reserves & Resources
Footnotes for Reserve and Resource Table as of December 31, 2015:
(1) The mineral reserves have been estimated based on a gold price of $1,200 per ounce.
(2) Mineral resources are in addition to reserves. Mineral resources do not have demonstrated economic viability.
(3) Centerra’s equity interests as of this news release are: Kumtor 100%, Gatsuurt 100%, Boroo 100%, Ulaan Bulag 100%, ATO 100%, and Öksüt 100%.
(4) Open pit resources at Kumtor are constrained by a pit shell developed using a gold price of $1,450 per ounce.
(5) The open pit reserves and resources at Kumtor are estimated based on a cut-off grade of 0.85 grams of gold per tonne for the Central Pit and 1.0
grams of gold per tonne for the Southwest and Sarytor deposits. Underground resources occur below the open pit resources shell and are estimated
based on a cut-off grade of 6.0 grams of gold per tonne. Further information concerning the Kumtor deposit, including key assumptions, parameters
and methods used to estimate mineral resources and reserves, as well as, political, environmental and other risks are described in Centerra’s most
recently filed Annual Information Form and the Technical Report on the Kumtor Project, dated March 20, 2015 each of which has been filed on SEDAR.
(6) The open pit resources at Boroo are estimated as all material below the pit above a 0.5 grams of gold per tonne cut-off grade.
(7) The open pit reserves and resources at Gatsuurt are estimated using a 1.4 grams of gold per tonne cut-off grade. Resources are estimated as all
material below the reserve pit above the 1.4 grams per tonne cutoff grade. Further information concerning the Gatsuurt deposit, including key
assumptions, parameters and methods used to estimate mineral resources and reserves, as well as, political, environmental and other risks are
described in Centerra’s most recently filed Annual Information Form and the Technical Report on the Gatsuurt Project, dated May 9, 2006 each of which
has been filed on SEDAR.
(8) The open pit resources at Ulaan Bulag are estimated on a cut-off grade of 0.8, 0.9 or 1.0 grams of gold per tonne depending on ore type and process
method.
(9) The ATO open pit resources are estimated based on a Net Smelter Return (NSR) cut-off grade of $6.50 NSR per tonne for oxide mineralization and
$25.50 NSR per tonne for sulphide mineralization
(10) The open pit reserves at Öksüt are estimated based on a 0.3 grams of gold per tonne cut-off grade. Open pit resources are constrained by a pit shell
developed using a gold price of $1,450 per ounce and are estimated based on a 0.2 grams of gold per tonne cut-off grade. Further information
concerning the Öksüt deposit, including key assumptions, parameters and methods used to estimate mineral resources and reserves, as well as,
political, environmental and other risks are described in Centerra’s most recently filed Annual Information Form and the Technical Report on the Öksüt
Project, dated September 3, 2015 each of which has been filed on SEDAR.
(11) A conversion factor of 31.10348 grams per ounce of gold is used in the reserve and resource estimates.
(12) Numbers may not add up due to rounding.
(13) Inferred mineral resources have a great amount of uncertainty as to their existence and as to whether they can be mined economically. It cannot be
assumed that all or part of the inferred resources will ever be converted to a higher category.
April 2016 28Öksüt: Site Layout April 2016 29
TSX: CG
www.centerragold.com
You can also read