2017 North Texas Regional Bicycle Opinion Survey - Sustainable Development Program Kevin Kokes, AICP

Page created by Andy Black
 
CONTINUE READING
2017 North Texas Regional Bicycle Opinion Survey - Sustainable Development Program Kevin Kokes, AICP
2017 North Texas
Regional
Bicycle Opinion Survey
Sustainable Development Program
Kevin Kokes, AICP

Public Meetings                   April, 2018
2017 North Texas Regional Bicycle Opinion Survey - Sustainable Development Program Kevin Kokes, AICP
North Central
Texas Council of
Governments

MPO for the
Dallas-Fort Worth
Region

                    Metropolitan Planning Area (MPA)
                      12 Counties = 9,441 sq. mi.

                    Urban Counties: Collin, Dallas, Denton, Rockwall and Tarrant
                    Rural Counties: Ellis, Hood, Hunt, Johnson, Kaufman, Parker,
                                         and Wise
                                                                                   2
2017 North Texas Regional Bicycle Opinion Survey - Sustainable Development Program Kevin Kokes, AICP
North Central
Texas Council of
Governments

MPO for the
Dallas-Fort Worth
Region

                    Metropolitan Planning Area (MPA)
                      209 cities
                      13 cities larger than 100,000 pop.

                    MPA Population
                      2017 Estimate = 7.2 million
                      2045 Forecast = 11.2 million         3
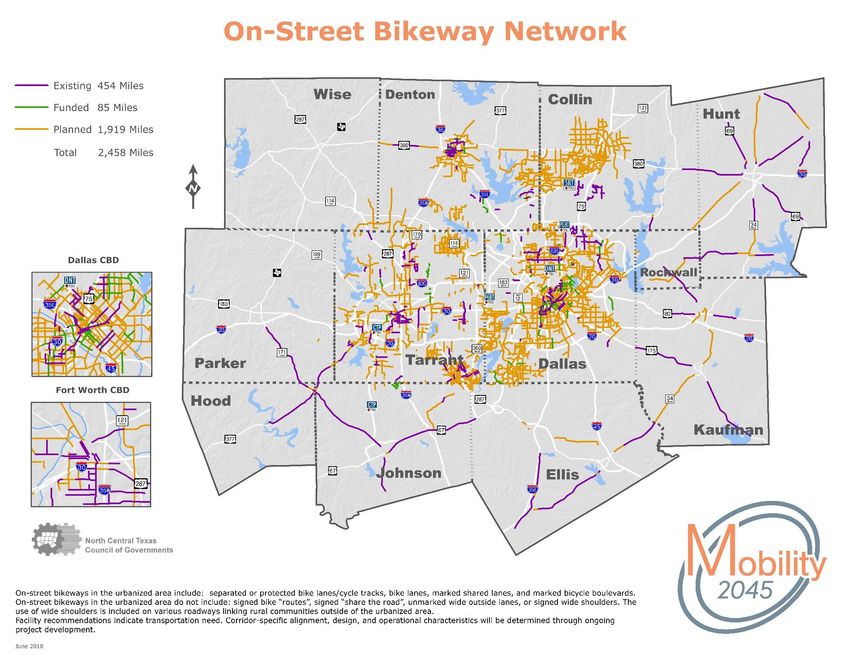
2017 North Texas Regional Bicycle Opinion Survey - Sustainable Development Program Kevin Kokes, AICP
4
2017 North Texas Regional Bicycle Opinion Survey - Sustainable Development Program Kevin Kokes, AICP
5
2017 North Texas Regional Bicycle Opinion Survey - Sustainable Development Program Kevin Kokes, AICP
6
2017 North Texas Regional Bicycle Opinion Survey - Sustainable Development Program Kevin Kokes, AICP
7
2017 North Texas Regional Bicycle Opinion Survey - Sustainable Development Program Kevin Kokes, AICP
8
2017 North Texas Regional Bicycle Opinion Survey - Sustainable Development Program Kevin Kokes, AICP
Bicycle Opinion Survey Background
Statistically Valid Survey Conducted by Telephone
  During the Month of May, 2017

95% Confidence Interval

Conducted in English and Spanish

Survey Area:
  12-County MPA Region (also includes county-level results)

A Total of 1,909 Interviews Conducted with Respondents
 Over the Age of 18

693 (36%) Reported They Had Bicycled in the Last 12 Months
  and 1,216 Reported They Had Not

                                                              9
2017 North Texas Regional Bicycle Opinion Survey - Sustainable Development Program Kevin Kokes, AICP
Bicycle Opinion Survey Background
Questions Captured the General Public’s View on Bicycling,
Includes:

   Frequency of Bicycling

   Access to Bicycling Facilities

   Perceived Barriers to Bicycling

   Level of Comfort
   Helmet Use

                                                             10
Bicycle Opinion Survey Background
Various Questions summarized by:

   County, Gender, Age, Ethnicity, and Income

   Proximity of the Respondent’s Residence
    to Existing Trails and On-Street Bikeways

              Bicyclists
                                Slides are noted if all respondents or
              ALL Respondents   bicyclists only answered the question.   11
Characteristic                Weighted
2017                                                     Data
Bicycle          Sex
Opinion Survey   Females 18+ years of age                     50.8%

Respondent       Males 18+ years of age
                 Age
                                                              49.2%

Demographics     18-34 years of age                           31.8%
                 35-54 years of age                           39.7%
                 55+ years of age                             28.5%

                 Race/Ethnicity
                 White alone                                  53.6%
                 Black alone                                  14.9%
                 Other                                        31.5%

                 Annual Household Income
                 Under $25,000                                13.9%
                 $25,000 to $49,999                           22.1%
                 $50,000 to $74,999                           21.7%
                 $75,000 to $99,999                           14.4%
                 $100,000+                                    27.9%

                                            ALL Respondents           12
Planning / Designing for
Adults
            All Ages & Abilities
                (Ages 8 to 80)

                  Commute

                                 Errands
 Children

                                    Recreation   13
Four Types of Cyclists*
                                            Regional Comparison

                   2%                      2%
                                                                                                Strong & Fearless
100%                                                             6%                   7%        Will ride a bicycle regardless
                  14%                    15%                     9%                   5%        of the roadway conditions. Riding
90%                                                                                             is a strong part of their identity.

80%                                                                                             Enthused & Confident
70%               36%                                                                           Somewhat comfortable sharing
                                         39%                                          51%       the road with vehicle traffic.
60%                                                                                             Prefers dedicated bike facilities.
                                                                60%
50%                                                                                             Interested But Concerned
                                                                                                Like riding a bicycling, and
40%                                                                                             would ride more if they
                                                                                                felt safer on the roadways.
30%
                  48%                    44%                                                    No Way No How
20%                                                                                   37%
                                                                25%                             Not comfortable,
                                                                                                not interested, or not physically
10%
                                                                                                able to ride a bicycle.

 0%
           NCTCOG                   City of                 City of           National Survey
         12 Co. Region             Austin, TX            Portland, OR          (Metro Areas)

                                                                                                                                     14
  *Determined in large part by comfort of cycling on different types of facilities.                ALL Respondents
Four Types of Cyclists*
                                          Within North Texas Region

100%        2%         2%            3%         2%          2%          1%            2%      2%      Strong & Fearless
          14%          14%         10%                     15%         13%            14%     14%     Will ride a bicycle regardless
90%                                            17%
                                                                                                      of the roadway conditions. Riding
                                                                                                      is a strong part of their identity.
80%
                                   29%                                                                Enthused & Confident
70%                                                                    33%
          36%          38%                     34%                                    37%     39%     Somewhat comfortable sharing
                                                           42%
60%                                                                                                   the road with vehicle traffic.
                                                                                                      Prefers dedicated bike facilities.
50%
                                                                                                      Interested But Concerned
40%                                                                                                   Like riding a bicycling, and
                                                                                                      would ride more if they
                                   59%                                                                felt safer on the roadways.
30%
                                                                       54%
          48%          47%                     47%                                    48%     49%
20%
                                                           42%                                        No Way No How
                                                                                                      Not comfortable,
10%                                                                                                   not interested, or not physically
                                                                                                      able to ride a bicycle.
 0%
       NCTCOG       Urban       Rural         Collin     Dallas      Denton     Rockwall    Tarrant
        12 Co.     Counties    Counties      County      County      County      County     County
        Region

  *Determined in large part by comfort of cycling on different types of facilities.                      ALL Respondents                    15
Frequency of Bicycling

                         16
In the past 12 months …

                                                          Of ALL Respondents
                                                          Bicycled at Least Once

Percent of bicyclists who rode
at least once during the
season.

      95%                          84%                     85%                  47%

  Mar, Apr, May                  Jun, Jul, Aug          Sep, Oct, Nov        Dec, Jan, Feb
              Bicyclists                   Bicyclists           Bicyclists             Bicyclists

                                                                                                17
Of Bicyclists who Rode in the Past Month…

                                 to Work,
                                 School, or
    for Fun or Exercise          Shopping

                                      Bicyclists   18
Frequency of Bicycling
I would like to travel more by bike more than I do now.

                       Strongly                   Strongly
                        Agree                     Disagree
                         30%                        31%

                         Somewhat                Somewhat
                           Agree                  Disagree
                            25%                     14%

                                                ALL Respondents   19
Frequency of Bicycling
                           I would like to travel more by bike more than I do now.
                      NCTCOG REGION                                             55%
                     RURAL COUNTIES                                     48%
                     URBAN COUNTIES                                           56%
                      COLLIN COUNTY                                           54%
                      DALLAS COUNTY                                                 60%
                     DENTON COUNTY                                      48%
                  ROCKWALL COUNTY                                             53%
                    TARRANT COUNTY                                            54%
                           18-24 YEARS                                                64%
                           25-34 YEARS                                               61%         Percent of ALL
                           35-44 YEARS                                               63%        Respondents who
                           45-54 YEARS                                    52%                    agree that they
                           55-64 YEARS                                    50%                   would like to bike
                             65+ YEARS                           35%                             more than they
                                  MALE                                      55%
                                                                                                  currently do.
                               FEMALE                                       55%
                  HISPANIC OR LATINO                                          59%
            AFRICAN AMERICAN / BLACK                                      50%
                   CAUCASIAN / WHITE                                          54%
                                 ASIAN                                                63%
                                 OTHER                                         57%
                        UNDER $25,000                                    50%
                      $25,000 - $49,999                                             61%
                      $50,000 - $74,999                                   52%
                      $75,000 - $99,999                                             60%
                    $100,000 OR MORE                                          54%
ALL Respondents                           0%   10%   20%   30%    40%   50%     60%       70%     80%   90%   100%
Obstacles to Bicycling More Often
     Do any of the following prevent you from riding a bike more often than you currently do?

                                       WEATHER IS TOO HOT                                 64%

                             LACK OF SECURE BIKE PARKING                            54%          Lack of bicycle
                                                                                                 facilities are
   BIKING LANES, TRAILS, AND PATHS ARE NOT CONNECTED                                53%
                                                                                                 among the top
NO SHOWERS OR PLACE TO FRESHEN UP AT MY DESTINATION                                49%
                                                                                                 barriers to
    BIKING LANES, TRAILS, AND PATHS ARE NOT AVAILABLE                              48%           bicycling more.
                                DESTINATIONS ARE TOO FAR                           48%

                                         I DON'T OWN A BIKE                  37%

                                IT DOESN'T FIT MY LIFESTYLE                  37%

                                         IT TAKES TOO LONG                  35%

                                          I DO NOT FEEL SAFE               34%

                                      WEATHER IS TOO COLD              27%

              EXISTING BIKEWAYS ARE IN POOR CONDITION                 24%

                                 I AM NOT PHYSICALLY ABLE            23%

            MY BIKE IS NOT IN GOOD WORKING CONDITION                 20%

                                                                0%   25%          50%      75%     100%

          Percent of all respondents indicating each is a barrier.                                                 21
Proximity and Availability of Bicycle Facilities

                                                   22
Proximity to a Bicycle Facility
                         Influences Bicycle Use

                                                     Who Lived MORE THAN
              Who Lived LESS THAN
                                                    Half-Mile of a Trail or Bikeway
            Half-Mile of a Trail or Bikeway

                                              Half-Mile
Half-Mile

                    Home
                                                           Home

                                                                                      23
Proximity to a Bicycle Facility
              Influences Bicycle Use
                        Percent of ALL Respondents
                            Who Rode a Bicycle
                             in Last 12 Months
                       Within Half Mile    NOT within Half Mile

                                                                  50%
45%                               45%

              34%                                 35%                         36%

Any Bicycle Facility                      Trail                   On-Street Bikeway

                                                                                      24
Availability of Bicycle Facilities
Do you think there are too many, about the right amount, or too few in your community?

                    Percent of ALL Respondents rating as “TOO FEW”

                        BICYCLE PARKING                                     75%

       DEDICATED ON-STREET BIKE LANES                                      73%

              BICYCLE-FRIENDLY STREETS                                63%

  OFF-STREET BICYCLE PATHS AND TRAILS                                 62%

                                          0%        25%       50%        75%       100%

                                                                                          25
                                                                 ALL Respondents
Availability of Bicycle Facilities                                   By Proximity
       Do you think there are too many, about the right amount, or too few in your community?

                             Percent Rating the Amount or Availability
                          of the Different Types of Facilities for Bicyclists
                                           as “TOO FEW"

       TOO FEW                             TOO FEW                                 TOO FEW
       Off-Street                          On-Street                                 Bicycle
Bicycle Paths and Trails              Dedicated Bike Lanes                      Friendly Streets

               Who live                                 Who live                            Who live
             MORE THAN                                MORE THAN                           MORE THAN
               ½ -Mile                                  ½ -Mile                             ½ -Mile

                                                                                     ALL Respondents   26
Importance of Improving Bicycle Access
        How important, if at all, do you feel it is for your community to do each of the following?

                                             Percent of ALL respondents
                                  rating as “ESSENTIAL" or “VERY IMPORTANT"

  PROVIDING TRAFFIC SIGNALS OR CROSSING BEACONS AT
   INTERSECTIONS AND CROSSINGS TO WARN DRIVERS OF
        BIKE AND TRAIL USERS CROSSING THE ROAD
                                                                                            72%

  PROVIDING BIKE LANES SEPARATED FROM VEHICLES SO
 BIKES AND CARS DO NOT HAVE TO SHARE THE SAME LANE                                         70%

    PROVIDING BIKE TRAILS SEPARATED FROM ROADWAYS                                   56%
 LOWERING TRAFFIC SPEEDS ON COMMUNITY ROADWAYS
TO THE IMPROVE SAFETY OF PEDESTRIANS AND BICYCLISTS
                 SHARING THE ROAD
                                                                                 50%
                                                      0%      20%        40%       60%        80%      100%

                                                                                          ALL Respondents     28
Level of Comfort and Helmet Use

                                  29
Level of Comfort
                           How Comfortable Are you Riding a Bike on the following?
        Percent of ALL respondents reporting they would feel “VERY COMFORTABLE” or “SOMEWHAT COMFORTABLE”

                 A PATH OR TRAIL
        THAT IS SEPARATED FROM A STREET                                      85%

    A MAJOR STREET WITH TWO OR THREE
 TRAFFIC LANES IN EACH DIRECTION, TRAFFIC
  SPEEDS OF 35 TO 40 MILES PER HOUR, AND         9%
               NO BIKE LANE

                THE SAME STREET
         WITH A STRIPED BIKE LANE ADDED                           60%

 WHAT IF IT ALSO HAD A WIDE BICYCLE LANE
  SEPARATED FROM TRAFFIC BY A RAISED
                  CURB
                                                                          78%

ALL Respondents                             0%    25%       50%        75%      100%
Frequency of Wearing A Helmet

Of the bicyclists who rode
in the past year…                                 Always or almost always

                                                            42.8%

                  About 75% of the time
                                           2.0%
                  About half of the time   5.5%

                  About 25% of the time    7.5%

                                                              42.3%

                                                           Never

                                                                        Bicyclist   31
Key Findings
• About one-third, 36%, of all respondents had bicycled
  at least once in the past 12 months.
• 55% of all respondents would like to bike more.
• Spring was the most popular time of year for bicycling
  while winter was the least.
• In the past month, 13% of all respondents bicycled for
  transportation and 26% bicycled for recreation.
• Hot weather and the lack of bicycle facilities were the top
  obstacles to bicycling more.
• The closer respondents lived to bicycle facilities
  the more likely they were to report riding a bicycle.
                                                            32
Key Findings Continued
• A majority of respondents indicated that there are “too
  few” bicycle facilities in their communities.
• They also considered improvements to increase bicycle
  access to be “essential” or “very important” for their
  community.
• The type of bike facility design, location, and traffic
  volumes were significant influences on respondents’
  level of comfort bicycling.
• About 58% of bicycle riders said they wear a helmet at
  least some of the time, but usage varies by age of rider.

                                                              33
2017 NCTCOG
      Regional Bicycle Opinion Survey Results

Bicycle Opinion Survey Website:
nctcog.org/bikesurvey

  -   Key Findings
  -   Executive Summary
  -   Final Report
  -   Presentation Slides
        and Graphics

                                                34
North Central
Texas Council of
Governments
                                                                  Contact Information

                                                                   Karla Weaver, AICP
                                                                  Sustainable Development
                                                                  Senior Program Manager
                                                                    kweaver@nctcog.org
                                                                       817-608-2376

                                                                    Kevin Kokes, AICP
                                                              Principal Transportation Planner
                                                                    kkokes@nctcog.org
                                                                       817-695-9275

                       Daniel Snyder                Gabriel Ortiz                    Jessica Scott
                   Transportation Planner II   Transportation Planner II       Transportation Planner II
                     dsnyder@nctcog.org           gortiz@nctcog.org               jscott@nctcog.org
                        817-608-2394                817-695-9259                    682-433-0460

                                                                                                           35
You can also read