USE OF STANDARDIZED TESTS IN BRAZILIAN BASIC EDUCATION - JOSÉ FRANCISCO SOARES President of INEP - National Institute for Educational Studies and ...
←
→
Page content transcription
If your browser does not render page correctly, please read the page content below
USE OF STANDARDIZED TESTS IN
     BRAZILIAN BASIC EDUCATION

JOSÉ FRANCISCO SOARES
President of INEP – National Institute for Educational Studies and Research Anísio Teixeira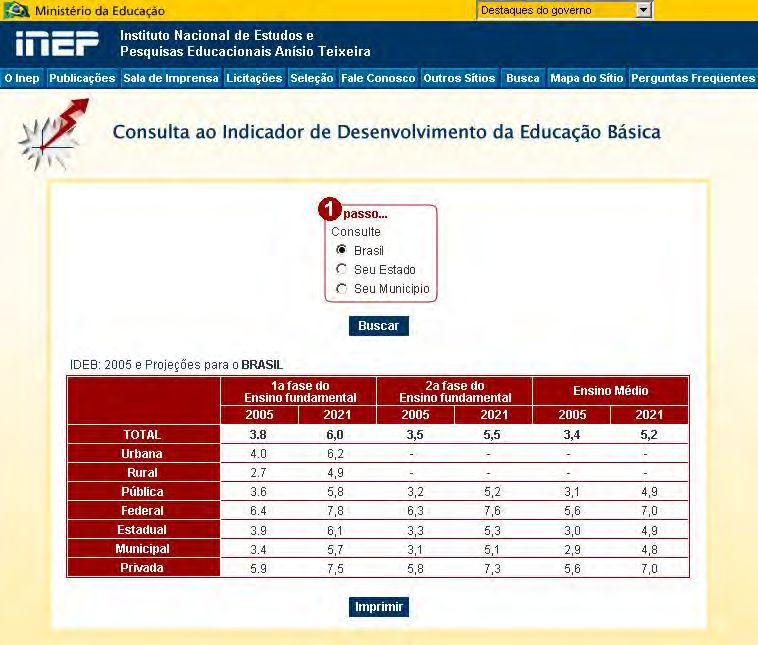
ABSTRACT

•   Major standardized tests used in Brazil.

•   Uses of these tests.

•   The IDEB – Index of Basic Education Development.

•   Critical Reading of IDEB.

•   My contributions.
MAJOR STANDARDIZED TESTS USED
          IN BRAZIL
ANA
            (NATIONAL LITERACY ASSESSMENT)

•   Objective: To measure the students ’ level of literacy in
    Reading, Mathematics and Writing.

•   Target population: All students enrolled in the 3rd grade of
    primary school (8-year-olds) in public schools.

•   Test: Multiple choice and production of a small text.

•   Frequency: Every year. The first edition took place in 2013.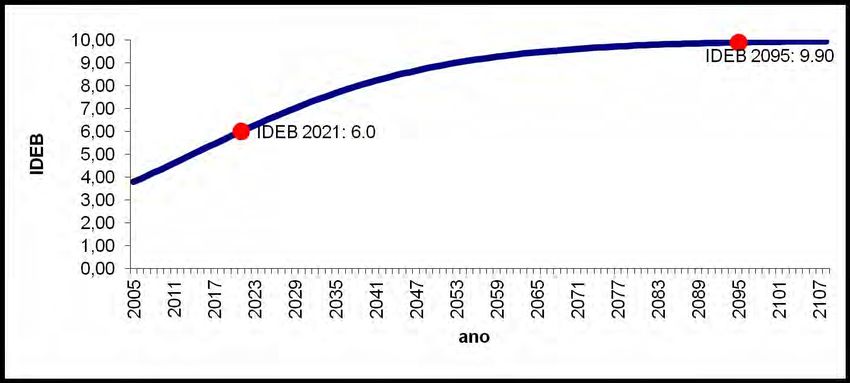
PROVA BRASIL – SAEB
(NATIONAL SYSTEM OF BASIC EDUCATION ASSESSMENT)
  •   Objective: To measure the level of knowledge of the common national
      core in Reading, Mathematics and Science (from 2013). To monitor the
      right to learn, as the concrete expression of the right to education.

  •   Target population: All public schools students enrolled in 5th and 9th grades
      of primary and lower secondary school (10 and 14-year-olds) and a sample
      or private schools students.

  •   Test: Multiple choice, BIB - 55 items in grade 9 and 44 in grade 5. Common
      items between different cycles and between school years.

  •   Frequency: Every two years. The first edition took place in 1995.
ENEM
(NATIONAL EXAM OF SECONDARY EDUCATION)
• Objective: Selection of students for higher education (public and private
institutions). Selection of students for various government programs, such as
Prouni (University for All Program) and FIES (Student Financing Fund).
• Tests: Languages, Mathematics, Natural Sciences, Humanities and Writing.
45 items and a essay.
• Target population: 8,700,000 candidates this year. Students graduating from
high school and those that have already graduated in previous years;
people in search of a high school certificate; and trainees.USE OF TEST RESULTS
QUALITY OF EDUCATION INDICATORS

•   Quality of Education: Concrete learning results that qualify the
    students for active citizenship. The difference between results
    from different social groups should be small.

•   In Brazil, excellence for a few cannot be called quality.
QUALITY DIMENSIONS
• Trajectory: age-grade gap, net enrollment rate, school life
expectancy.
• Learning outcomes: numerical synthesis of the distribution of
proficiencies in Prova Brasil.
IDEB FLOW LEARNINGMEASUREMENT
Two types of results: Students´ schooling trajectory and Learning
• Trajectory uses flow data, collected by the annual School Census
• Learning results measured by the national tests.
•Distribution of the results: high mean, small variation
• Inequality
related to flow and learning of different social groups.
• Correlation between an indicator of socioeconomic status and the results (?)EDUCATIONAL RESEARCH
• Many sociological studies have been conducted based on
data from the Prova Brasil.
• Educational policies are now analyzed in their capacity to
produce concrete results.
• More pedagogical-based research is still necessary.
• How should we teach the students we have?
• How to train the teachers we have?IDEB – INDEX OF BASIC EDUCATION
DEVELOPMENTIDEB
IDEB j N j Pj
• Indicator obtained by multiplying the performance – N,
measured by the average student proficiency in Prova
Brasil/SAEB, by the average promotion rate at each school
grade, obtained from the School Census.IDEB – NUMERATOR
SAEB 2005 4th grade (Primary)
State Standardized Standardized
Mathematics Portuguese grade in grade in
Mathematics Portuguese
Minas Gerais 200.16 183.30 5.36 4.89IDEB – DENOMINATOR
Grade - Years
0 1 2 3 4
Promotion rate 82.4 79.1 78.4 97.1 88.4
Promotion rate in decimals 0.824 0.791 0.784 0.971 0.884
Years of schooling required 1.21 1.26 1.28 1.03 1.13
Academic years of study to complete the stage (1.21 1.26 1.28 1.03 1.13) 5.91
5
Performanc e indicator 0.8453
5.91IDEB CALCULATION
N = standardized
P IDEB = N x P
mean score
Minas Gerais 0.84 5.12 4.3DIFFERENCES BETWEEN BRAZILIAN STUDENTS’
PERFORMANCE AND THE OECD AVERAGE IN
MATHEMATICS IN PISA 2003
Score of
Difference between
Brazilian Score of OECD Difference in standard
Percentile OECD and Brazilian
students in students in PISA deviations
students
PISA
5 223 361 138 1.35
15 266 417 151 1.47
30 307 465 158 1.54
50 354 514 160 1.57
75 419 576 157 1.53
90 481 626 145 1.41
95 523 654 131 1.29REFERENCE DISTRIBUTION IN THE SAEB METRICS FOR BRAZILIAN
EIGHTH GRADERS IN MATHEMATICS
Percentiles of the Difference in standard Percentiles in the ideal
Percentile
current distribution deviations distribution
5 170 1.35 238
15 192 1.47 266
30 223 1.54 300
50 242 1.57 320
75 278 1.53 355
90 316 1.41 387
95 341 1.29 405PERFORMANCE OF THE EIGHTH GRADERS WHO TOOK THE
2003 SAEB IN MATHS AND IDEAL PERFORMANCEIDEB PROJECTION
• Information necessary to design the trajectory of IDEB for Brazil
• Initial IDEB (IDEB2005)
• Goal (IDEB2021)
• Time to reach the goal in years(16 years)ILLUSTRATIVE CHART OF THE
PROJECTION OF IDEB
10
9
8
IDEB2021
7
6
5 IDEB2005
4 Effort required
3
Time
2
1
0
1 3 5 7 9 11 13 15 17 19 21 23 25 27 29 31 33 35 37 39 41 43 45 47 49PROJECTED IDEB GOALS FOR STATE
AND DISTRICTS AND SCHOOLS
• It is assumed that at the end of this century there will be no
IDEB difference either between school districts or schools.
• “A methodological mirage”.PROJECTIONS FOR BRAZIL
4TH GRADE OF ELEMENTARY SCHOOL
-IDEB2005 Brasil = 3,8
Effort = ?
-Goal Brazil 2021 = 6
-Time to goal in years = 16 Convergence time= ?
Effort:0.056
years to convergencePROJECTION FOR DISTRICTS
BASED ON THE CONVERGENCE TIME OF THE COUNTRY - 4TH
GRADE OF ELEMENTARY SCHOOL IN BAHIA STATE (BA)
-IDEB2005 BA = 2.7
Effort = ?
-Goal BA = 9.9
Goal BA 2021 = ?
-Time to goal = Convergence = 91
10.00 Effort:0.06161
9.00 IDEB 2095: 9.90
8.00
7.00
6.00 IDEB2021:
IDEB 2021:6.0
5.0
IDEB
5.00
4.00 years to convergence
3.00
2.00
1.00
0.00
2005
2011
2017
2023
2029
2035
2041
2047
2053
2059
2065
2071
2077
2083
2089
2095
2101
2107
anoREDUCTION OF INEQUALITY
10
9
8 IDEB_2: 6.8
7
6 IDEB BR: 6.0
IDEB
5
4 IDEB_1: 5.0
3
2
1
0
2020
2025
2030
2035
2040
2045
2050
2005
2010
2015
2055
2060
2065
2070
2075
2080
2085
2090
2095
ano
Brasil Estado 1 Estado 2IDEB 2005 AND PROJECTION FOR 2021
Lower Secondary Upper Secondary
Primary Education
Education School
2005* 2021 2005* 2021 2005* 2021
Total 3.8 6.0 3.5 5.5 3.4 5.2
Urban 4.0 6.2 - - - -
Rural 2.7 4.9 - - - -
Public 3.6 5.8 3.2 5.2 3.1 4.9
Federal 6.4 7.8 6.3 7.6 5.6 7.0
State 3.9 6.1 3.3 5.3 3.0 4.9
Municipal 3.4 5.7 3.1 5.1 2.9 4.8
Private 5.9 7.5 5.8 7.3 5.6 7.0
(*) Saeb 2005 data
• As the evolution of quality is related to generations, the goal 6 is related to the
generation that will begin their school life in 2017, will arrive at grade 5 in 2021, at
grade 9 in 2025 and at the last grade of high school in 2028. For this reason, the
2021 goals are not equal 6 for the last two phases.CRITICAL READING OF IDEB
FACTS ABOUT IDEB

•   The creation of IDEB put student learning at the center of the
    Brazilian educational debate.

•   The new National Education Plan choose the IDEB as the indicator to
    monitor the improvement of the Brazilian basic education.

•   IDEB is a weak accountability system, as there are no sanctions.

•   The IDEB is closely associated with the socioeconomic status.
BIPOLARITY OF THE CRITICISM
• There are a number of critics who advocate the abolition of all external assessments.
They advocate that the money spent in evaluations should be used elsewhere. Only
teachers are legitimate to assess their students. In their words, the assessment system is,
at best, useless and, at worst, harmful to education.
• Another group of critics believe that the measurement of educational results is
absolutely central and the right incentives, based on these measurements, are enough
for education to improve. IDEB should be shown at the door entry of each and every
school.
• Important to note that these two positions are present in all national political parties.MY REFLECTIONS AND / OR
CONTRIBUTIONS• We do not make evaluations, we measure performance.
• A constitutional right that is not monitored is not yet a right. It is a dream.
• When there are millions of students their performance must be measured in
order to be monitored.
• In a country that take inequalities as something natural, a public register of
students' learning is an important public policy.• A national common core is strategic. Tests should be based on it.
• Results of performance assessments must be contextualized through the
indicators of Student and School SES, Teacher Training, Infrastructure, Money
spent per student etc..
• Tests pedagogical relevance should be pursued with much more
vigor. Show teachers what the evaluation numbers mean through
• Map of items, Curricular commentary and empirical behavior of
items.
• We spend very little money, time and brain in this important activity.Thank you. Muchas gracias. Obrigado. chico.soares@inep.gov.br
You can also read