2017 WISHLIST INFRASTRUCTURE NEW ZEALAND'S - AI IN CONSTRUCTION
←
→
Page content transcription
If your browser does not render page correctly, please read the page content below

YEARBOOK 2017 • VOLUME 7 NO 1

          INFRASTRUCTURE
           NEW ZEALAND'S
     2017         WISHLIST
                                                                       PROPERTYANDBUILD.COM

AI IN CONSTRUCTION
                                                                       INFRASTRUCTUREBUILD.COM

Benefits and implications

ROUGH RIDE AHEAD
FOR PETROL POWER
Vehicle revolution changing fuel mix
Infrastructure New Zealand membership
provides you with the opportunity to connect and
contribute with leaders in the infrastructure sector,
and keep pace with the latest developments and thinking,
nationally and globally.

What our member’s say they value most from their
membership:

   Infrastructure New Zealand’s in-depth and focused
   analysis of current infrastructure issues
   Networking opportunities
   Ability to position their organisation among
   infrastructure leaders
   To contribute positively to New Zealand’s long
   term development
   Opportunity to raise the profile of their organisation
   Professional and personal development opportunities

                                Join Us
                                09 377 5570
                                infrastructure.org.nz
TOTAL PACKAGE: a fully integrated
                                                     planning, governance, funding,
                                                     regulation, delivery and resource
                                                     management system more
                                                     responsive to change is needed,
                                                     says Infrastructure New Zealand
                                                     CEO Stephen Selwood

                                                                                                                                                             FIRST WORD
New Zealand’s infrastructure
priorities for 2017
Responding to Auckland’s growth challenge and fixing planning legislation and
local government funding and structures are the top infrastructure priorities for
New Zealand in 2017, says Infrastructure New Zealand CEO Stephen Selwood

“Congestion in Auckland is              Selwood says the East West Link                                               government’s ability to deliver the
disproportionate to the city’s        is essential to enabling movement                                               infrastructure needed to support
size and is rapidly deteriorating,”   between State Highways 1 and             “A first principles                    regional development and growth.
he notes. “Of greatest concern,       20 and fixing congested access           review of our                            “A freshly elected parliament in
travel times along the State          into and out of Auckland’s premier                                              2017 provides an opportunity to
                                                                               governance, funding
Highway 1 motorway corridor           industrial zone.                                                                undertake a first principles review
have increased by 30 per cent in        “When the Waterview Connec-            and institutional                      of our infrastructure and local gov-
just the last three years and are     tion comes on early next year, it        structures should                      ernment, planning, governance and
projected to get much worse."         will be vital for resilience and effi-   be a priority for                      funding arrangements nationwide,”
  Earlier this year Infrastructure    ciency of the network that traffic       the newly elected                      Selwood maintains.
New Zealand produced a video of       can move between the two key                                                      He believes what’s needed
the already unacceptable state        corridors as easily as possible,”
                                                                               government in 2017”                    is a “fully integrated planning,
of congestion.                        he insists.                                                                     governance, funding, regulation,
  “Major works underway on              “But we mustn’t forget that                                                   delivery, and resource manage-
the Central Rail Link and motor-      efforts to deliver on Auckland’s                                                ment system that is much more
ways must continue at pace and        transport priorities can only be                                                responsive to change”, which will
the next tranche of projects to       successful if we have an aligned           “Infrastructure New Zealand          drive regional social and economic
deal with 50,000 more people          growth plan which focuses                favours capturing value created by     development, improve environ-
per annum brought to market,”         development in areas where the           public investment in infrastructure    mental outcomes and strengthen
he maintains.                         transport system can accommo-            and putting tolling in place to both   local democracy and community
  Chief among these is the East       date it.                                 raise funds and manage demand,”        engagement.
West Link. “The Onehunga Penrose        Guest speaker at Infrastruc-           Selwood says. “These are among           “This will require much more than
manufacturing and industrial zone     ture New Zealand’s Annual                options that need to be explored       constant tinkering with existing
employs approximately 68,000          General Meeting, Deputy Mayor            sooner rather than later.”             legislative, governance and fund-
people and contributes $4.6 billion   Bill Cashmore, highlighted the             Beyond Auckland, he believes         ing systems,” Selwood admits.
a year to New Zealand’s economy,      financial constraints facing the         “fragmented and unnecessarily            “A first principles review of our
but the current transport             city and how these are impacting         complex governance structures,         governance, funding and insti-
connections into and through          the ability to fund the transport        complicated and disintegrated          tutional structures should be
the area are either incomplete or     investment needed to support             planning laws and insufficient         a priority for the newly elected
highly congested.”                    Auckland’s growth.                       funding” are frustrating local         government in 2017.”

                                                                                                                INFRASTRUCTUREBUILD.COM YEARBOOK 2017   3
Autonomous Vehicles pg 9

           Cover stories                                          Security
           First Word – The Auckland challenge,                    The vexing question of managing risk
                                                                                                                          Check out the following
CONTENTS

           planning legislation and local                          in a local government environment
           government funding top priorities for                   thrown into stark relief by the                        Best of the Best
           2017                                 3                 Kaikoura quake                 24-25                  AsiaPacific Infrastructure
           On the surface 2016 showed
                                                                                                                          articles of 2016 at
           significant steps in infrastructure but
                                                                   Transport                                             infrastructurebuild.com
           dig a little deeper and a year of much                  Autonomous vehicles are a future fact
           less progress emerges – Stephen                         of life but how they are used is the key               Cities: Nelson Street Cycleway
           Selwood Infrastructure NZ         22-23                to their success or failure – Praveen                  Communication: Local
                                                                   Thakur KPMG                          6-8              telecommunications world-class
           Energy                                                 Electric Vehicles may become popular                   Construction: Isaac
                                                                                                                          Theatre rebuild project
           Natural gas and zero-carbon fuels are                   much faster than expected fuel
                                                                                                                          Energy: Petroleum
           expected to satify 60 per cent of the                   distributor Z has produced a report on
                                                                                                                          Conference report
           rise in global energy demand by 2035 –                  the issue                        9-12
                                                                                                                          Environment: Urgent
           Wood Mckenzie                      13
                                                                                                                          action needed to keep
                                                                   Water                                                 the temperature down
           Management                                             Hawkes Bay District Council sets the                   Local government:
           Pipeline forecasts will drive better                    standard for efficient and economic                    Evolution or revolution
           procurement planning for clients and                    water supply for small towns  19-20                   Training & Management:
           suppliers – Caroline Boot Plan A &                                                                             Tips and tricks to avoid
                                                                   Kaikoura quake a sharp reminder of the                 tender template traps
           Clever Buying                     14-17
                                                                   need for greater pipeline resilience
                                                                                                                          Transport: Electric vehicles
                                                                                                     20-21
                                                                                                                          Water: Getting and
                                                                   Bayer spend $3 million on new water                    keeping it clean
                                                                   treatment station                  21

           Editor                          Art Director                    Managing partner               Printed by                        Subscriptions
           Geoff Picken                    Lewis Hurst                     Phil Pilbrow                   Crucial Colour                    Digital editions free to
           021 2 507 559                   lewis@hcreative.co.nz           027 564 7778, 09 489 8663      24 Fairfax Avenue, Penrose,       qualified readers.
           geoff@infrastructurebuild.com   021 14 66 404                   phil@infrastructurebuild.com   Auckland +64 9 589 1550           Annual subscription print edition
           Associate Editor                Web development                 Publisher                      Published by                      $39 Overseas rates – see online
           Steve Best                      Neo Chen                        Mike Bishara                   Media Solutions Ltd
           027 510 0241                    neosync@icloud.com              027 564 7779                   3c, 12 Tamariki Ave, Orewa 0931   www.infrastructurebuild.com
                                                                           mike@infrastructurebuild.com   PO Box 503, Whangaparoa 0943
                                                                                                          09 444 5140, 09 489 8663          www.propertyandbuild.com

           4    YEARBOOK 2017 INFRASTRUCTUREBUILD.COM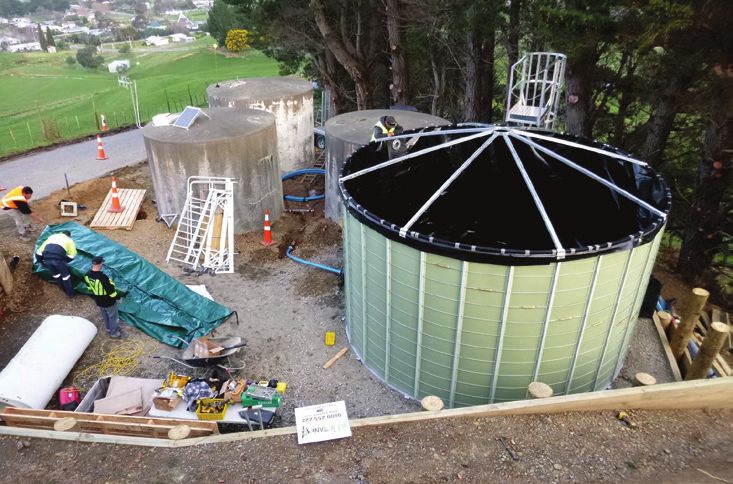
Future cities pg 40

                                                                                                                                                                                                                                                   CONTENTS
Cover Story                                                                         Construction                                                                        Property
The need to have an established                                                      The potential efficiencies of new                                                    Corporates reap benefits of shared
workplace recovery programme                                                         technologies could lead to further                                                   office space paying for what they need
is greater than ever in the face of                                                  growth for a booming construction                                                    and only when they need it – JLL 28-29
unpredictable natural disaster and                                                   sector – Brian Clayton & Bruce
                                                                                                                                                                          Flexibility and global connectivity drive
terrorist attacks – Regus        27-28                                              McClintock Chapman Tripp        32-33
                                                                                                                                                                          office leasing solutions – Regus 29-30

Cities                                                                              Engineering                                                                         Whatever happened to New Zealand’s
                                                                                                                                                                          great rock venues – Bayleys Realty
Legislation, planning and funding for                                                Government restoring Kaikoura coastal
                                                                                                                                                                          Group45-46
infrastructure is needed to encourage                                                route and Wellington buildings subject
world class property development –                                                   to new targeted checks for public
Connal Townsend Property Council NZ                                                  safety – IPENZ SESOC NZSEE 38-39
                                                                                                                                                                          Relocation
                                40-41                                                                                                                                    Having the right building in the right

Megacities, innovator and observer
                                                                                     Local Government                                                                    location is part of the puzzle but
                                                                                                                                                                          putting a deal together than works for
cities of C40 rise to the Paris                                                      Review of 2016 shows the regulatory
                                                                                                                                                                          both parties makes the difference
Agreement challenge to ensure                                                        and legislative burden on local
                                                                                                                                                                          – PFI                              36-37
sustainable cities and economic                                                      government imposes unnecessary
growth – Arup & C40 Group      42-44                                                costs on local communities and new
                                                                                     national council confirmed – Lawrence
Compliance & legal                                                                  Yule Local Government NZ       34-36
Industry insured losses from
earthquakes may reach $5.3 billion
– Air Worldwide                   38

Supporters
Autonomous Vehicles Asia������������ 7                       Iplex Pipelines������������������������������������26              Procurement & Contract                                     Street Lighting
Chapman Tripp ����������������������������������31           Kliptank ������������������������������������������������19        Management Summit ��������������������16                  Conference 2017������������������������������ 8
Clever Buying��������������������������������������17        New Zealand Red Cross����������������47                            Quest Apartment Hotels��������������48                    Sub Surface Detection������������������25
DiveCo��������������������������������������������������21   PFI ����������������������������������������������������������37   Regus�������������������������������������������� 29-30   Thrifty Car Rental������������������������������12
Infrastructure New Zealand ���������� 2                      Plan A����������������������������������������������������15       Skyscrapers Asia Summit������������39
www.infrastructurebuild.com www.propertyandbuild.com Free access to searchable archives in key categories such as Local Government, Construction, Cities, Energy,
Environment, Transport, Water, Communication, Property Development, Investment & Policy, Training & Management, Technology and Innovation. Free online access to daily
news features, case studies and events. Original material may be reproduced with permission and acknowledgement. mike@infrastructurebuild.com
ISSN 2324-3163 (Print) ISSN 2324-3171 (Online)

                                                                                                                                                                                         PROPERTYANDBUILD.COM YEARBOOK 2017                  5
Road to nowhere or nirvana?
                           Autonomous electric vehicles are no longer a science fiction and cities such as
                                  Auckland have two choices, according to Praveen Thakur
TRANSPORT

            Two divergent futures await
            within 10-15 years when
                                                  Scenario one: A recipe for gridlock
            autonomous electric vehicles          The introduction of autonomous           to use cars. This will lead to an       In the future, with rooftop solar
            become the primary form of            vehicles with a continuation of the      increase in the number of             and battery storage the cost
            city transport:                       current norm of private car own-         trips taken.                          of running electric vehicles will
            • a scenario with privately           ership is expected to significantly                                            reduce even further.
              owned autonomous vehicles           worsen congestion.                       Longer car trips
              would significantly exacerbate        KPMG analysis of this scenario         Today, long driving trips are         More car travel in inner areas
              congestion in our cities            estimated a 29 per cent increase         associated with fatigue, boredom      Today, the cost and hassle of park-
            • in contrast, the introduction       in average trip time and 23 per          and frustration. With autonomous      ing is a significant disincentive to
              of autonomous ride-sourcing         cent increase in person kilometres       vehicles, people will be able to      driving to inner city locations in our
              has the potential to ease           travelled in car.                        sleep, read, work, watch movies or    major cities.
              the burden of congestion.             This will lead to a significant        television or relax as they travel.     With autonomous vehicles, this
              KPMG utilised its proprietary       increase in demand for road infra-         As a result, people will accept     disincentive no longer exists. This
            Land Use and Transport Interac-       structure and significantly worsen       longer travel times, particularly     will mean more road congestion
            tion (LUTI) model and applied it      the level of congestion.                 on freeways where the ride will be    in inner areas at the expense of
            to Melbourne as a case study of         The reason for this is simple:         smooth and comfortable.               public transport and active modes.
            the urban form/spatial impacts of     autonomous electric vehicles will          Lower vehicle operating costs         An autonomous vehicle will drop
            self-driving autonomous vehicles.     make car travel cheaper, easier          will further encourage long-          you exactly at your destination,
              The analysis considered             and more convenient, which will          distance travel. Electric vehicles    saving time to find a parking spot
            multiple scenarios related to         lead to more and longer car trips,       are far cheaper to run and maintain   and walk to the destination.
            autonomous vehicles on a              and more car travel.                     than petrol vehicles.                   The vehicle will drive to a
            weekday morning peak period in                                                   Even today, running an electric     cheaper parking area, or even
            2046 and compared them to a           More car trips                           vehicle in Australia is estimated     better, service fare-paying
            business-as-usual scenario.           Today, only adults with a valid          to be 56 per cent cheaper than a      passengers, earning money for the
              A scenario with private             driver license and access to a           petrol vehicle.                       vehicle owner.
            autonomous vehicles showed            car can operate vehicles. Others
            an increase in urban sprawl,          must rely on lifts from family and
            while a scenario with mass            friends, public transport, walking       “Autonomous ride sourcing will contribute
            take-up of autonomous ride            and cycling.
            sourcing showed an increase in          With autonomous electric
                                                                                           to a seven per cent reduction in average trip
            population density in inner and       vehicles, this barrier to driving will   time and nine per cent reduction in person
            middle-ring areas.                    no longer exist. Anyone will be able     kilometres travelled by car”
            6   YEARBOOK 2017 INFRASTRUCTUREBUILD.COM
Scenario two: A better way to move
The introduction of autonomous use these services for select enough to ensure the wait times
Autonomous
electric vehicles provides an alter- trips, relying on the private car for are minimal, particularly in the advantages
native to car ownership. most daily travel. inner city.
In this scenario, people would Private car ownership involves For residents who choose
rely on autonomous ride-sourcing high fixed costs such as financing, to forego car ownership in the Autonomous vehicles
services for daily travel. registration and insurance, for an autonomous era, many will choose offer several major benefits
These services will be like asset which is idle 96 per cent of to live in the inner suburbs to
as they:
today’s Uber and taxi services, but the time, rapidly depreciates in optimise autonomous ride-sourc-
• communicate with each
with no driver, and a much lower value and takes up valuable land ing fares.
price tag. for parking. These residents will use a mix other and/or the road
Using Melbourne as a case With car sharing and ride of high-quality public transport, infrastructure itself,
study, KPMG analysis shows that sourcing, these fixed costs are walking, cycling and autonomous maximising vehicle
autonomous ride sourcing will distributed among a large pool ride-sourcing services. speed and flow
contribute to a seven per cent of users. • markedly increase the
reduction in average trip time and Currently, these advantages are A smaller, more capacity and speed of
nine per cent reduction in person offset by the cost of a driver (ride productive fleet long-distance freeway
kilometres travelled by car. sourcing), or the inconvenience of Car ownership involves high
travel, catalysing a shift
This would lower the demand finding, booking and walking to a upfront costs such as financing,
in how and where people
for road infrastructure, ease the vehicle (car sharing). In the auton- registration, maintenance and
burden of congestion in our cities omous era, these disadvantages insurance. live and how they move
and make our transport systems will no longer exist. With autonomous ride sourcing, • make long-distance travel
more efficient and productive. Analysis undertaken by KPMG these costs will be shared among easier, freeing drivers from
suggests that an autonomous a large pool of users. As a result, having to concentrate on
Inner city densification
TRANSPORT
ride-sourcing service would cost the vehicle fleet would be much the road for long periods
The autonomous era will also $8-10 per half hour of travel. smaller and in use for most of its and encouraging some to
encourage inner and middle-ring This implies that a typical Mel- economic life. In contrast, private-
accept longer travel times
city densification. burnian’s annual cost of vehicle ly owned cars are idle 96 per cent
• are also much cheaper to
Ride-sourcing services (such as travel would reduce from $11,000 of their life on average
Uber and taxis) and car-sharing to $6,000-$7,000, an option that These efficiencies will reduce operate and maintain than
services (such as GoGet and Flexi- will appeal to many. the cost of daily transport for con- petrol and diesel vehicles,
car) have enjoyed rapid growth in If large numbers of residents sumers. KPMG estimated that an increasing the affordability
our cities. use autonomous ride-sourcing autonomous riding service would of long-distance travel.
Despite this, most people only services, the fleet would be large cost $8-10 per half hour of travel
Register before Jan 27th and save SG$300
Autonomous Vehicles ASIA 2017
Main Conference: Pre-Conference Post-Conference Venue: Amara
21 - 22 February 2017 Workshop: Workshop & Site Tour: Sanctuary Resort
20 February 2017 23 February 2017 Sentosa, Singapore
STRATEGIES AND REGULATORY ROADMAP FOR IMPLEMENTING AUTONOMOUS VEHICLES IN ASIA
EXPERT SPEAKERS
Peter Damen Dr. Bernhard Morys Seo-ho Choi
Chair of Executive Head of Driver Assistance General Manager,
Steering Committee & Chassis System Human Factors & Devices
Australian Driverless Daimler Greater China Ltd. Research Team Hyundai
Vehicle Initiative Motor Company
James Williams Changgi Lee Niels de Boer
Manager Policy Senior Deputy Director Programme Director,
– Compliance & Technology Ministry of Land, Infrastructure Centre of Excellence for
National Transport and Transport, Republic of Testing and Research of
Commission, Australia Korea Autonomous Vehicles
- NTU (Cetran)
KEY TOPICS DISCUSSED
1 4
Legislation and Regulatory Latest Case Studies on the Media Partners:
Roadmap for Asia Autonomous Commercialization of AVs
Vehicles (AVs)
2 5
Evaluating Infrastructure Enhancing Public
Readiness to Enable AV Acceptance of AVs
Implementation on Public Roads
Researched & Developed by:
3
Ensuring Risk Management,
Safety and Reliability for AVs
T: +65 6722 9388 | F: +65 6722 9397 | E: enquiry@iqpc.com.sg | W: www.autonomousvehiclesasia.com
compared to $34 for an equivalent
            service with a driver.
                                                    How should we respond?
             At this price, the annual cost of      Governments must begin taking                                         • provide affordable housing in            vehicles on land use – this can be
            car travel for a typical Melbourne      action now to safeguard the                                             the inner and middle suburbs             achieved with land use trans-
            household would reduce from             liveability and productivity of our                                     to encourage densification and           port interaction (LUTI) models
            $11,000 to $6,000-$7,000.               cities in the autonomous era.                                           take-up of ride-sourcing services      • consider autonomous electric
                                                       KPMG recommends the                                                • assess development plans to              vehicles in our infrastructure
            More efficient use                      following actions:                                                      ensure new developments are              planning and investment
            of road space                           • review existing planning                                              consistent with the implica-             decision-making processes
            When people make the decision to           schemes and controls to                                              tions of the autonomous era              – this includes the take-up
            purchase a car, they commit to the         ensure they support urban                                          • invest in decision-making tools          of autonomous ride-sourcing
            high upfront costs that come with          consolidation that is appropriate                                    for understanding the impact             services and the implications for
            car ownership.                             from a societal perspective                                          of autonomous and electric               travel behaviour and land use
              Once those costs are incurred,                                                                                                                       • implement road pricing re-
            the additional perceived cost            Average trip time by car, weekday morning peak, 2046                                                            form as a matter of priority
            of each trip is low, estimated by                                                                                                                        to manage demand for car
                                                                                   15
            KPMG at $2.10 per half hour of                                                                              +29%                                         travel, and as a policy lever
            city travel.                                                                                                                                             to encourage ride sharing
              Autonomous ride sourcing has                                                                                                                         • encourage an eventual transition
            no upfront costs, saving the user                                                                                                                        from private ownership to ride
                                                    Average time per trip (mins)

            thousands of dollars per year.                                                                                                                           sourcing and car sharing for
            However, the cost per trip is                                          10                                                                                daily travel, including promoting
                                                                                                                                                  -7%
            higher than if the car was privately                                                                                                                     business models that provide
            owned, estimated at $8-$10.                                                                                                                              these services – governments
              Because each individual trip                                                                                                                           must also ensure high-qual-
TRANSPORT

            costs more, people have greater                                                                                                                          ity alternatives to car travel
            incentive to walk, cycle or use                                        5                                                                                 are available, including public
            public transport. This will lead to a                                                                                                                    transport, walking and cycling
            decrease in road congestion.                                                                                                                           • address regulatory hurdles
              It will also increase demand                                                                                                                           to the mass adoption of
            for modes that use space more                                                                                                                            autonomous vehicles.
            efficiently than cars and promote                                      0                                                       Source: KPMG analysis

            public health, including public                                                    Business as usual   Private autonomous      Autonomous ride         Praveen Thakur is a director
            transport, walking and cycling.                                                                              vehicles              sourcing            at KPMG

                       award-winning conference
                       held in australia for
                       the first time
                       Don’t miss your chance to be part of Australia’s premier
                       street lighting and smart controls conference.
                       Sponsorship and trade booth opportunities
                       are open now, but filling quickly. Registrations
                       open 1 December, early bird discounts apply.

                       14 - 17 March 2017
                       Brisbane Convention & Exhibition Centre
                       South Bank, Brisbane, Qld, Australia

                                                                                                                                         Smart Lighting for Smart Cities

                                                                                                                                        www.streetlightingconference.com.au

                                                                                   S LP
                                                                                   STRATEGIC LIGHTING PARTNERS
Gearing up for changing
transport trends
How fast are electric vehicles approaching national acceptance and what does it mean for
New Zealand fuel companies? One major fuel distributor has been looking at the road ahead…

Electric vehicles (EVs) may
become popular much faster
than previously anticipated and
will constitute over 33 per cent
of the country’s passenger and
light commercial vehicle fleet by
2030, according to Z Energy.
  The company’s latest research
report, Electric vehicles Making
a positive contribution to New
Zealand, believes it’s “inevitable”
that local roads will see a lot more
EVs – particularly Plug-in-Hybrid

                                                                                                                                                                               ENERGY
Vehicles (PHEVs) that have both
an electrically driven powertrain
and an ICE or internal combustion
engine (ICE); although Hybrid
Electric Vehicles (HEVs) that aren’t
powered by an external electricity
source will also be a disruptive
influence given their relative
energy efficiency improvement
over ICE vehicles.
  Developed using Business NZ
Energy Council scenarios, Z’s
report sees two scenarios for           FAST GAME: an EV fast charger can fully charge a car in 10-25 minutes, making them ideally suited for areas such as airports and
EV uptake:                              supermarkets where people park for a lengthy period
• in a Kayak future, markets
  drive supply chain decisions
  and innovation, with consumers        on the back of global technology                                                         fleet each year to 64,000 vehicles
  making informed decisions             developments.                                                                            in 2021 – equivalent to the Waka
  based on price and quality              Combined with New Zealand’s               The government see                           scenario for EV and PHEV uptake
• in a Waka future, heightened          commitment to a lower carbon                EVs as one of the                            at 2021.
  environmental awareness               emission economy and high                                                                  The 2021 target may appear am-
                                                                                    main pathways to a
  drives business, consumers and        renewable electricity base, this                                                         bitious, but the company believes
  government to make decisions          promotes exponential uptake.                lower carbon future                          there are potentially other incen-
  in the national interest.               Actual electric powertrain                and to meeting                               tives in the pipeline such as fringe
  The research indicates the Waka       vehicle fleet numbers for 2015              New Zealand's                                benefit tax (FBT), road tolling and
scenario offers the most disrup-        are tracking below the Waka                 international COP21                          ACC levy exemptions.
tive potential impact to existing       scenario; however, Z views this as                                                         In addition, the government sees
energy businesses.                      “insignificant” given that potential
                                                                                    commitments                                  EVs as one of the main pathways
  The number of vehicles in the         exponential uptake commences                                                             to a lower carbon future and to
light duty fleet increases materi-      from 2020.                                                                               meeting New Zealand’s interna-
ally over the period to 2050 (12.1        In addition, the government’s EV                                                       tional COP21 commitments (the
per cent CAGR), driven by wide          incentive scheme targets a dou-                                                          Conference of Parties that ratified
availability at economic prices         bling of the combined EV and PHEV                                                        the UN Framework Convention on

NZ passenger and light vehicle commercial fleet numbers (Waka scenario)
TYPE               2015 (A)             2015             2020             2025              2030             2035             2040              2045             2050
HEV                   14,980           15,000        100,000           485,000          815,000           985,000          985,000           865,000          770,000

PHEV                     474           25,000          25,000           95,000          270,000           540,000          820,000           995,000          875,000

EV                       450           10,000          15,000           90,000          205,000           320,000          500,000           775,000        1,110,000

TOTAL                 15,904           50,000        140,000           670,000        1,290,000         1,845,000        2,305,000        2,635,000         2,755,000

% FLEET                   0%              2%                4%             18%               34%              47%               57%              64%               66%

                                                                                                                          INFRASTRUCTUREBUILD.COM YEARBOOK 2017            9
Climate Change in 1992 at the          NZ transport energy demand scenarios – petrol (mlpa)
         Earth Summit in Rio de Janeiro).
           The increasing uptake of electric
         powertrain vehicles in the light                     2015 (A)        2015       2020        2025     2030       2035        2040      2045       2050
         vehicle fleet will, however, mate-
                                                Kayak             3,050       3,185      3,230       3,135    2,980      2,820       2,685     2,585      2,500
         rially reduce demand for existing
         petroleum-based fuel – particular-     Waka              3,050       2,870      2,845       2,450    1,975      1,530       1,200     1,190      1,180
         ly petrol.
           EVs are substantially more ener-     rK (cum)                -      135        180          85       (70)     (230)       (365)     (465)      (550)
         gy efficient than ICE vehicles – an
         equivalent journey requires less       rW (cum)                -     (180)      (205)       (600)   (1,075)   (1,520)      (1,850)   (1,860)   (1,870)
         joules of energy input.
           Both the Kayak and Waka sce-         rMP (cum)               -      (20)       (10)       (260)    (570)      (875)      (1,105)   (1,160)   (1,210)
         narios show efficiency improve-
         ments in the heavy vehicle fleet
         are less dramatic, with electricity
         not assumed to have a significant
         penetration other than for trains
                                                NZ transport energy demand scenarios – diesel (mlpa)
         and buses.
           Petrol consumption for transport                   2015 (A)        2015       2020        2025     2030       2035        2040      2045       2050
         use over the period will be driven
         primarily by transformation in the     Kayak             2,290       2,245      2,240       2,285    2,360      2,425       2,405     2,205      1,695
         light vehicle fleet and reduction in
                                                Waka              2,290       2,205      2,150       2,125    2,115      2,080       1,950     1,655      1,085
         personal car usage and/or owner-
         ship, ranging from 0.7 CAGR under
                                                rK (cum)                -      (45)       (50)         (5)       70          135       115       (85)     (595)
         Kayak to 2.5 per cent under the
ENERGY

         Waka scenario.
                                                rW (cum)                -      (85)      (140)       (165)    (175)      (210)       (340)     (635)    (1,205)
           Diesel consumption for transport
         use will be driven by the transfor-
                                                rMP (cum)               -      (65)       (95)        (85)      (53)         (38)    (113)     (360)      (900)
         mation in the light vehicle fleet
         and the reduction in personal car
         use and/or ownership, offset by an
         increasing need for heavy vehicle
         transport due to economic growth.      Carbon price ($ per T CO2)
           Both hydrogen and biofuels
         become viable for heavy vehicle                                    2015      2020          2025     2030      2035         2040      2045        2050
         transport from 2040, significantly
                                                Price carbon – Waka           21         37           48       60            75        90       102         115
         reducing demand later in the peri-
         od and impacting diesel consump-       Price carbon – Kayak           7          9           12       18            26        37         49         60
         tion from (0.8) per cent CAGR
         under Kayak to (2.0) per cent
         CAGR under the Waka scenario.
           Several input assumptions
         underpin the EV uptake numbers,
                                                Battery cost curve (NZ$/kWh)
         representing signposts to monitor
         in determining what scenario could                                    2015       2020        2025     2030          2035    2040      2045       2050
         eventuate.
                                                Battery cost curve – Waka          365        310      270       240          215      195       175        160
           The price of carbon has risen
         from under $10 to around $18 per       Battery cost curve – Kayak         330        270      235       210          195      180       170        160
         T CO2, following the government’s
         May 2016 budget announcement
         on changes to the Emissions            in 2015 estimated to be around        tious cost estimates of $160 per        Autonomous vehicles
         Trading Scheme (ETS) that will see     $400 per kWh.                         kWh in the 2020s.                       Adoption of autonomous vehicles
         the phasing out of the one-for-two       It’s not possible to determine a      The difference in price between       could reduce transportation
         subsidy by January 2019.               completely reliable projection of     a conventional ICE and an EV is pri-    energy demand through lower light
           However, the $25 price cap           future battery cost – though some     marily due to the cost of batteries     duty vehicle ownership and re-
         remains in place, meaning the          manufacturers such as General         – as lithium-ion battery technology     duced vehicle kilometres travelled.
         impact of the ETS on the price         Motors and Tesla have more ambi-      advances and battery cost comes           The intersection of EV
         of petrol is approximately 6.6cpl,                                           down the price premium barrier to       uptake with future acceptance
         and 7.7cpl for diesel – levels that                                          consumers in purchasing EVs will        of self-driving technology
         on their own are unlikely to drive                                           also likely reduce.                     could unlock an evolution of
         mass adoption of alternative pow-                                              Correlated with reducing battery      transportation-as-a-service
         ertrains for transportation.                                                 cost trends is an increase in           through car sharing.
           Regulation is a critical uncer-      Both hydrogen                         battery energy density (kWh/ kg),         EV technology is available today,
         tainty as to the future price of                                             which in turn improves EV range         but the development and accep-
         carbon and the uptake of EVs;
                                                and biofuels                          capability – a key consumer con-        tance of autonomous vehicles
         will successive governments err        become viable                         cern with EVs.                          could have a greater long-term
         towards a more light-handed or a       for heavy vehicle                       Several other uncertainties could     horizon impact.
         more interventionist regime for        transport from                        stretch the boundaries of any future      Car manufacturers such as
         promoting uptake?                                                            scenario, including autonomous          Ford and Tesla have announced
           Both scenarios support a con-
                                                2040, significantly                   vehicles, heavy fleet technology, EV    plans for a future car-sharing
         tinuing trend of rapidly reducing      reducing demand                       availability and the electricity and    service built around their self-
         battery costs, with actual cost        later in the period                   charging infrastructure.                driving vehicles.

         10   YEARBOOK 2017 INFRASTRUCTUREBUILD.COM
Electric vehicle scenarios PHEV scenarios
Z Energy House View: Electric vehicles
1,300,000 1,300,000 11
1,200,000 1,200,000
1,100,000 1,100,000
1,000,000 1,000,000
900,000 900,000
Appendix B
800,000 800,000
No’s
No’s
700,000 700,000
600,000 600,000
500,000 500,000
400,000 400,000
300,000 300,000
200,000 200,000
Charts for petroleum demand impact
100,000 100,000
0 0
2010 2015 2020 2025 2030 2035 2040 2045 2050 2010 2015 2020 2025 2030 2035 2040 2045 2050
Year Year
Source: BEC NZ 2050 Scenarios and MOT data Source: BEC NZ 2050 Scenarios and MOT data
EV – Actual EV – Waka PHEV – Actual PHEV – Waka
EV – Kayak EV – Range PHEV – Kayak PHEV – Range
Transport fuel consumption scenarios – petrol Transport fuel consumption scenarios – diesel
ENERGY
HEV3,500
Scenarios 3,500
3,000 3,000
1,300,000
1,200,000
2,500 2,500
mlpa
mlpa
1,100,000
1,000,000
2,000 2,000
900,000 EVERYDAY OCCURRENCE: charging an electric vehicle will soon be as familiar as
1,500
800,000 filing1,500
up at a petrol pump for a third of Kiwi drivers if Z Energy’s projections pan out
No’s
700,000
1,000
600,000 1,000
ments to the goal of 20 million EV with its recent public announce-
500,000 cars by 2020. ment that “the future is electric”
500
400,000 500vehicle importers con-
Motor – a new strategy to roll out more
300,000 sistently report that they could electric cars and add self-driving
0 0
200,000 respond quickly to increased features faster than their rivals.
100,0002010 2015 2020 2025 2030 2035 2040 2045 2050 demand if2010
New Zealand
2015 2020 sales of
2025 2030 Z believe
2035 it 2040
is “reasonable”
2045 to as-
2050
0 Year EVs take off. sume that growth in EV adoption in
Year
Source: BEC NZ2020
2050 Scenarios
Under theSource:
WakaBEC scenario
NZ 2050 Scenarios andNew
MOT Zealand’s key vehicle supply
2010 2015 2025 and MOT data
2030 2035 2040 2045 2050 data
~500,000 additional HEV, PHEV markets of Japan and Europe will
Year or EV vehicles enter the light duty be sufficient to support exponen-
Petrol Consumption Actual Petrol – Waka (ml) Diesel Consumption Actual Diesel – Waka (ml)
vehicle fleet over the five-year tial demand growth.
Petrol – Kayak
Source: BEC NZ(ml)
2050 Scenarios andPetrol
MOT data
Consumption Range period fromDiesel – Kayak
2020 (ml)
to 2025. Diesel Consumption
However, Range
the current rate of
On average ~100,000 or 35 per turnover of the New Zealand light
cent of new or used imports per duty vehicle fleet makes a more
HEV – Actual HEV – Waka
The opportunity isn’t limited to new and used vehicles imported annum would have electric pow- aggressive EV demand growth
traditional car manufacturers,
HEV –with
Kayak into New Zealand
Transport fuel consumption scenarios –Range HEV – in 2015.
petrol ertrains – a significant rise from
Transport fuel consumption scenarios a scenario than – Waka
dieselseem implau-
giants such as Google, Apple and Japan is a member of the total of ~3,000 vehicles in 2015. sible the company believes.
Uber all3,400
prominent in this develop- Electric Vehicles Initiatives (EVI), Manufacturers’
3,400 research and de- The volume and number of EV
ment space. a multi-government policy forum velopment focus is now predom- models coming to market will
3,200 representing the majority of global 3,200
inantly electric powertrains, with increase significantly, making
Heavy3,000
vehicle fleet EV car stock, which has a goal some manufacturers
3,000 intending to them cheaper and thus more
technology of achieving 20 million EV cars stop any further internal combus- attractive to consumers by
The uncertainty
2,800 is over what alter- by 2020. tion2,800
engine R&D by 2025. increasing the number of vehicle
nate technology to fossil fuels will Japan currently has 16 per cent Leading Japanese manufactur- segments and brands.
mlpa
mlpa
2,600 2,600
prevail, and to what extent, in the of the global car stock of EVs at ers Toyota, Nissan, Honda, Suzuki,
heavy vehicle
2,400 sector – trucking. 0.13 million, with a committed tar- Mazda and Mitsubishi all have
2,400 Can the electricity sector
The impact of this uncertainty get to get to one million by 2020. expansive targets and plans to meet the demand?
2,200
will occur over a longer-term hori- The Japanese government 2,200 production capacity of EV
increase New Zealand is one of the most
zon than for plausible EV uptake in provides financial incentives for car models. EV-ready countries in the world,
2,000 2,000
the light vehicle fleet. EV cars, including purchase price Similarly, the main European with a high base of renewable
1,800 subsidies and tax exemptions. manufacturers
1,800 that supply electricity and the necessary
Can new and used France, Germany, Italy, Nether- the New Zealand car market network infrastructure to support
imports meet 13 demand? lands, Norway, Portugal, Spain, (Volkswagen, 13 BMW, Mercedes- PHEV uptake – if only because of
20 4
20 4
20
20
15
15
20 7
20 7
18
18
16
16
20 9
20 9
21
20 2
20 3
20 4
20 5
20 6
27
20 8
29
30
21
20 2
20 3
20 4
20 5
20 6
27
20 8
29
30
0 0
1
1
1
1
1
1
2
2
2
2
2
2
2
2
2
2
2
2
2 2
20
20
20
20
20
20
20
20
20
20
20
20
20
20
20
20
Asia (primarily Japan) and Europe Sweden and the UK are also Benz, Audi and Renault) have all the suburban garages with an
accounted for 77 per cent and 20 Year
members of EVI, with most having consistent plans. Year
ordinary three-pin socket.
per cent of the record 285,000 announced aspirational commit- The most prominent is BMW, Although there is some uncer-
Source: BEC NZ 2050 Scenarios and MBIE data Source: BEC NZ 2050 Scenarios and MBIE data
INFRASTRUCTUREBUILD.COM YEARBOOK 2017 11COMMON SIGHT: there are currently more than 100 EV fast-
charging stations strategically located throughout the country,
mainly in the main centres where traffic density is highest
tainty over how smart charging This backbone could then
could manage electricity distri- encourage further charging infra-
bution flexibility, New Zealand is structure by other businesses,
uniquely placed in having planning including airports, retailers, super-
consent for enough wind farms, markets, tourist destinations and
hydro and geothermal power sta- other places where people park
tions to cover about a 25 per cent their vehicles.
increase in demand for electricity. Auckland-based private compa-
ny, Charge.Net.NZ is also rolling
Will EV charging out a national network of fast-
infrastructure support charging stations, with over 100
EV uptake? sites already in place.
International trends show charging A fast charger can fully charge
infrastructure availability is posi- a car in 10-25 minutes, but while
tively correlated to growth in EVs. many public AC chargers are free
The Electricity Networks Associ- a fast DC charger can cost up to
ation [ENA] working group of lines $40,000 to install.
companies along with Contact Z concludes that charging infra-
Energy, Mercury and Drive Electric structure development is “relatively
are looking at a coordinated low cost” and underway to support
ENERGY
approach to putting in place a ‘re- future EV uptake, thereby alleviating
newables highway’ that provides consumer anxiety over short range
public access to charging. and long charging times.
The renewables highway would Whatever the scenario, whether
potentially see a network of Waka or Kayak, the electric vehicle
charging locations at key stopping looks destined to become a com-
points and tourism locations along mon sight on New Zealand roads –
State Highway 1, expanding to and within a very, very short period
regional routes over time. of time.
Thrifty backs a winner
in road safety
An online interactive driver training programme, Fleetcoach, picked up the
Thrifty Car Rental sponsored Fleet Safety Product Award at the recent 2016 Backing
Safety!
Brake Australasian Fleet Safety Awards.
The training programme coaches drivers through multimedia modules in skills
such as hazard perception and situation awareness.
Fleetcoach was created by Dr Robert Isler, who also won the Outstanding Com-
mitment Award for his 25 years service at the forefront of road safety research.
General Manager of Thrifty Rental Emma Gardiner joined Brake’s New Zealand
Director Caroline Perry in congratulating the winning awards and highly com-
mended entries in a range of areas
Dr Isler’s research, and his knowledge of other research worldwide, was
We value your safety when
used to develop the programs and ensure they use the latest behavioural you’re behind the wheel,
interventions.
He pioneered work on a head-mounted eye-tracker, which showed that eye
that’s why we’re proud
movements control to a large degree how drivers move their steering wheels. charity partners of Brake.
It also showed that effective eye-scanning behaviour and hazard perception
skills can be trained in both laboratory and real driving situations.
The research findings lead to the development of several interactive multime-
dia training programs.
He founded e-Drive in 2010, an online driver training program that focuses on
visual search, situation awareness, hazard perception and risk management
driving skills for all drivers.
Fleetcoach was created through the need for a similar driving programme for
at work drivers.
There is also a risk assessment element, so that managers can identify wheth-
er their drivers are low-risk or high-risk and require specific training modules on
various topics such as speed and distractions.
“We’re proud to sponsor the Fleet Safety Product Award,” Thrifty’s Emma
Gardiner says.
12 YEARBOOK 2017 INFRASTRUCTUREBUILD.COMWelcome to a low-carbon world
The next global energy transition is already under way, posing risks for some of the world’s
ENERGY
largest energy companies says global natural resources analyst company Wood MacKenzie
Natural gas and zero-carbon a price on carbon. “As costs for renewables and money on the table from the ma-
fuels will satisfy at least 60 The vast majority of the majors’ energy storage continue to fall, jors’ fossil fuels business. But too
per cent of the rise in global upstream operations are not ‘subscription’-type services could slowly, and they could miss their
energy demand to 2035, and yet directly impacted, with most open up new low-carbon growth window of opportunity.
under some scenarios renewable policies primarily focused on the markets. For example, electric “The biggest risk for oil and gas
energy could grow nearly 500 per power and industrial sectors. car sharing.” companies is to do nothing, and be
cent in the next 20 years. Coal Up to 50 per cent of majors’ pro- According to the study the global left exposed to investors making
and oil demand could peak well duction could be hit with carbon major oil companies are under their own minds up.
before 2035. costs over the next decade – but pressure to de-risk their existing “There is notably an emergence
As demand for oil slows and en- only if the countries and regions business models and diversify into of three different strategies by
ergy growth shifts to lower carbon that currently price carbon extend low-carbon energies. the major oil companies – decarbo-
fuels, renewables will grow rapidly their policies to the extractives However, diversification into nise, capitalise or grow.
across all regions. “The majors are testing different
The three main risks for global strategies to decarbonise and mit-
oil majors identified in Wood Global demand shifting to lower-carbon igate risks, to capitalise by using
Mackenzie’s study: Fossil fuels 5.0% existing capabilities to explore
to low-carbon: The Majors’ energy Forecast
opportunities in renewables and to
Historic data (1995-2015)
transition are: Wood Mac base case*
grow a profitable and substantial
• the growth in renewable energy WM carbon-constrained scenario renewables business.
• intensifying carbon policy IEA 450 scenario** “Regardless of the diverging
Average % YoY Growth
• and increasing low- 2.5% strategies, the majors are all
carbon competition. increasing their share in gas while
The study investigates how also aiming to push down the cost
the major oil companies are curve,” says McConnell.
responding to growing pressure “Global carbon risks could
0.0%
to move to a low carbon-energy depress oil prices for the long
environment. term with slowing demand and an
Paul McConnell, research increase in costs, making it crucial
director of global trends for for the majors to push break-
Wood Mackenzie, says: “As carbon Coal Oil Gas Zero-carbon fuels evens down further.
-2.5%
policy intensifies, the oil and gas “To facilitate the move to
majors will face more regulatory low-carbon energy policies, new
burden and are likely to face sectors. These are commonly out- renewables will be challenging. skills will be needed through joint
increasing costs. side the scope of emissions-limit- It will be difficult to both justify ventures or acquisitions.”
“Green financing could also mean ing schemes. allocating already scarce capital to While there is strong rhetoric on
higher cost of capital for more “While all the major oil companies low-returning projects and trans- diversification into renewables, a
carbon-intensive oil assets such put a price on carbon in their long- form existing business models. much greater proportion of capital
as oil sands, as investors shift to term planning, the big question “The timing of a transition to will be needed to deliver a material
alternative fuels and lower-carbon is how much risk each has taken low-carbon energy will be critical,” shift Woods MacKenzie maintains.
technologies.” into account,” says McConnell. says McConnell. “Diversifying
Wood Mackenzie’s study shows Assumptions vary greatly by geog- to renewable energy will be a
that only 13 per cent of global raphy, timeline and on price from balancing act.
emissions are currently covered by between US$6 to US$80 a tonne. “Moving too quickly could leave
INFRASTRUCTUREBUILD.COM YEARBOOK 2017 13The art of procurement
prophecy: promises and pitfalls
There’s plenty of good news in procurement in 2017 and it’s only going to get better
MANAGEMENT
Several main factors are that they’ll continue to improve, project and the long-term sustain- they can plan and put in place the
combining to shape and change providing more certainty and en- ability of the assets created. partnerships, the resources, the
the procurement environment abling us to minimise investment Standard sets of questions staff and the plant they’ll need to
for both clients and suppliers, in wasted efforts on both sides of that are used as a template for deliver those projects efficiently
according to the 15-strong Plan procurement. every tender are now openly and competitively.
A team that works with suppliers In 2015 and 2016, we’ve seen acknowledged to fall short of best No longer blind-sided by massive
to write, review, manage and publication of far more accurate practice. The risks and opportuni- tenders that spring on us on the
edit bid responses in just about and detailed infrastructure project ties to add value are different for 23rd of December to be completed
every sector pipelines from organisations such every project. by the 10th of January, supply-side
Their expert views are sup- as the National Infrastructure Unit, So the tender documentation, if tenderers can put real time and
ported by their experienced Infrastructure New Zealand and designed carefully to target risks careful thought into developing
colleagues within Clever Buying the NZ Transport Agency. and opportunities that will deter- clever methodologies that will
– the organisation that trains and They’ve served two purposes. mine project success, provides deliver sustainable benefits over
mentors hundreds of procurement First, they have enabled clever the tools that lead directly to the the life of the asset.
professionals and qualifies tender clients to put serious time, exper- right decisions. That’s good for This is a huge advance over the
evaluators. tise and planning into their tender all of us, especially when it’s our cheap and short-term, seat-of-
documents. The best tender doc- money invested in public assets the-pants bids that won the job
Pipeline forecasts will uments make it clear in objective that’s at stake. but delivered a low quality flimsy
drive better procurement terms what they are looking for. Secondly, and equally important- asset that didn’t last the distance.
planning on both sides They incorporate ‘gates’ which ly, detailed pipelines of upcoming
The forecasting tools for both effectively make it impossible for projects coming to market have Winning on quality will
clients and suppliers to the an unsuitable supplier to get past given suppliers an incredibly useful demand more effort
infrastructure sector have come base one; then they zero in to the forecasting tool to plan their A consequence of this, however,
a long way in the past couple of factors that will make a tangible tendering activity. is that suppliers need to put
years; and there’s every indication difference to the success of the Armed with that intelligence, significant effort into the
14 YEARBOOK 2017 INFRASTRUCTUREBUILD.COMpreparation of their tenders. NZQA Procurement better than before. Since the early
Winning on quality is everyone’s qualification to 1990s that qualification has been
goal, but it doesn’t happen without prove its worth “The NZQA the mainstay of councils and road
effort and time invested. The new NZQA Procurement Certificate in controlling authorities throughout
Based on experience, those qualification came online this year New Zealand as the benchmark
suppliers who start planning – strengthened, updated and ex-
Infrastructure in competence in best practice
strategy and preparing their bids tended to all of infrastructure. Its Procurement procurement via tendering.
early, engage professional help assessment tools were approved is relevant and Traditionally, it relied heavily on
when needed, and are open to in November; and the first few focused, providing evidence of experience to provide
independent input into their candidates are working through it. the basis of achievement of the
a practical
review are those who most often As an alternative to the UK-de- qualification. That proved a risky
score highest. veloped procurement qualification qualification for tactic in some cases, since best
Last-minute, rushed tender suite available from CIPS (the procurement practice in procurement was not
preparation is never anyone’s Chartered Institute of Purchasing professionals who well defined and acceptance of
ideal, but sometimes a massive and Supply), the NZQA Certificate are engaged in a variety of legacy practices was
effort is needed in a short space in Infrastructure Procurement is sufficient to gain the qualification.
of time. That’s why the Plan A relevant and focused, providing
tendering” It was difficult for assessors
team now incorporates northern a practical qualification for pro- of the old qualification to be
hemisphere bid writers, who curement professionals who are confident that an individual had
leverage time zone differences to engaged in tendering. the skills and competence to
enable round-the-clock activity on Assessment and learning is via Progress on achieving compli- prepare RFx documents or
tenders when needed. workplace activity rather than ance with those sensible rules evaluate tenders to the standard
Suppliers who plan their tenders exams and reading textbooks, so has been agonisingly slow over required, since the evidence was
effectively and are willing to invest the knowledge and skills are imme- the past three and a half years; largely shown via documents that
in winning work will always be at diately applicable to professionals but this qualification has the were jointly prepared by teams
MANAGEMENT
an advantage; so using those who are working in procurement in potential to create step change in of evaluators.
forward work plans to plan your New Zealand. compliance within those directly The new version of the
bid programme through 2017 What’s more, the qualification is responsible for government pro- qualification requires assessment
is prudent. the only one to build in a working curement activity, from ministries via observation and interviewing
Full marks to those government knowledge of the New Zealand and departments, right down to to assure the assessor of that
organisations who are most Government Rules of Sourcing, councils and even, for example, individual competence. Rolling
active in communicating their which have been mandatory, school boards. out standard templates prepared
forward work plans to tenderers expected or encouraged as best What this means for clients originally by others – with minor
and using them to plan their ten- practice for New Zealand govern- is that the proven NZTA tender tweaks or edits from the individual
dering activity. ment organisations since 2013. evaluator qualification is now even being assessed – will no longer
WHO WON
THAT TENDER?
Was Plan A the wind
beneath their wings?
In 2016, the 15 – strong Plan A team wrote over 300 tenders across all sorts of sectors,
including infrastructure, facilities management, technology, professional services and
more. We helped clients respond to tenders for contracts in NZ, Australia, the Pacific,
North America, the Middle East and Africa.
We wrote, developed strategy, reviewed, edited, designed
ISN’T IT TIME
and produced tenders that won billions of dollars’ worth
of work for our clients. It’s our Day Job (and sometimes
YOU GOT
our Night Job too!). PLAN A TO
HELP WIN
We know what it takes to win, and how best to support YOUR NEXT
you to grow your business. TENDER?
Find out more:
www.planawriters.com info@planawriters.com NZ 0800 752 622 AUS 1800 661 377be acceptable. They’ll need to should not be overlooked. Stronger and deeper
demonstrate their personal Clients argue that although this alignment between
understanding and involvement tips the market in favour of larger A key point of procurement agencies
in decision-making to conform companies and potentially reduc- debate prompted A key point of debate prompted
with well-defined best practice es the number of opportunities for by Infrastructure New Zealand
standards. smaller companies, it is possible
by Infrastructure earlier this year was the proposal
This is excellent news for anyone to maintain a healthy market New Zealand earlier to establish a central agency
involved in tendering. Suppliers will through requiring those head this year was the that would provide a centre
see that with additional discipline contractors to engage a minimum proposal to provide a of excellence in procurement
in procurement planning and tailor- quota or percentage of subcon- specifically targeted to assist with
centre of excellence
ing the RFx documents to drivers tractors for major projects. procurement of large projects. This
for best value for money, there are This is a simplistic approach in procurement was widely supported, but – not
more opportunities to win work which unfortunately does not specifically targeted surprisingly – the question of who
based on the quality and sustain- solve some worrying issues. When to assist with large- and how are head-scratchers.
ability of the solution offered. smaller companies are presented scale projects Clever Buying has been picking
The price war mentality – which with a glass ceiling that prevents the best from various procurement
cut costs to the quick and result- them from contracting direct, they models including NZTA and
ed in so many cases with false have few or no opportunities to MBIE (among other international
economies – is reducing, with the develop their own management examples) over the past five
support of the requirements of systems and expertise. tunities to grow and seized them, years, and blending these into a
this new version of the Infrastruc- While they are under direction with characteristic Kiwi and Aussie best practice training programme
ture Procurement Qualification. from the head contractor, who is ingenuity. for procurement professionals.
not bound to follow the principles As we face a promising and That’s been challenging at
‘Balanced, healthy market’ of fair procurement that applied healthy pipeline of infrastructure times, with misaligned practices
debates will continue to their own engagement with projects over the next five, 10 and and no common language still
MANAGEMENT
There has been much debate a major government client, 20 years, prudent client organisa- evident in the methods taught
among major procurers about subcontractors are often tions will provide a balance of large by those entities. Both those
the merits of aggregating or squeezed on price to the point and small projects to go to market agencies provide good models
bundling contracts to streamline where business growth for them is to encourage the best in every and practices, however it is quite
the number of suppliers that difficult to achieve. tier of infrastructure providers to difficult to blend them into a
clients interact with and reduce Let’s not forget that the giants grow and prosper. That’s insurance seamless model.
administration and tendering that dominate our infrastructure for generations to come that our The past year has seen growing
costs. While on the surface this landscape today grew from small infrastructure market will continue signs of increased cooperation
sounds sensible, there are fish enterprising companies several to attract a range of competitive, between these two agencies,
hooks in this approach which decades ago, who had real oppor- high quality suppliers. which is welcomed. The NZTA
Over 8 hours of Networking Opportunities with Leading Procurement & Contract Management
Infrastructure Industry Leaders & Government Authorities from Across the Region
PROCUREMENT & ↘ Main Summit:
29 & 30 March 2017
EXCLUSIVELY!
Quote
CONTRACT MANAGEMENT of ↘ Workshops:
“AsiaPacific
INFRASTRUCTURE”
28 & 31 March 2017
Infrastructure Projects to receive extra 10% discount
when you book the event.
↘ Venue:
Summit 2017 Singapore
THE LEADING EVENT GLOBALLY THAT FULLY FOCUS ON Project Case Studies and Practical Solutions around the
successful delivery of PROCUREMENT AND CONTRACT MANAGEMENT OF INFRASTRUCTURE PROJECTS !
5 KEY BENEFITS IF ATTENDING THE SUMMIT
Find out the latest updates and practical information on procurement & contract management of infrastructure projects in
Asia & globally as well as the latest trends within the industry.
Head/Directors of Procurement & Contract Management, Project Owners and Leading Industry Experts will be present at
the summit – Grab the opportunity to share and gain new perspectives in developing effective procurement & contract man-
agement that could deliver the project on time, cost and quality of the projects.
Hear from 20+ renowned industry experts with profound procurement & contract management experience globally to learn
from distinguished experts on the latest tools available to leads to better infrastructure project outcomes.
Exclusive Panel Discussion among Procurement & Contract Management on Infrastructure Industry Experts – Hear key
trends, winning strategies and effective solutions in every process involved in the procurement & contract management.
Extensive Networking Experience – Meet up with not just procurement & contract management infrastructure industry
leaders but also high-profile decision makers from the government authorities/ ministries and industry leaders within the
world to broaden your business network and discuss future infrastructure development plans!
Researched &
Developed by:
PHONE: 65 6376.0908 EMAIL: enquiry@equip-global.com WEB: http://www.equip-global.com/procurement-amp-contracts-management-for-infrastructure-projects-2017You can also read