2018 AGMPRESENTATION NIGELROBINSON, CEO - Central Asia Metals
←
→
Page content transcription
If your browser does not render page correctly, please read the page content below
2 0 1 8 A G M P R E S E NTAT I O N

 N I G E L R O B I N SO N, C E O
1
                                                                                             CENTRA L A SIA META LS PLC
                                                                                            BUILDING A BIGGER BUSINESS

                                                                                            DISCLAIMER
The information contained in this confidential document (“Presentation”) has been prepared by Central Asia Metals plc (the “Company”). It has not been fully verified and is subject to material updating, revision and further
amendment. This Presentation has not been approved by an authorised person in accordance with Section 21 of the Financial Services and Markets Act 2000 and therefore it is being delivered for information purposes only. Any
person who receives this Presentation should not rely or act upon it. This Presentation is not to be disclosed to any other person or used for any purpose.

While the information contained herein has been prepared in good faith, neither the Company nor any of its shareholders, directors, officers, agents, employees or advisers give, have given or have authority to give, any
representations or warranties (express or implied) as to, or in relation to, the accuracy, reliability or completeness of the information in this Presentation, or any revision thereof, or of any other written or oral information
made or to be made available to any interested party or its advisers (all such information being referred to as “Information”) and liability therefore is expressly disclaimed. Accordingly, neither the Company nor any of its
shareholders, directors, officers, agents, employees or advisers take any responsibility for, or will accept any liability whether direct or indirect, express or implied, contractual, tortious, statutory or otherwise, in respect of,
the accuracy or completeness of the Information or for any of the opinions contained herein or for any errors, omissions or misstatements or for any loss, howsoever arising, from the use of this Presentation.

This Presentation may contain forward-looking statements that involve substantial risks and uncertainties, and actual results and developments may differ materially from those expressed or implied by these statements. These
forward-looking statements are statements regarding the Company's intentions, beliefs or current expectations concerning, among other things, the Company's results of operations, financial condition, prospects, growth,
strategies and the industry in which the Company operates. By their nature, forward-looking statements involve risks and uncertainties because they relate to events and depend on circumstances that may or may not occur in
the future. These forward-looking statements speak only as of the date of this Presentation and the Company does not undertake any obligation to publicly release any revisions to these forward-looking statements to reflect
events or circumstances after the date of this Presentation.

Neither the issue of this Presentation nor any part of its contents is to be taken as any form of commitment on the part of the Company to proceed with any transaction and the right is reserved to terminate any discussions or
negotiations with any prospective investors. In no circumstances will the Company be responsible for any costs, losses or expenses incurred in connection with any appraisal or investigation of the Company. In furnishing this
Presentation, the Company does not undertake or agree to any obligation to provide the recipient with access to any additional information or to update this Presentation or to correct any inaccuracies in, or omissions from, this
Presentation which may become apparent.

This Presentation should not be considered as the giving of investment advice by the Company or any of its shareholders, directors, officers, agents, employees or advisers. In particular, this Presentation does not constitute an
offer or invitation to subscribe for or purchase any securities and neither this Presentation nor anything contained herein shall form the basis of any contract or commitment whatsoever. Each party to whom this Presentation is
made available must make its own independent assessment of the Company after making such investigations and taking such advice as may be deemed necessary. In particular, any estimates or projections or opinions contained
herein necessarily involve significant elements of subjective judgment, analysis and assumptions and each recipient should satisfy itself in relation to such matters.

The Company's principal activity is the exploration and mining of precious and base metals in Kazakhstan and Macedonia. You should be aware of the risks associated with this type of investment and that in emerging markets
such as Kazakhstan and Macedonia, the risks are far greater than in more developed markets (including significant legal, economic and political risks) and that the Company could potentially lose the benefit of its assets in
Kazakhstan and Macedonia. You acknowledge the high number of expenses and difficulties frequently encountered by companies in the early stages of development, particularly companies operating in emerging markets and you
should be aware that this may lead to the loss of your entire investment.

Neither this Presentation nor any copy of it may be (a) taken or transmitted into Australia, Canada, Japan, the Republic of Ireland, the Republic of South Africa or the United States of America (each a “Restricted Territory”),
their territories or possessions; (b) distributed to any U.S. person (as defined in Regulation S under the United States Securities Act of 1933 (as amended)) or (c) distributed to any individual outside a Restricted Territory who is a
resident thereof in any such case for the purpose of offer for sale or solicitation or invitation to buy or subscribe any securities or in the context where its distribution may be construed as such offer, solicitation or invitation, in
any such case except in compliance with any applicable exemption. The distribution of this document in or to persons subject to other jurisdictions may be restricted by law and persons into whose possession this document
comes should inform themselves about, and observe, any such restrictions. Any failure to comply with these restrictions may constitute a violation of the laws of the relevant jurisdiction.

May 2018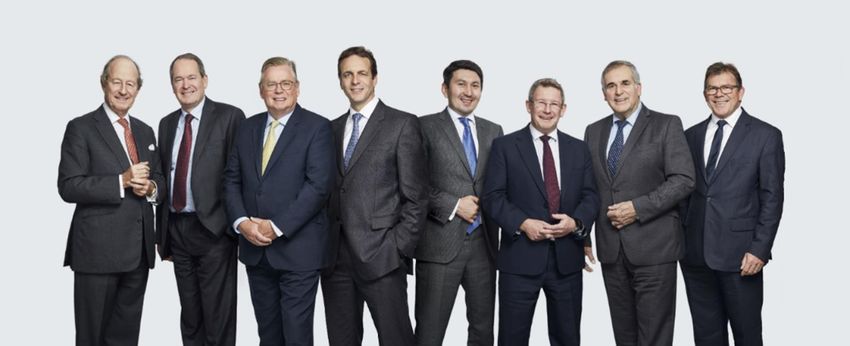
2
CENTRA L A SIA META LS PLC
BUILDING A BIGGER BUSINESS
CAML OPERATIONS
SHUAK (80%)
KAZAKHSTAN
197km2 exploration licence, northern
Population, 18.0 million
Kazakhstan
GDP per capita, $8,585
Potential for copper oxide and
sulphide resources
Extensively explored in Soviet times
22,000m+ drilling undertaken in 2017
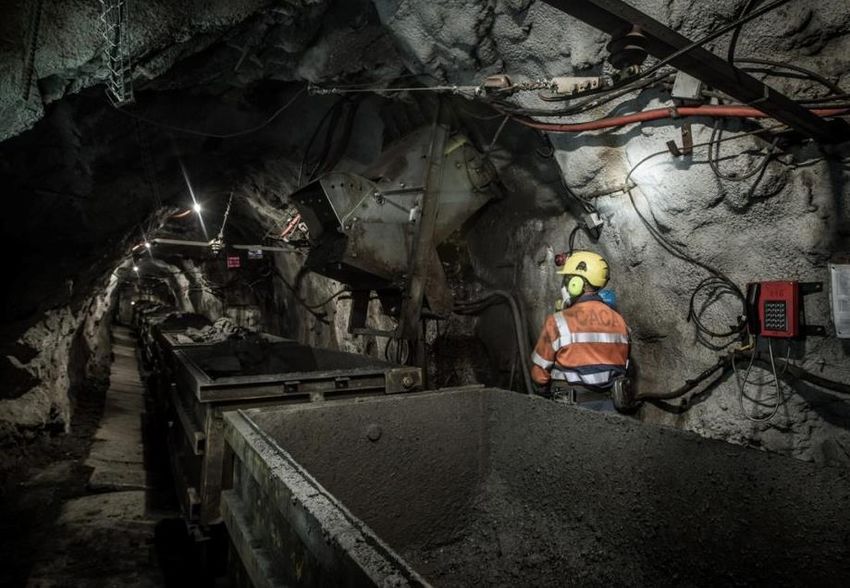
SASA (100%)
Underground zinc and lead mine,
northeast Macedonia
Production commenced in 1960’s
KOUNRAD (100%)
Produces 21,000-23,000t zinc and
28,000-30,000t lead in In-situ dump leach and SX-EW
concentrate annually processing facility, central
Kazakhstan
Life of mine to 2038+
In production for 6 years
2017 production, 21,585t zinc and
29,881t lead Produces 13,000-14,000t copper.
One of the lowest cost copper
producers globally
Life of operation to 2030+
2017 production, 14,103t copper
MACEDONIA
Population, 2.1 million
GDP per capita, $5,916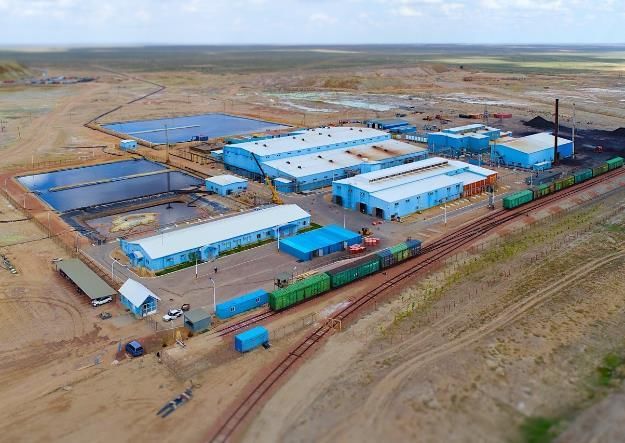
3
                                                       CENTRA L A SIA META LS PLC
                                                      BUILDING A BIGGER BUSINESS

                                 CAML COMPANY TIMELINE
                                                                                                          6 Nov 2017, $402.5m
                                                                        2017, commenced                   acquisition of Sasa
                                                                        successful leaching of

                                 2015, completed $13m Stage
                                                                        Western Dumps
                                                                                                                                2018
                                 1 Expansion to increase
                                 annual copper production to
                                 current 13,000-14,000t                                          2017
April 2012, Kounrad $39m SX-EW
plant commissioned with                                        2015
10,000t production capacity,
copper production from Eastern                                                               2017, completed $13m                      $129m paid to
Dumps commenced                                                                              Stage 2 Expansion to                      shareholders in
                                  2012                                                       extend site infrastructure                dividends
                                                                                             to enable leaching of                     (77p/share)
                                                                                             Western Dumps

                                   2012, instigated
                                   dividend policy
              2010

       2010, AIM IPO raised
       $60m at 96p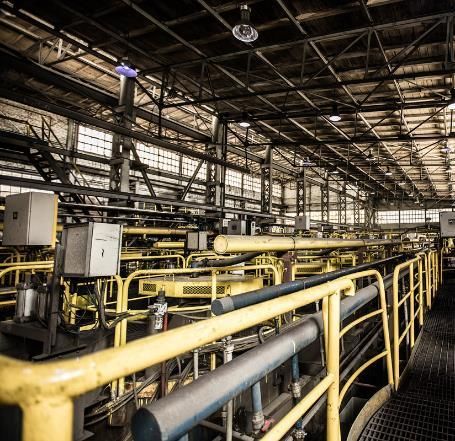
4
                                                         CENTRA L A SIA META LS PLC
                                                        BUILDING A BIGGER BUSINESS

                          2017 PERFORMANCE AND UPDATE

▪ Total 2017 dividend 16.5p (2016: 15.5p), includes proposed final
  dividend 10p (2016: 10p)                                                  2017 Cu production         2017 revenue
▪ Lynx Resources acquisition, CAML 100% owner Sasa mine, Macedonia          14,103t                    $106.5m
▪ Record Kounrad copper production 14,103t (2016: 14,020t)
                                                                            2016: 14,020t              2016: $69.3m
▪ CAML attributable Sasa production (2 months)
  ‒ Zinc 3,625t
  ‒ Lead 4,951t                                                             2017 Sasa Zn production    2017 adjusted EBITDA
▪ Group gross revenue $106.5m (2016: $69.3m)                                21,585t                    $66.4m*
  ‒ Kounrad $86.5m                                                                                     *Unadjusted EBITDA $53.8m, adjusted EBITDA excludes
                                                                                                       Lynx Resources acquisition costs of $12.6m
  ‒ Sasa $20.0m                                                             CAML attributable 3,625t   2016: $39.9m
▪ Adjusted EBITDA $66.4m (2016: $39.9m), margin 62% (2016: 58%)
▪ Net debt 31 December 2017 $138.9m (2016: net cash $40.3m)                 2017 Sasa Pb production    2017 dividend
▪ Q1 2018 production                                                        29,881t                    16.5p*
  ‒ Copper 3,070t                                                                                      *includes proposed 10p final dividend

  ‒ Zinc 5,518t                                                             CAML attributable 4,951t   2016: 15.5p
  ‒ Lead 7,020t
▪ 2018 production guidance
  ‒ Copper 13,000-14,000t
  ‒ Zinc 21,000-23,000t
  ‒ Lead 28,000-30,000t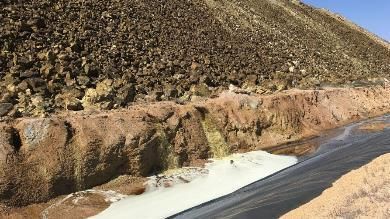
5
                                                                                                         CENTRA L A SIA META LS PLC
                                                                                                        BUILDING A BIGGER BUSINESS

                                                       SHARE PRICE AND SHAREHOLDERS
             350                                                                                                  12,000                                         350

             300                                                                                                                                                 300
                                                                                                                  10,000

             250                                                                                                                                                 250
                                                                                                                  8,000

                                                                                                                                               Share price (p)
Share price (p)

                                                                                                                           Copper ($/t)
             200                                                                                                                                                 200
                                                                                                                  6,000
             150                                                                                                                                                 150

                                                                                                                  4,000
             100                                                                                                                                                 100

                                                                                                                  2,000                                          50
                  50

                  0                                                                                                0                                              0
                  Sep 10Mar 11Sep 11Mar 12Sep 12Mar 13Sep 13Mar 14Sep 14Mar 15Sep 15Mar 16Sep 16Mar 17Sep 17Mar 18                                                Sep 10   May 11   Jan 12   Sep 12   May 13   Jan 14   Sep 14   May 15   Jan 16   Sep 16   May 17   Jan 18
                                                           Copper ($/t)        CAML                                                                                                     CAML               FTSE AIM All Share / Basic Resources (Rebased)

           Share price (CAML:AIM)                                                                          £2.92*                             Shareholders                                                                No. shares                    % holding
           Total no. voting shares                                                                     175,986,619                            FIL Investment International                                                         15,681,518                            8.91

           Treasury shares                                                                                   511,647                          Orion Co-Investment III                                                              15,278,528                            8.68

                                                                                                                                              Hargreave Hale                                                                       14,446,409                            8.21
           Issued shares                                                                               176,498,266
                                                                                                                                              JO Hambro Capital Management                                                         12,954,896                            7.36
           Market capitalisation                                                                               £515m
                                                                                                                                              BlackRock Investment Management                                                      12,325,572                            7.00
           Free float                                                                                              96%
                                                                                                                                              Majedie Asset Management                                                              9,770,799                            5.55
           Average daily volume                                                                                  0.6m                         Acadian Asset Management                                                              5,426,493                            3.08
           *as closed on 21 May 2018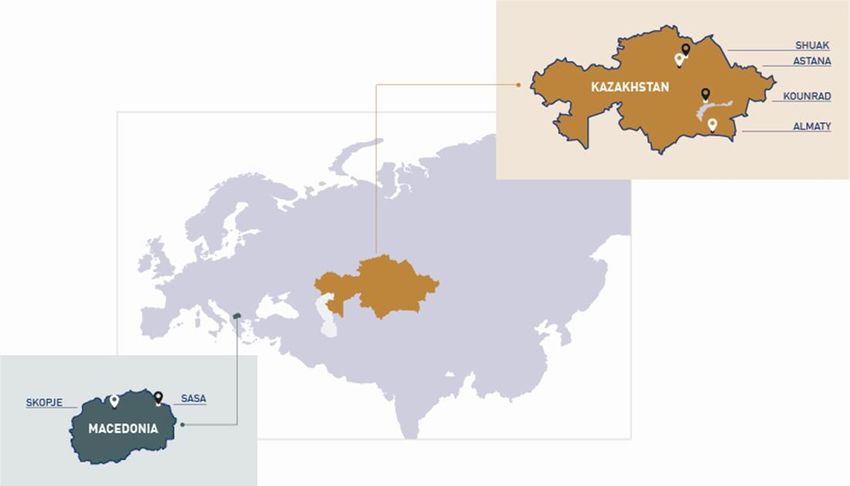
6
                                                          CENTRA L A SIA META LS PLC
                                                         BUILDING A BIGGER BUSINESS

                         CAML SUMMARY FINANCIAL PERFORMANCE

                                                    Total            2017        2016     2015     2014     2013       2012
                                                (68 months)   (Sasa 2 months)                                       (8 months)

Kounrad production, Cu tonnes                    68,425            14,103       14,020   12,071   11,136   10,509     6,586

Sasa payable production, Cu eq. tonnes             3,333            3,333            -        -        -        -           -

Group total, Cu eq. payable tonnes               71,758            17,436       14,020   12,071   11,136   10,509     6,586

Average Cu sale price, $/t                         6,390            6,107        4,994    5,336   6,794    7,114      7,935

Copper C1 cash cost, $/lb                           0.58              0.52        0.43     0.60    0.62      0.66      0.63

Zinc C1 cash cost, $/lb                             0.44             0.44*           -        -        -        -           -

Group revenue, $m                                  446.8            106.5         69.3     67.3    76.6      76.0      51.1

Group adjusted EBITDA, $m                          268.4              66.4        39.9     34.9    47.3      48.1      31.8

Group adjusted EBITDA margin                         60%               62%        58%      52%      62%      63%        62%

Dividend/share buy-back, $m                        129.1              33.6        21.6     20.3    21.8      15.6      16.2

*calculated on a 12 month 2017 basis for Sasa
7
CENTRA L A SIA META LS PLC
BUILDING A BIGGER BUSINESS
DELIVERING SHAREHOLDER VALUE
140
2017 dividend 16.5p 2018 dividend policy
$129m
“CAML will return to shareholders a target
120
100
80 range of between 30% and 50% of free
cash flow, defined as net cash generated
$m
60
40
from operating activities less capital
expenditure”
20
0
2012 2013 2014 2015 2016 2017
Cumulative shareholder returns
TSR CAGR since IPO
320
Central Asia Metals 24.0%
$153.5m equity placing
Share price (p/share)
300 for Sasa acquisition Boliden 21.6%
Lundin Mining 7.6%
280 Antofagasta 1.6%
FTSE 350 Mining 0.8%
260
OZ Minerals 0.5%
240 Atalaya (3.1%)
Trevali (4.0%)
220 KAZ Minerals (4.1%)
Hudbay Minerals (5.1%)
200
Capstone Mining (14.5%)
01/2017 04/2017 07/2017 10/2017
Source: Peel Hunt8
CENTRA L A SIA META LS PLC
BUILDING A BIGGER BUSINESS
KOUNRAD, PRODUCTION UPDATE AND OUTLOOK
Copper production 4.5 80
Cumulative copper production (kt)
4.0 70
Quarterly copper production (kt)
▪ 2017 copper production 14,103t 3.5
60
3.0
▪ Q1 2018 copper production 3,070t 2.5
50
40
2.0
▪ Total copper production to end Q1 2018, 71,496t 1.5
30
20
▪ Western Dumps leaching commenced Q2 2017, 1.0
7,868t copper recovered to end Q1 2018 0.5 10
0.0 -
2012 2013 2014 2015 2016 2017 2018
Outlook
▪ FY 2018 production guidance 13,000t to 14,000t
▪ 2018, 65% copper production to come from Western
Dumps (2017, 40%)
‒ Q1 2018, 75%
▪ Increasing percentage of Western Dumps copper
production from 2019 onwards9
CENTRA L A SIA META LS PLC
BUILDING A BIGGER BUSINESS
SASA, PRODUCTION UPDATE AND OUTLOOK
Zinc and lead production 2017 CAML
Units Q1 2018 2017 2016
attributable
▪ Underground ore production 792,068t
Ore mined t 192,372 134,063 792,068 782,823
▪ Zinc production 21,585t
Plant feed t 196,364 132,012 793,332 779,231
▪ Lead production 29,881t Lead grade % 3.83 3.98 3.98 3.95
▪ CAML attributable 2017 production Zinc grade % 3.32 3.21 3.18 3.41
‒ Zinc 3,625t Lead concentrate t (dry) 9,587 6,784 40,757 39,507
‒ Lead 4,951t - Recovery % 93.3 94.2 94.6 94.1
- Grade % 73.2 73.0 73.3 73.3
▪ Q1 2018 zinc production 5,518t
- Contained lead t 7,020 4,951 29,881 28,955
▪ Q1 2018 lead production 7,020t
Zinc concentrate t (dry) 11,385 7,394 43,676 45,548
2018 outlook - Recovery % 84.6 85.7 85.5 84.6
▪ 2018 zinc production guidance 21,000t to 23,000t - Grade % 48.5 49.0 49.4 49.4
▪ 2018 lead production guidance 28,000t to 30,000t - Contained zinc t 5,518 3,625 21,585 22,51510
CENTRA L A SIA META LS PLC
BUILDING A BIGGER BUSINESS
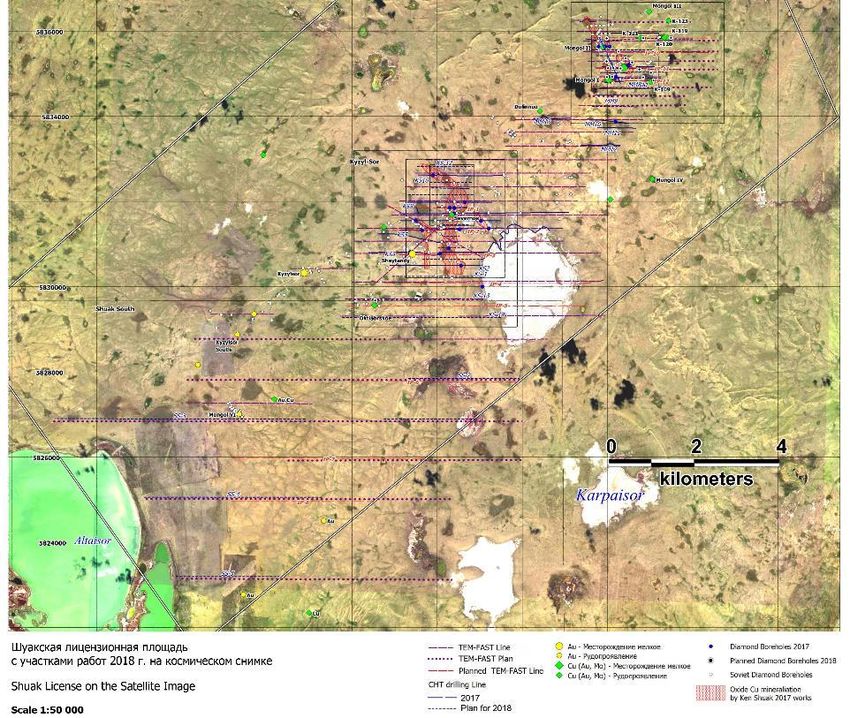
SHUAK, OVERVIEW
$1.5m 2017 exploration
programme complete
▪ CHT drilling programme,
17,530m
▪ Diamond drilling programme,
5,242m
▪ All diamond drilling lab results
and CHT results received
▪ New areas of oxide
mineralisation identified at
Kyzyl-Sor
▪ Encouraging intercepts of
sulphide mineralisation at
Mongol V and Mongol I-II, gold
and molybdenum also identified
▪ 2018 exploration programme
commenced in May11
CENTRA L A SIA META LS PLC
BUILDING A BIGGER BUSINESS
BOARD OF DIRECTORS12
CENTRA L A SIA META LS PLC
BUILDING A BIGGER BUSINESS
OUTLOOK
▪ Two low cost, low capex operations
in prospective jurisdictions, plus
exploration potential in Shuak
▪ Exposure to three base metals with
attractive fundamentals – copper,
zinc and lead
▪ Attractive cash flow based dividend
policy
▪ Sasa integration on track, cautiously
looking for new opportunities
▪ Senior management changes
‒ Nigel Robinson, CEO
‒ Gavin Ferrar, CFO
▪ Q1 2018 production demonstrates
both operations on track to meet
2018 guidance
‒ Copper 13,000-14,000t
‒ Zinc 21,000-23,000t
‒ Lead 28,000-30,000t13
CENTRA L A SIA META LS PLC
BUILDING A BIGGER BUSINESS
INVESTOR RELATIONS CONTACT
Louise Wrathall
11 Albemarle Street
London
W1S 4HH
louise.wrathall@centralasiametals.com
Tel: +44 (0) 20 7898 9001
www.centralasiametals.comYou can also read