2018 Crowe Branch Benchmarking Survey Highlights - July 2018
←
→
Page content transcription
If your browser does not render page correctly, please read the page content below

July 2018

2018 Crowe Branch
Benchmarking
Survey Highlights

Audit / Tax / Advisory / Risk / Performance   Smart decisions. Lasting value.™
2018 Crowe Branch Benchmarking
Survey Highlights

The 2018 Crowe Branch Benchmarking
Survey includes detailed information on a
total of 457 branches from 13 banks. The
participating banks represented a cross section
of the industry by size and demographic.

                     The survey results provide metrics and
                     benchmarks for branch productivity and
                     account portfolios, as well as information
                     on staffing levels and uses of technology.
                     The survey was conducted in the first
                     quarter of 2018 and gathered 12-month
                     performance numbers for each branch.
                     The following are several observations that
                     showcase the trends and comparisons
                     evident in the survey results.

2                    July 2018                                     Crowe LLP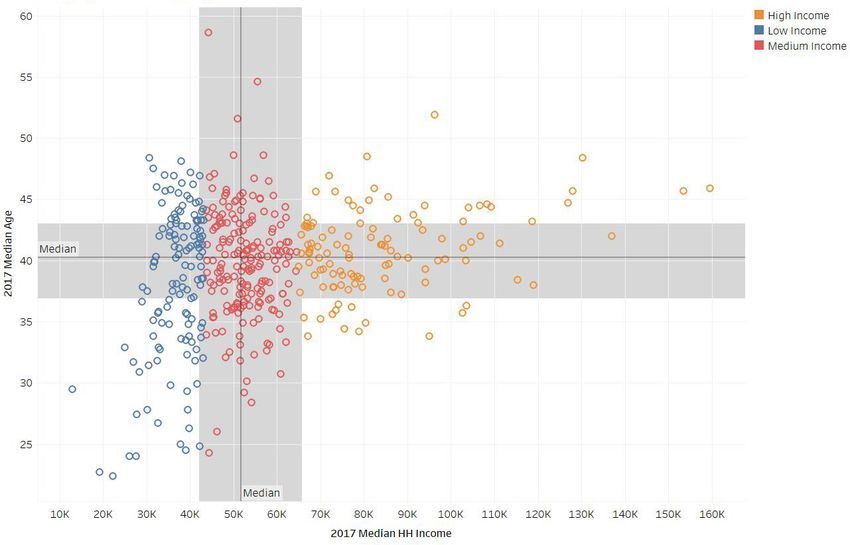
2018 Branch Survey Participants
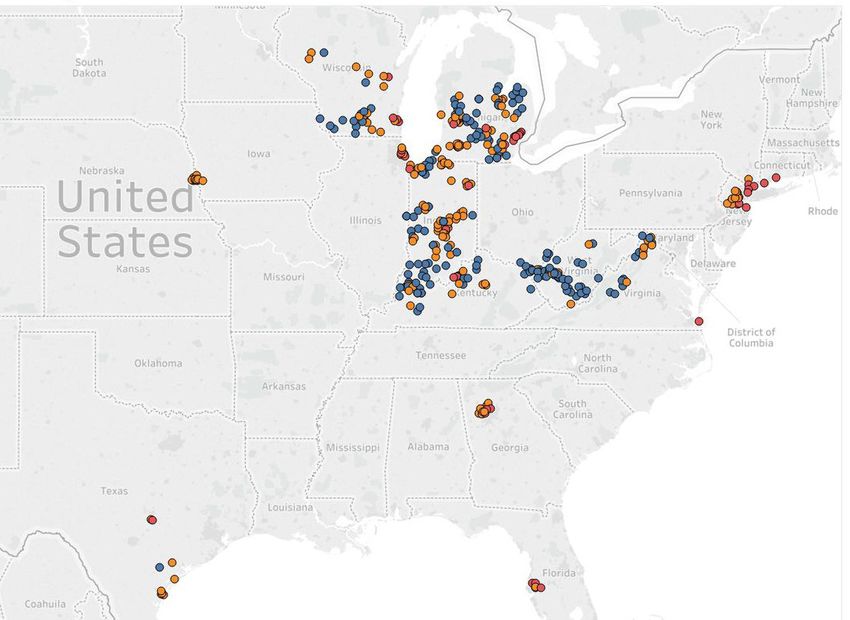
In the map in Exhibit 1, the 2018 branch locations are classified based on the
population of the trade area in which they reside. Populations less than 50,000
are categorized as rural, those between 50,000 to 100,000 are categorized as
suburban, and those greater than 100,000 are categorized as urban.
Exhibit 1: Branch Locations
As illustrated in Exhibit 1, the 457 branches included in this year’s survey represent a wide
range of locations across the Midwest, the East Coast, and the South. These branches also
denote a diverse range of municipalities within these regions in terms of population size and
demographics. The participating branches reside in cities with populations that range from
4,000 to 4 million. Additionally, median household income in these cities ranges from around
$13,000 to $160,000. Because many institutions tailor their operations to the surrounding
demographics, this diversity allows the collected data to better represent of all types of
institutions and serve as a better means of analyzing and comparing industry trends.
crowe.com 3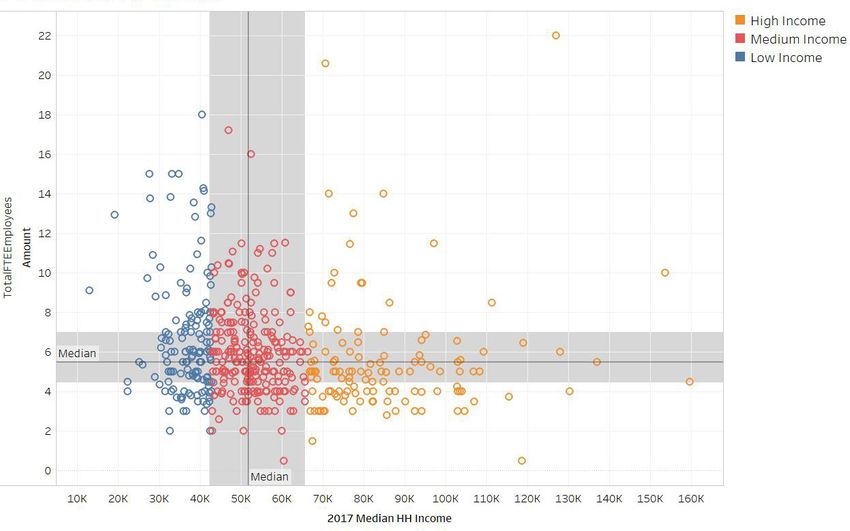
2018 Crowe Branch Benchmarking
Survey Highlights

                     The scatter plots in Exhibit 2 further breakdown the median age of employees relative
                     to median household income in each of the trade areas. This illustration is intended
                     to give additional perspective on the range of institutions and branches included
                     in the study. Branches were classified based on the median household income of
                     their individual trade area. The median one-third of branches fell within the $42,000
                     to $66,000 range for median household income. The other groupings were the
                     remaining branches that had higher or lower median household income levels.

                     Exhibit 2: Branches by Median Household Income
                     and Median Age of Branch Employees
                       Median Age of Branch Employees

                                                        Median Household Income

                     Exhibit 3 is a scatter plot of all branches by total full-time equivalent (FTE)
                     employees and median household income in their respective locations.

                     Exhibit 3: Branches by Median Household Income and FTE Numbers
                               Total FTE Employees

                                                        Median Household Income

4                    July 2018                                                    Crowe LLP
Branch Productivity
From 2016 to 2018, branch staff and productivity trends show an increase in the
use of universal bankers and a slight increase in overall branch FTEs. This branch
staff increase is a reflection of an increase in personal deposit account openings.
Additionally, branch traffic has risen, with the median and average amount of teller
transactions increasing in the two-year period. With more accounts opening, more
transactions being processed, and teller staff decreasing, technology and the use of
the universal bankers plays a pivotal role in an institution’s success (Exhibit 4).
Exhibit 4: Branch Productivity
Percent
Metric 2016 2018 Change
Branch FTEs 5.5 6 9.1%
Desk staff FTEs 1.5 2 33.3%
Teller FTEs 3 2 -33.3%
Universal banker FTEs 1 2 100.0%
Monetary teller transactions per teller FTE 14,223 27,340 92.2%
New personal checking accounts per total FTEs 18.5 28.3 53.0%
New personal savings & money market accounts per 10.5 12.1 15.2%
total FTEs
New personal certificate of deposit (CD) accounts per 2.2 4 81.8%
total FTEs
New home equity loans per total FTEs 0.7 1.8 157.1%
Note: All figures are rounded to the nearest tenth
crowe.com 52018 Crowe Branch Benchmarking
Survey Highlights
Business Accounts
Businesses tend to be opening more checking and CD accounts in comparison to
2016. While this remains true, the average account balances of checking, savings,
and CDs have decreased. This might be a result of a higher reinvestment in the
companies. In addition, smaller businesses might need to draw down on their liquidity
more, reducing balances (Exhibit 5). Another possibility is that people are starting
more new businesses, which have less savings than well-established businesses.
Exhibit 5: Business Accounts
Percent
Metric 2016 2018 Change
New business checking accounts per total FTEs 3.8 4.9 29.0%
New business savings & money market accounts 0.4 0.3 -25.0%
per total FTEs
New business CD accounts per total FTEs 0.2 0.4 100.0%
Average business checking account balance $36,800.87 $27,598.67 -25.0%
Average business CD account balance $44,406.86 $30,162.50 -32.1%
Average business savings & money market $107,766.74 $41,118.60 -61.8%
account balance
Note: All nonmonetary figures are rounded to the nearest tenth.
Checking, Savings, and CD Balances
Personal deposit account balances have grown as the total number of accounts increased
from 2016 to 2018. Continued economic growth and a falling unemployment rate are likely
behind the increases in personal account balances over the past several years (Exhibit 6).
Exhibit 6: Checking, Savings, and CD Balances
Percent
Metric 2016 2018 Change
Average personal checking account balance $5,742.22 $6,686.73 16.5%
Average personal savings & money market $12,043.68 $13,603.25 13.0%
account balance
Average personal CD account balance $26,133.13 $27,659.30 5.8%
Note: All nonmonetary figures are rounded to the nearest tenth.
6 July 2018 Crowe LLPNonbranch Channels Help Drive Account Openings
In 2018, the beneficial effects of enhanced employee flexibility and product accessbility
are confirmed by new deposit account and loan metrics. Accessibility can be defined
as the number of channels a customer has to either open an account or apply for
a loan. Because of changing technology and heightened consumer expectations,
institutions around the country are beginning to be more flexible with product
offerings and the processes by which products and services are obtained.
Exhibits 7 and 8 show the increase in account opening and growth relative to
customers’ access to the products.
Exhibit 7: Accounts Opened per Branch
450
400 Call Centers can open accounts
350 Call Centers cannot open
300
250
200
150
100
50
0
New Personal New Personal New Personal Savings
Certificates of Deposit Checking Accounts & MMDA Accounts
When compared with those that do not allow call center representatives to open deposit
accounts, branches that do allow this have larger new account growth numbers. Specifically,
the number of new personal CD, free checking, and savings and money market accounts was
significantly higher at the institutions with call centers that have the ability to open accounts.
Technology and ease of access are primary components of a satisfied customer base,
and giving potential customers the ability to remotely set up new accounts has a large
impact on acquisition rates. This conclusion is further supported by looking at new
account growth in institutions that have online account opening capabilities (Exhibit 8).
crowe.com 72018 Crowe Branch Benchmarking
Survey Highlights
Exhibit 8: Accounts Opened per Branch
180 Can open accounts online
160 Cannot open accounts online
140
120
100
80
60
40
20
0
New Personal New Personal New Personal Savings
Certificates of Deposit Checking Accounts & MMDA Accounts
A similar effect is seen in new account growth by institutions offering online
account openings. In order to capture a younger generation of banking
customers, digital banking capabilities are a necessary investment, and
giving these customers the ability to open accounts through this channel
increases deposit account growth and keeps institutions competitive.
8 July 2018 Crowe LLPBank Productivity When Incentives
Are Tied to Metrics
In this year’s survey, 61 percent of banks had incentive plans for their
branches tied to metrics, and the remaining banks either had no incentive
plans or only an annual bonus. Branches with incentive plans tied to metrics
significantly outperformed those without similar incentive plans.
Exhibit 9: Accounts Opened per Branch
20,000 19,619
Branches that tie incentives to metrics
Branches that do not tie incentives to metrics
15,000
10,000
6,561
5,000
2,969
1,413
711 991
0
New Business New Personal New Personal
Checking Accounts Checking Accounts Savings Accounts
Exhibit 9 shows that tying incentives to metrics motivated branches to
open significantly more accounts. This likely is due to two reasons:
1. When employees are more aware of their performance and can track it, they are able to
continually improve. Employees also tend to work harder when they have goals based
on trackable metrics like meeting sales targets rather than improving sales skills.
2. Having incentives tied to metrics increases the number of referrals brought into institutions.
Referrals can have a significant impact on loan and deposit account growth.
crowe.com 92018 Crowe Branch Benchmarking
Survey Highlights
Branch Manager Approval Authority
While trends are in favor of institutions allowing nonlender branch staff to begin the
lending approval process, only one out of 13 responding banks give their branch
managers some level of business and consumer loan approval authority. This
leads to a lengthier process for the customer, even for small-value consumer loans.
Customer satisfaction is dependent on the ease of the process, so expanding these
approval permissions proves to be beneficial for productivity, although branch
loan authority does require enhanced risk management practices (Exhibit 10).
Exhibit 10: Loan Amounts by Approval Authority of Branch Manager
$1,400,000 Branch staff have loan approval authority
Branch staff have no loan approval authority
$1,200,000 1,151,207
1,061,690
$1,000,000
851,244
$800,000
$600,000
$400,000 338,367
$200,000
0
Dollar Amounts of Personal Dollar Amounts of Personal
Home Equity Loans Installment Loans
10 July 2018 Crowe LLPVideo Displays and Interactive ATMs
Video Display Monitors Interactive Display Monitors
62%
8 out of 13 responding
0%
0 out of 13 responding
banks have video display banks use these monitors
monitors in their branches as interactive displays
Video Interactive ATMs
15%
2 out of 13 responding banks
have video interactive ATMs
Other Notable Highlights
Retail Store Locations Community Group Space
15%
2 out of 13 responding
92%
12 out of 13 responding banks
banks have a branch have space in their branch for
location in a retail store use by community groups
crowe.com 11Learn More Vince Cartolano +1 312 632 6570 vince.cartolano@crowe.com Nick Moore +1 616 233 5658 nicholas.moore@crowe.com Tim Reimink Managing Director +1 616 774 6711 timothy.reimink@crowe.com crowe.com “Crowe” is the brand name under which the member firms of Crowe Global operate and provide professional services, and those firms together form the Crowe Global network of independent audit, tax, and consulting firms. “Crowe” may be used to refer to individual firms, to several such firms, or to all firms within the Crowe Global network. The Crowe Horwath Global Risk Consulting entities, Crowe Healthcare Risk Consulting LLC, and Crowe Horwath Cayman Ltd. are subsidiaries of Crowe LLP. Crowe LLP is an Indiana limited liability partnership and the U.S. member firm of Crowe Global. Services to clients are provided by the individual member firms of Crowe Global, but Crowe Global itself is a Swiss entity that does not provide services to clients. Each member firm is a separate legal entity responsible only for its own acts and omissions and not those of any other Crowe Global network firm or other party. Visit www.crowe.com/disclosure for more information about Crowe LLP, its subsidiaries, and Crowe Global. The information in this document is not – and is not intended to be – audit, tax, accounting, advisory, risk, performance, consulting, business, financial, investment, legal, or other professional advice. Some firm services may not be available to attest clients. The information is general in nature, based on existing authorities, and is subject to change. The information is not a substitute for professional advice or services, and you should consult a qualified professional adviser before taking any action based on the information. Crowe is not responsible for any loss incurred by any person who relies on the information discussed in this document. © 2018 Crowe LLP. FS-19011-001A
You can also read