Point-in-Time Count 2018 - District of Columbia Continuum of Care for the - The Community Partnership for the ...
←
→
Page content transcription
If your browser does not render page correctly, please read the page content below
2018
                Point-in-Time
                   Count
                                for the
                District of Columbia
                Continuum of Care

Published by:
The Community Partnership for the Prevention of Homelessness;
Policy & Programs Team
April 2018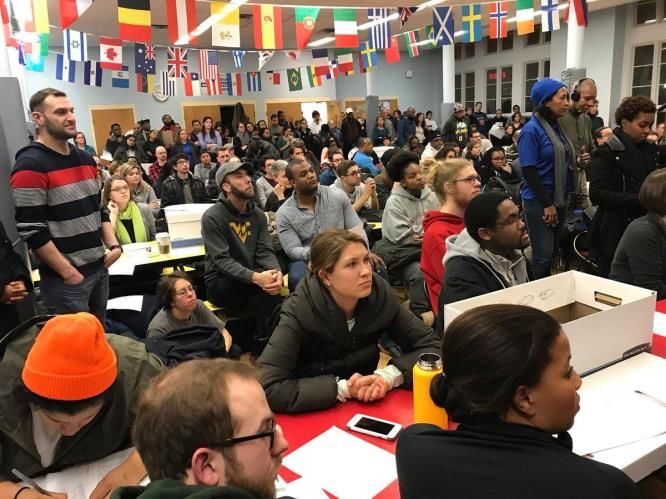
• Point-in-Time (PIT) Count Review

Presentation   • PIT Results:

 Overview         • Population Totals
                  • Changes Over Time
                  • Demographics
                  • Experiences and Characteristics
                  • Sub Populations
               • Count of Formerly Homeless
                 Persons
WHAT is the PIT Count?
• The Point-in-Time Count or “PIT Count” creates a            Creates a Snapshot
  snapshot of the scope and scale of homelessness in the      of Homelessness in
  District at a single point in time.                             the District

• Required of every community that receives federal
  homelessness assistance funds from the U.S. Dept. of         Secures Funding
  Housing and Urban Development (HUD).
• The Community Partnership (TCP) has coordinated and         Aids Local Planning
  conducted the count on behalf of the District of Columbia         Efforts
  Continuum of Care since 2001.
• PIT Data is used locally to plan programs, allocate           Helps Us Track
  funding, track progress toward goals outlined in                Progress
  Homeward D.C., and better meet the needs of our
  homeless neighbors.                                           Makes Us More
• HUD provides a few guidelines for conducting a PIT          Efficient In Meeting
  Count, but every community develops its own                         Goals
  methodology for implementation.

                                                                                     3
WHO is Counted?
HUD requirement: A complete count of HUD-defined “literally homeless”
 families and individuals:

• Literally homeless:
    1. Unsheltered (i.e. persons “on the street”);
    2. Staying in Emergency Shelter (severe weather, low barrier or temporary); or
    3. Staying in Transitional Housing facilities.
     Note: This does not include persons who are “doubled-up” or who are temporarily residing in
    institutional settings, i.e. hospitals, jails, treatment facilities, foster care, etc.

• Household types:
    Family:
          • A group of persons residing together with familial ties and a designated “Head of Household”
    Single:
          • Unaccompanied (single) Adults (18 and older)
          • Unaccompanied (single) Minors (17 and under)

                                                                                                      4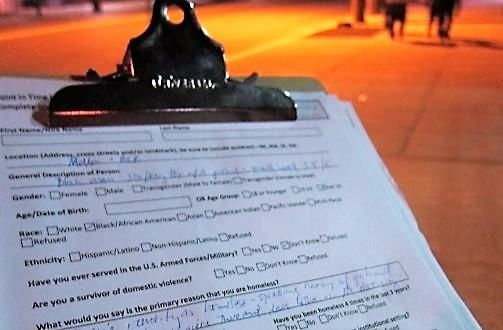
WHEN are People Counted?
HUD requirement: Within a single 24 hour period, typically at night, within
 the last 10 days in January.

    • These requirements are the same for Continuums nationwide, regardless of climate.
    • Doing the count in the winter helps CoCs understand utilization of all of their
      Continuum’s resources, including shelter space that is only available during the winter
      months.

                                                                                                5
HOW are People Counted?
TCP’s PIT Methodology is reported on extensively during the HUD Continuum of Care (CoC) funding competition, the District’s
annual application for the renewal of HUD funds; HUD’s scoring of our methodology can account for about a fifth of the
application’s score.
SHELTERED PERSONS – in emergency shelters and transitional housing
programs.
o TCP collects information from every program operating in the
District, regardless of its funding source(s) through:
• HMIS data: Some 90 percent of PIT information comes from
programs that enter into the District’s Homeless
Management Information System (HMIS).
• Tallies and surveys: Agencies that do not enter into the
HMIS use the PIT Count survey to collect data on each
person or family in their programs, in some cases limited
information is provided, but every program provides at least
a tally of the total number of persons served.
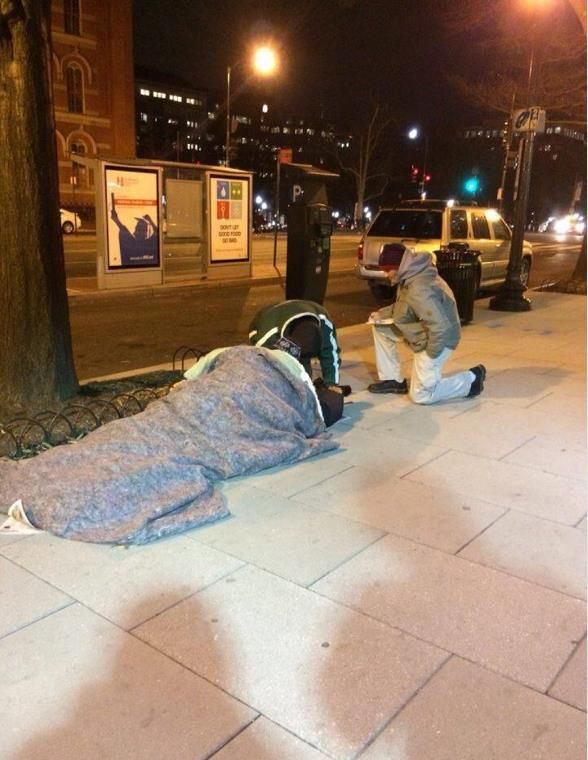
UNSHELTERED PERSONS – staying “on the streets”
o The unsheltered component is conducted through a coordinated
effort between TCP, District and Federal government agencies,
professional outreach teams and volunteers:
• One-night street survey: Volunteers and outreach teams
canvass the District in a coordinated way and survey
individuals sleeping on the streets that night.
• Meal Programs & Drop-in Centers: The day after the street
survey, meal programs and drop-in centers administer the
survey to those engaged services during that time. This is an
attempt to capture individuals missed the night before.
62018 PIT Count Findings: Population Totals
2018 PIT Findings: Totals
• On January 24th, 6,904 people were experiencing homelessness in the
  District of Columbia, about 1 person out of every 100 District residents.

                                           UNSHELTERED: 600 Persons
                                                • 599 Single Adults
                                                • 1 Unaccompanied Minor
                                                • No Families

                                           EMERGENCY SHELTER: 5,095 Persons
                                                •   2,467 Single Adults
                                                •   5 Unaccompanied Minors
                                                •   1,010 Adults in Families
                                                •   1,613 Children in Families

                                           TRANSITIONAL HOUSING: 1,209 Persons
                                                •   695 Single Adults
                                                •   3 Unaccompanied Minors
                                                •   200 Adults in Families
                                                •   311 Children in Families

                                                                                 8
2018 PIT Findings: Totals
• Overall, there has been a 7.6% decrease in people who are experiencing
homelessness in the District from 2017 to 2018.
• The number of families has decreased by 20.8%.
• However, there has been an increase of 5.2% in single person
households.
Household Type 2018 2017 % Change
Total Persons 6,904 7,473 -7.6%
Singles 3,770 3,583 5.2%
Single Adults 3,761 3,578 5.1%
Unaccompanied Minors 9 5 80%
Family Units 924 1,166 -20.8%
Family Members 3,134 3,890 -19.4%
Adults in Families 1,210 1,609 -24.8%
Children in Families 1,924 2,281 -15.7%
92018 PIT Findings: Totals By Year
PIT Count Totals For Single and Family Households, 2014 – 2018
3953
3821 3770
3683 3583
1491
1231 1131 1166
924
2014 2015 2016 2017 2018
Single Households Family Households
102018 PIT Count Findings: Demographics
Demographics: Age

         Age Ranges of Single Adults and Adults in Families
                                                                                          • Singles:
                       44.8%
                                                                                              • Median Age: 51 years old
                                                                                              • Oldest Adult: 89 years old
                                                                                              • Unaccompanied Minors: All
       27.3%                                                                                    between the ages 13 – 17
                                                25.3%

                                        19.0%
                                                                22.0%
                                                                                          • Families:
                                                                            16.6%
                                15.6%                                                         • Median Age (Adults): 29
               12.3%
                                                                                                years old
8.2%                                                 7.1%
                                                                                              • Oldest Adult: 83 years old
                                                                     1.6%
                                                                                 0.3%
                                                                                              • Median Age of Children in
Age 18 to 24 Age 25 to 34 Age 35 to 44 Age 45 to 54 Age 55 to 61            62 and over         Families: 5 years old
                               Single Adults    Adults in Families

                                                                                                                        12
Demographics: Race & Ethnicity
• PIT data shows that persons who Race* of Single Adults and Adults in Families
are African Americans are
disproportionately affected by Multiple Races 0.3%
1.0%
the drivers of homelessness in
2.1%
the District. White
11.3%
• 88.4% of adults who are Pacific Islander/Hawaiian Native 0.3%
0.2%
experiencing homelessness are
97.0%
Black/African American, yet only Black/African American
85.6%
47.7% of District residents are 0.1%
Asian
Black/African American. 1.0%
• Additionally, 6.3% of single American Indian/Alaskan Native 0.2%
0.9%
adults and 3.1% of adults in
families identify as Hispanic or Adults in Families Single Adults
Latino.
*Race categories are single-race only, persons who selected
multiple races are counted in the “Multiple Races” category.
† https://www.census.gov/quickfacts/DC
13Demographics: Gender
• Men make up 72.1% and women make up 26.8% of all single adults.
Additionally, 0.7% are trans female (FTM)*, 0.2% are trans male (FTM)*,
and the remaining 0.2% are gender non-conforming.
• Women make up the greatest share of all adults in family households,
at 78.5% and make up 92.6% of family heads of household.
Gender, Single Adults Gender, Adults in Families
0.2% 0.2% 0.7%
21.5%
26.8%
72.1%
78.5%
*Includes those persons who self-identified as trans MTF and FTM or those who choose to select a different gender assigned to them at birth
from their current gender identity. Others may be counted in “Male” or “Female” if they did not specifically identify as trans or did not
provide information about the gender assigned to them at birth. 14Disabilities and Health Conditions:
By Household Type
Single Adults in Total
Disabling Conditions
Adults Families (All Adults)
Chronic Substance Abuse (CSA)* 30.4% 1.7% 23.4%
Severe Mental Illness (SMI)* 32.4% 7.4% 26.3%
Dual Diagnosis (subset living with
14.5% 1.2% 11.3%
both CSA & SMI)
Chronic Health Problem 24.6% 1.5% 19.0%
Developmental Disability 4.9% 1.5% 4.0%
Physical Disability 18.0% 3.1% 14.4%
Living with HIV/AIDS 4.0% 0.2% 3.1%
* CSA & SMI are not mutually-exclusive and include those with both (Dual Diagnosis).
15Disabilities and Health Conditions:
By Gender (Singles)
Single Single Total
Disabling Conditions
Women† Men† Singles†
Chronic Substance Abuse (CSA)* 19.7% 33.2% 30.4%
Severe Mental Illness (SMI)* 44.8% 28.2% 32.4%
Dual Diagnosis (subset living with
16.3% 14.0% 14.5%
both CSA & SMI)
Chronic Health Problem 26.3% 23.2% 24.6%
Developmental Disability 5.6% 4.8% 4.9%
Physical Disability 20.3% 17.2% 18.0%
Living with HIV/AIDS 3.9% 4.0% 4.0%
* CSA & SMI are not mutually-exclusive and include those with both (Dual Diagnosis).
† Single Women, Men, and Total Singles are adults only and do not include unaccompanied minors.
162018 PIT Count Findings: Experiences & Characteristics
Lifetime Experiences:
                                     By Household Type
                                                                                       Single                 Adults in                  Total
          Experiences & Characteristics
                                                                                       Adults                 Families                (All Adults)
Domestic Violence (DV) History                                                            19.0%                   33.6%                     22.6%

        Homeless Due to DV (subset of those w/ DV History)                                38.1%                   55.5%                     44.4%

Formerly resided in Institutional Setting*                                                49.6%                   22.2%                     43.0%

        Became homeless at discharge from Institutional
        Setting (subset of those formerly residing Institutional                          60.6%                   59.1%                     60.4%
        Settings)

Formerly in Foster Care                                                                    8.4%                   11.4%                      9.1%
U.S. Military Veteran                                                                      8.0%                    0.3%                      6.2%

        Female Veterans (subset of veterans who are female)                               10.1%                   50.0%                     10.2%

Chronically Homeless                                                                      51.4%                   19.3%                     43.4%
Limited English Proficiency                                                                4.0%                    1.7%                      3.4%

 * Institutional settings include: foster care, juvenile justice, and adult justice systems; residential detox/rehabilitation; residential mental health
 institutions; and long-term hospital stays.
 † Chronically homeless includes those persons who have been experiencing homelessness for a year or more in total, either continuous or 4
 episodes in the past 3 years, AND have a disabling condition.

                                                                                                                                                           18
Lifetime Experiences:
By Gender (Singles)
Single Single Total
Experiences & Characteristics
Women‡ Men‡ (Singles)‡
Domestic Violence (DV) History 39.5% 10.6% 19.0%
Homeless Due to DV (subset of those w/ DV History) 43.9% 31.2% 38.1%
Formerly resided in Institutional Setting* 36.9% 51.1% 49.6%
Became homeless at discharge from Institutional
Setting (subset of those formerly residing Institutional 56.2% 73.1% 60.6%
Settings)
Formerly in Foster Care 9.4% 7.5% 8.4%
U.S. Military Veteran 3.0% 9.9% 8.0%
Chronically Homeless† 50.5% 51.7% 51.4%
Limited English Proficiency 3.6% 4.2% 4.0%
* Institutional settings include: foster care, juvenile justice, and adult justice systems; residential detox/rehabilitation; residential mental health
institutions; and long-term hospital stays.
† Chronically homeless includes those persons who have been experiencing homelessness for a year or more in total, either continuous or 4
episodes in the past 3 years, AND have a disabling condition.
‡ Single Women, Men, and Totals are adults only and do not include unaccompanied minors.
19Income: Benefits and Employment
Single Adults in Total
Income & Employment
Adults Families (All Adults)
Receives Income 75.9% 80.2% 77.0%
Employed 21.5% 33.6% 24.0%
Primary Source of Income*
Employment 34.0% 26.0% 31.8%
Pension/Retirement, including SS 4.8% 0.0% 3.4%
SSI/SSDI/Disability/VA Disability 32.9% 12.1% 27.1%
TANF/Public Assistance/WIC 23.2% 57.4% 32.7%
Other 5.1% 4.5% 5.0%
* Primary Source of Income is out of total number of people receiving some type of income.
202018 PIT Count Findings: Sub-Populations
Families
• Count of families in ES and TH down by 21 percent from last year, and
  down 38 percent from peak in 2016 (after year round access was
  implemented)

• Families experiencing chronic homelessness is down 53 percent from
  2017 alone

• Inflow into the system has normalized due to year-round access and
  prevention resources

• Exits are happening in greater numbers and more quickly than in
  previous years – 520 families exited ES to some type of permanent
  destination between PIT 2017 and 2018

                                                                          22
Singles • Count of unaccompanied individuals (“singles”) is up 5% and number of persons experiencing chronic homelessness is up 8% from 2017 • Increase is despite CAHP system housing some 1200 singles between PIT 2017 and 2018 • Inflow continues to be a challenge – analysis being conducted to understand extent to which people are newly entering, episodically experiencing homelessness, or returning to shelter after being housed. • Low barrier shelter model, right to shelter during winter intended to ensure health and safety for District residents, but lack of similar support regionally means District sees at least some inflow from surrounding counties and beyond 23
Veterans
• Between PIT 2014 and PIT 2018 the District saw a 25% decrease in
  homelessness among veterans due to increased housing resources and
  tireless efforts of the District’s CAHP teams to place veterans into
  permanent housing.

• Despite the net decrease since 2014, there was a 7% increase since last
  year.

• Even with a slight increase, the District’s CAHP efforts housed 449
  veterans in the past year.

• Increase is due to the high level of inflow; 120 new veterans, on average,
  access services in the District every month.

• Additional efforts to improve data on this population (i.e., ensuring the
  system identifies every Veteran) may have also contributed to this year’s
  increase.                                                                 24
Youth
• “Youth” refers to:
    o Unaccompanied (single) transitional age youth (TAY), 18 to 24 years old;
    o Unaccompanied (single) minors, 17 years old and younger without a parent
      or guardian;
    o Families with a TAY head of household; or
    o Families with a minor head of household – note: no minor headed
      households were counted in 2018.
• Count of Youth increased by 36 percent from 2017.
   o PIT count has historically not been as accurate a tool for
     unaccompanied youth, who often opt out of the adult shelter
     system, choosing to couch surf or otherwise remain more hidden
     from the public eye.
   o New programmatic resources for youth mean more youth are now
     accessing available services, and therefore being counted as HUD-
     defined “literally homeless” (and thus captured in the PIT).

                                                                             25
Permanent
Housing
for
Formerly
Homeless
PersonsFormerly Homeless Persons
• Another component of the PIT Count is a count of formerly homeless
persons.
• Individuals must be residing in PSH, RRH, and other permanent
housing to be counted; this is not a count of everyone that has exited
the Continuum.
27Permanent Housing 2018
Units for Units for
Beds in
Housing Type Single Family
Family Units
Households Households
Permanent Supportive Housing (PSH) 3,235 1,346 5,134
Rapid Rehousing (RRH) 80 1,711 5,220
Other Permanent Housing 1,515 961 2,689
Total 4,830 4,018 13,043
28Special Thanks!
Partners:
Capitol Hill United Methodist Church
DC Department of Human Services (DHS) Eric Schneider
DC Interagency Council on Homelessness (DCICH) Ger Skerrett
Executive Office of the Mayor, Muriel Bowser Gunther Stern
First Congregational United Church of Christ Heather Styer
Pathways to Housing Jerod Lee
Strong John Thomson Elementary School Jill Carmichael
Joel Hanson
Kate Baasch
PIT Team Leaders: Lindsey Curtin
Maureen Burke
Abby Sypek Maureen Jais-Mick
Ben Roberts Melvyn Smith
Ben Rowland Molly Herman
Beth Humphries Nathalia Cibotti
Bob Glennon Patrick Costanzo
Brad Friedman Randy Kier
Christine Paukstis Ryan Orth
Christine Elwell Sarah Huelskoetter
Diana Martinez Sari Frankel
Emmanuel Mulwafu Stephanie Lyons
29TCP Contacts
Tom Fredericksen | Chief of Policy & Programs
TFredericksen@community-partnership.org
Jennifer Klein | Analyst
JKlein@community-partnership.org
Elisabeth Young | Analyst
EYoung@community-partnership.org
This information is off-the-record and cannot be quoted or otherwise distributed. To obtain on-the-record comments or further information, send inquiries
to Media Contact listed below:
Dora Taylor-Lowe, Department of Human Services (DHS): dora.taylor-lowe@dc.gov.
30You can also read