2019 National Hydrologic Assessment - Released on March 21, 2019 - National Weather Service
←
→
Page content transcription
If your browser does not render page correctly, please read the page content below
2019 National Hydrologic Assessment
Released on March 21, 2019
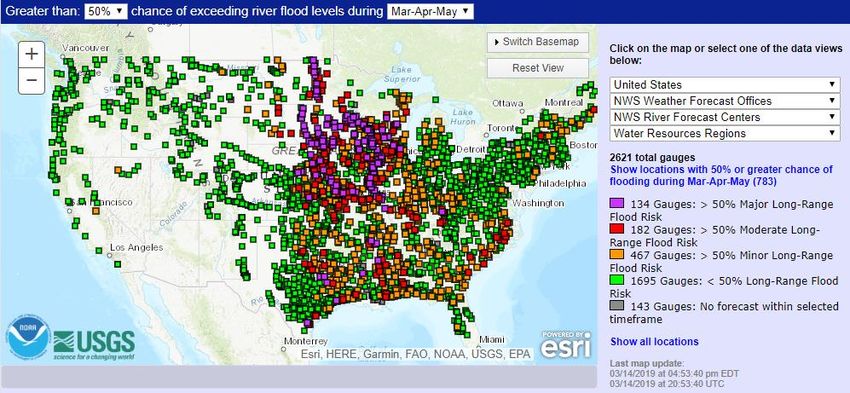
Figure 1: National Spring Flood Risk defined by risk of exceeding Minor, Moderate, and
Major Flood Levels.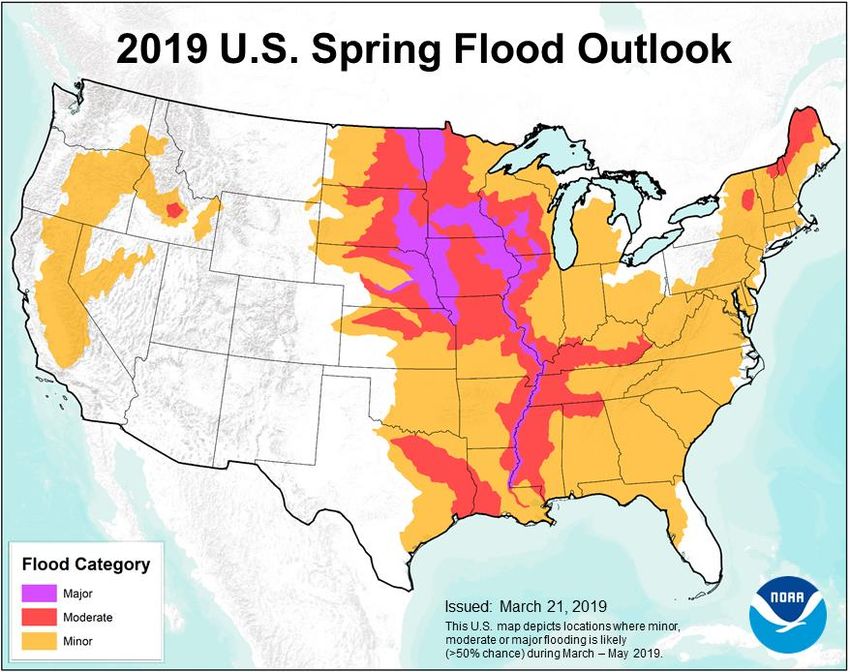
Executive Summary
The 2019 National Hydrologic Assessment offers an analysis of flood risk and water supply for
spring 2019 based on late summer, fall, and winter precipitation, frost depth, soil saturation
levels, snowpack, current streamflow, and projected spring weather. NOAA’s network of 122
Weather Forecast Offices, 13 River Forecast Centers, National Water Center, and other national
centers nationwide assess this risk, summarized here at the national scale.

This winter has brought above to much above normal precipitation to much of the United
States. Several portions of the country received accumulated precipitation exceeding 200% of
average to date. Heavy rainfall mid-February through mid-March brought flooding across much
of the Mississippi River Basin and its tributaries. Heavy rainfall on snow in mid-March brought
significant flooding - including record flooding - to the Lower Missouri River Basin. Additionally,
accumulated snowpack has been higher than normal in the Upper Mississippi Valley, the Plains
of the Missouri River Basin, Red River of the North, and the Great Lakes basins. Basins with an
increased risk of moderate to major flooding are as follows: the Upper, Middle, and Lower
Mississippi River, lower Missouri, Red River of the North, Lower Ohio, Lower Cumberland, and
Tennessee River basins. Additionally, an elevated risk of moderate flooding exists for basins in
the Northeast as follows: the St. John, Penobscot, and Upper Hudson River basins. Minor
flooding is expected across much of the region east of the Mississippi River, as well as the
Pacific Northwest, and Sierra Nevada basins. Minor to isolated moderate flooding is also
projected for the central Idaho tributaries to the Snake River as follows: the Big Lost, Wood,
Upper Boise, Payette, and Weiser River basins.

In Alaska, the spring breakup flood potential is forecast to be normal to below normal. Timing
is expected to be slightly earlier than the median based on lower than normal ice thicknesses
and higher than normal forecast temperatures.

The spring flood outlook for the Mississippi River system is anticipated to create conditions
conducive to hypoxia development and lead to an above average to large hypoxic zone in the
northern Gulf of Mexico this summer. Nutrient loads from river discharge into the Chesapeake
Bay are projected to produce an average hypoxia zone this summer.

Heavy, Convective Rainfall and Flooding
The information presented in this report focuses on spring flood potential, using evaluation
methods analyzed on the timescale of weeks to months, not days or hours. Heavy rainfall at
any time can lead to flooding, even in areas where the overall risk is considered low. Rainfall
intensity and location can only be accurately forecast days in the future, therefore flood risk can
change rapidly. Stay current with flood risk in your area with the latest official watches and
warnings at weather.gov. For detailed hydrologic conditions and forecasts, go to
water.weather.gov.

NOAA’s Long Range River Flood Risk Assessment

       Figure 2: Greater than 50% chance of exceeding minor, moderate, and major river flood
                                  levels during March - April - May

At the request of national partners including the Federal Emergency Management Agency
(FEMA) and the US Army Corps of Engineers (USACE), the National Oceanic and Atmospheric
Administration (NOAA) continues its improved decision support services with the “Long Range
River Flood Risk” web page available at: http://water.weather.gov/ahps/long_range.php. Here,
stakeholders can access a single, nationally consistent map depicting the 3-month risk of minor,
moderate, and major river flooding as shown in Figure 2. This risk information is based on
NOAA’s Ensemble Streamflow Prediction (ESP) forecasts which are generated for approximately
2,600 river and stream forecast locations across the nation. With this capability, stakeholders
can quickly view flood risk predicted to affect their specific area of concern. The Long-Range
River Flood Risk improves the value of the National Hydrologic Assessment by clearly and
objectively communicating flood risk at the local level.
The sections below quantify river flood risk based on the river location having a 50% or more
likelihood of exceeding minor, moderate, or major flood levels. The National Weather Service
(NWS), in coordination with local officials, defines flood levels for each of its river forecast
locations, based on the impact over a given area. The flood categories are defined as follows:
● Minor Flooding: Minimal or no property damage, but possibly some public threat (e.g.,
inundation of roads).
● Moderate Flooding: Some inundation of structures and roads near stream. Some
evacuations of people and/or transfer of property to higher elevations.
● Major Flooding: Extensive inundation of structures and roads. Significant evacuations
of people and/or transfer of property to higher elevations.
● Record Flooding: Flooding which equals or exceeds the highest stage or discharge
observed at a given site during the period of record. The highest stage on record is not
necessarily above the other three flood categories – it may be within any of them or
even less than the lowest, particularly if the period of record is short (e.g., a few years).
Upper Mississippi River, Middle Mississippi River, and the Red River of the North
Basins
The potential for major flooding due to well-above-normal precipitation, snowmelt, saturated
soils, and frozen ground is high compared to its historical average across the Upper Mississippi
River and Red River of the North basins. Numerous break-up ice jams in the region have
already caused significant flooding and will exacerbate flooding conditions throughout the
spring season.
Lower Mississippi River Basin and its Tributaries
The tributaries of the Lower Mississippi River are currently experiencing minor to moderate
flooding, whereas the mainstream Lower Mississippi River is currently experiencing major
flooding. This is expected to continue for the foreseeable future as flood waters move
downstream through the system. Impacts in these areas are being mitigated by local levee
systems and the US Army Corps of Engineers’ operation of the Bonnet Carré Spillway, whose
gates have been operated for the first time in two consecutive years.
In The State of Mississippi, minor to moderate flooding is projected in the Yazoo, Big Black, and
Pearl River basins.Ohio, Cumberland, and Tennessee River Valleys The Cumberland, Ohio, and Tennessee River basins in Kentucky and Tennessee received higher than normal precipitation this winter, leading to enhanced soil saturation levels. Rain is expected to be the main driver behind minor to moderate flooding in the region this spring. In the Tennessee Valley, minor to moderate spring flooding is possible along the tributaries of the Tennessee River. Minor to moderate flooding is likely in the Cumberland, Green, and lower Kentucky River basins. In Indiana and Illinois, minor flooding is expected in the upper Wabash, Little Wabash, White, and Maumee River basins. In eastern Kentucky and eastern Tennessee, minor flooding is likely in the Licking and Big Sandy River basins. In Ohio, minor flooding is likely in the Maumee, Muskingum, Scioto, and Great Miami River basins. In West Virginia, minor flooding is expected in the Monongahela and Kanawha basins. Minor flooding is expected in the middle Ohio River. It should be noted that although the probability of major flooding is lower than 50%, the Cumberland River Basin shows a 5-20% chance of major flooding this spring. Isolated major flooding is possible, especially in western and southern Kentucky and western Tennessee where soils are highly saturated. Missouri River Basin Overall, the spring flood risk is higher than normal for the lower Missouri River Basin, driven by above normal snowpack across the Plains, saturated soil conditions, and the presence of deeply frozen soils. Ice jam flooding has already been reported at many locations this winter. Significant, record breaking flooding is already underway across the Lower Missouri River Basin. A storm system in the middle of March brought 2-4 inches of rain across the already saturated area. The combined effects of these rains and snowmelt also produced enhanced runoff. The northern Plains have an above normal snowpack, and the flood risk is expected to stay relatively high for the region throughout the spring. In eastern South Dakota, major flooding is expected to continue in the lower Big Sioux, Vermillion, Lewis and Clark Lake, and lower James Rivers. In Iowa, major flooding is expected in the Floyd, Ocheyedan, Rock, Little Sioux, and Big Sioux Rivers. In Nebraska, major flooding is expected in the Wood River, Shell Creek on the lower Platte, North Fork Elkhorn River, Logan Creek of the lower Elkhorn, lower Niobrara, portions of the Middle Platte, and Nishnabotna River basins. In the state of Missouri, major flooding is likely in the Tarkio, Nishnabotna, and Nodaway River basins. Also, the Platte River mainstem to the confluence of the Missouri River,
as well as the Missouri River mainstem from Gavins Point Dam to Kansas City, have a risk of
experiencing major flooding this spring.

In western South Dakota, moderate flooding is expected in the White, Grand, and Moreau River
basins. In Nebraska, moderate flooding is expected in the upper Elkhorn and upper Platte River
basins. In Kansas, moderate flooding is expected in the Smoky Hill, Saline, Solomon, Little
Osage River basins. In Missouri, moderate flooding is likely in the Grand, Crooked, Blackwater,
Lamine, and South Grand River basins.

In northeastern Montana, minor flooding is likely in the lower Milk River basin. In western and
central North Dakota, minor flooding is likely in the Little Muddy Creek and Cannonball River
basins. In western South Dakota, minor flooding is expected in the Little Missouri and Bad River
basins. In Nebraska, minor flooding is likely in the Little Blue, Loup, and North Platte River
basins. In Kansas, minor to moderate flooding is expected in the Big Blue, Little Blue, Marais
des Cygnes, and the Republican River basins. In Missouri, minor to moderate flooding is likely
in the Chariton, Moreau, Big Piney, Gasconade, Marmaton, Osage Rivers, as well as Petite
Saline Creek.

Snowpack conditions over the Upper Missouri Basin above Fort Peck, Montana and Yellowstone
Basin is near normal, though the snowpack in the St. Mary Basin was 85% of average, whereas
the Milk River Basin was 150% of average. Streamflow conditions from snowmelt in the Upper
Missouri and Yellowstone River basins this spring is forecast to be near normal.

Northeast

Above normal flood potential exists across much of the Northeast. The potential for ice jam
flooding is widespread in portions of New York, Vermont, New Hampshire, and Maine. With
the combination of existing snowpack, above normal precipitation, saturated soil conditions,
and above normal streamflow, moderate flooding is likely in portions of the St. John,
Penobscot, and Upper Hudson River basins. Minor flooding is likely in the Penobscot,
Kennebec, Androscoggin, Saco, Merrimack, Connecticut, Lake Champlain, Upper Susquehanna,
and St. Lawrence River basins.

Middle Atlantic Region: Virginia, Maryland, Washington D.C., Pennsylvania, and
Delaware

Above normal seasonal precipitation in the Mid-Atlantic region has led to above normal
streamflow and highly saturated soil conditions. Snowpack is widespread but within normal
ranges. These conditions set the stage for an above normal river flood potential for much of
these regions. Minor flooding is possible this spring in many basins across this area including
the James, Potomac, Susquehanna, and Delaware basins.

Southeastern U.S.: Neuse, Tar, and Tombigbee River Basins

Much of the Southeast, including portions of the Carolinas, Georgia, Alabama, and the southern
Appalachian mountains received above to well-above-normal precipitation this winter with the
exception of the Gulf Coast. With higher than normal soil moisture conditions, along with the
climatologically normal convective springtime systems, minor flooding is likely for the region
this spring. In southern Virginia, minor flooding is likely in the Dan and Nottoway River basins.
In North Carolina, minor flooding is projected in the Roanoke, Neuse, and Tar River basins. In
South Carolina, the risk for minor flooding exists for the Pee Dee, Edisto, and Congaree Rivers.
In Georgia, minor flooding is likely in portions of the Savannah, Ogeechee, Altamaha, Ocmulgee,
and Flint basins. In Florida, minor flooding is likely in rivers such as the St. Marys and Santa Fe.
In Alabama, minor flooding is likely in rivers such as the Tombigbee, Coosa, and Black Warrior.

Upper and Lower Trinity River Basins, Texas

Upper and Lower Trinity River basins in Texas are expected to experience minor to moderate
flooding this spring season due to the potential for convective storm systems typical of the
spring season. Precipitation over the past 90 days has been overall below normal while higher
than normal soil moisture conditions for the area exists due to the wet fall. Minor to moderate
flooding is also projected in the Neches and Sabine River basins.

Pacific Northwest: Snake River Basin, Deschutes, and John Day River Basins

Record snowfall in February across the lower elevations of Oregon, southeast Washington and
south central Idaho has led to an increased risk of minor to moderate flooding for rivers in the
Middle and Lower Snake, Deschutes, and John Day River basins as spring temperatures begin to
rise, including the Big Lost, Big Wood, Upper Boise, Payette, and Weiser Rivers.
Sierra Nevada Region: San Joaquin, Sacramento, and Carson River Basins

The Sierra Nevada region received 130 to greater than 150% of normal precipitation this winter.
Due to higher than normal snow accumulations, above normal flooding due to snowmelt is
expected. Minor flooding is likely in the San Joaquin, Sacramento, Carson, and Walker River
basins. A rapid rate of snowmelt could lead to minor flooding along the Truckee, Susan, Middle
Fork of Feather, and Pit Rivers.

Lower Colorado River Basin

Above normal snowpack in the upper elevations of the Lower Colorado River Basin, the Salt,
and Verde River basins are expected to produce above normal seasonal runoff ranging 170 to
over 300% of median this spring. The seasonal runoff from the Virgin River Basin is expected to
range from 150 to 180% of median. The seasonal runoff from the Gila River Basin and eastern
headwaters of the Little Colorado River Basin are expected to be below normal due to drier
conditions.

Rest of the Western U.S.

Mid-March is still too early to determine final spring flooding potential across the western
United States due to snowmelt since heavy snowpack at higher elevations are expected to
persist and even build over the next month. The duration and intensity of flooding will depend
on future precipitation and temperatures. This assessment addresses only spring flood
potential on the timescale of weeks to months, not days or hours. Although flooding on short
time scales are not addressed in this assessment, debris flow and flash flood often associated
with burn scars and urban areas can occur any time with heavy rainfall especially in the West.
To stay current on flood risk in your area, go to water.weather.gov for the latest local forecasts,
warnings, and weather information 24 hours a day.

There is still ample time left in the accumulation period for the spring flood potential to change
across the West. Even in areas where the spring flood risk is near normal, some smaller
streams and flood prone areas may experience minor flooding with a sudden warm-up, the
occurrence of heavy rains, or thunderstorms over those watersheds. Weather conditions
preceding and during the melt period determine the threat of flooding. Rapid warming can
lead to elevated melt rates. During the snowmelt season, when rivers and streams are flowing
at or near capacity, any precipitation can increase the risk of flooding. As always, citizens are
encouraged to monitor the forecasts from their local Weather Forecast Offices.
Water Supply
Water Resources West of the Rockies

Water supply forecasts are produced for the western United States that supply water for
agriculture, municipalities, and industrial uses. Forecasts reflect current hydrologic conditions
including snow pack and soil moisture, weather forecasts, and climate information. As these
conditions change, especially over the next couple months, forecasts will be updated to reflect
these changes. Water supply forecasts are generated with outputs provided by NOAA/NWS
River Forecast Centers, the Natural Resources Conservation Service (NRCS) Water and Climate
Center.

In the Pacific Northwest, above normal snowpack exists for the southern two-thirds of the
basin. Despite record snowstorms in February, snowpack in the northern Pacific Northwest
remains below normal. These conditions have resulted into varying water supply forecasts for
April to September as follows:
        ● Upper Columbia River basins above Grand Coulee: 80 – 95%
        ● Middle Columbia: 50 – 95%
        ● The mainstem Columbia River at the Dalles Dam: 85%
        ● The mainstem Snake River at Lower Granite Dam: 90%
        ● Snake River basins: 65 – 130%
        ● The west side of the Cascades: 80 – 95%
        ● Northeast Oregon basins: 60 – 120%

In the Colorado River Basin and Great Basin, winter precipitation and snowpack accumulation
has been near normal. Observations from the SNOwpack TELemetry (SNOTEL) network
maintained by the NRCS indicate much-above-normal snow conditions across much of Utah and
western Colorado as well as in the Salt and Verde River basins in Arizona. The region is
expected to continue to receive snow through March. The water supply forecasts for April
through July are mostly near normal to above normal as follows:

       ●   Upper Colorado River Basin: 90 – 115% of average
       ●   Green River Basin of WY: 60 – 100% of average
       ●   San Rafael Basin and Duchesne River Basin: 150% of the 1981 – 2010 average
       ●   San Juan Basin: 90 – 110% of average
       ●   Salt and Verde River basins: 120 – 190% of average
       ●   Gila River Basin: 45% - 80% of average (January through May forecast)
       ●   Eastern headwaters of the Little Colorado River Basin: 40% (January through June
           forecast)
● Bear River Basin: 85 – 110% of average
● Provo, Weber, and Six Creek Basins: 100 – 130% of average
● Sevier River Basin: 130 – 160% of average
The Sierra Nevada snowpack remains much above normal with values greater than 150% of
normal. Reservoir inflow volumes during the spring snowmelt season (April through July) are
expected to be 150% of normal or greater. For more specific details on water supply outlooks
for this region refer to the California River Forecast Center.
Water Resources East of the Rockies
Projections of surface water availability provided by the National Weather Service play a crucial
role in water resource decision making in other regions of the country. With much above
normal precipitation this winter over much of the eastern U.S., reservoirs are around normal to
above normal pool levels. Due to these factors, the concern for water supply shortages is low.
In the Northeast, water supply levels are overall normal to above normal at Winnipesaukee
Lake, Kennebec Lake, Androscoggin Lake, the Quabbin Reservoir, the Wachusett Reservoir, Lake
Champlain, New York City’s water supply system, and Great Sacandaga Lake. In the Middle
Atlantic area, no water supply shortages are expected through this spring. In the Ohio River
Basin, reservoirs across the Mahoning Basin remain elevated as water was held back due to
flooding across southern portions of the Ohio River basin. In the Southeast, reservoirs are near
or above target pools.
Alaska Spring Ice Breakup Outlook
The spring breakup flood potential in Alaska is forecast to be normal to below normal. Timing is
expected to be slightly earlier than the median based on thinner than normal ice thickness and
warmer than normal forecast temperatures. This forecast is based on observed snowpack, ice
thickness reports, and long-range temperature forecasts.
River Ice
March ice thickness data is available for a limited number of observing sites in Alaska. Late
February/Early March measurements indicate that ice thickness is below normal across the
state with locations generally between 60 to 90% of normal. A few exceptions are at Tanana,
where the Yukon River ice thickness was 132% of normal, and along the Salcha River at Salcha
where ice thicknesses measured 125% of normal. However, below normal ice thickness is likelyacross the interior as temperatures have been above normal since the river freeze up in October and November. The warmer than normal temperatures are reflected in the accumulated freezing degree days across the state where all locations are below normal. At Bethel, freezing degree days as of March 1 are 60% of normal, Fairbanks are 80% of normal, and the Arctic Coast at Deadhorse are 70% of normal. Snowpack Analysis of the March 1 snowpack by the Natural Resources Conservation Service (NRCS) indicates greater than normal snowpack across the western Alaska and near normal across the central interior and Southcentral Alaska. In the Kuskokwim and Koyukuk Basins, snowpack measures 125-150% of normal, 85% in the Tanana Basin, 70% in the Upper Yukon, and 100% in the Susitna River basin. Climate Outlook The most important factor determining the severity of ice breakup remains the weather during April and May. Dynamic breakups with a high potential for ice jam flooding typically require cooler than normal temperatures for most of April followed by an abrupt transition to warm summer-like temperatures in late April to early May. The temperature outlook for late March and early April suggests an increased chance of normal to above normal temperatures for most of Alaska. The longer 3-month outlook which includes March, April, and May indicates increased chances of above normal temperatures in Alaska. For more information on the climate forecasts, please refer to the Climate Prediction Center. Spring Flood Outlook and Implications for Gulf of Mexico and Chesapeake Bay Hypoxia The projected spring flood risk for the Mississippi River is anticipated to create conditions highly conducive to hypoxia development and lead to an above average to large hypoxic zone in the northern Gulf of Mexico this summer. Flood conditions may lead to higher than normal springtime discharges of nutrients and freshwater from the Mississippi River into the Gulf of Mexico, conditions that promote hypoxia formation and spread. However, this cause and effect relationship can be confounded by weather events such as tropical storms and hurricanes, which can locally disrupt hypoxia formation and maintenance. Each year in the northern Gulf of Mexico, a large area of low-oxygen forms in the bottom waters during the summer months, often times exceeding 5,000 square miles. This area of low-
oxygen, otherwise known as the “dead zone”, is strongly influenced by precipitation patterns in
the Mississippi-Atchafalaya River Basin (MARB) which drains over 41% of the contiguous United
States. Changes in precipitation will influence river discharges into the Gulf, which carry the
majority of nutrients helping to fuel the annual dead zone, so examining spring flood risk in the
MARB can provide a useful indicator of the possible size of the dead zone during the summer
months.

In the Chesapeake Bay, recurring summer hypoxia has also been linked to nutrient loadings and
river discharge, especially from the Susquehanna and Potomac Rivers. With minor flooding
projected for these basins, an average hypoxia zone for the Chesapeake Bay is expected. This
assumes typical summer conditions in the Bay region and the absence of major disruptive
events such as tropical storms and hurricanes or drought conditions.

The spring flood outlook provides an important first look at some of the major drivers
influencing summer hypoxia in the Gulf of Mexico and Chesapeake Bay. In early June, the
measured river discharge amounts and corresponding nutrient concentrations will be available
from the U.S. Geological Survey. This information is used by NOAA and others to release annual
dead zone forecasts for the Gulf of Mexico and Chesapeake Bay. In the summer, the dead zone
sizes will be measured and compared against the predictions. Hypoxia forecast models that
evaluate the size of the dead zone based on causative factors such as watershed nutrient
loading deliver critical information to the Gulf of Mexico/Mississippi River Watershed Nutrient
Task Force and Chesapeake Bay Program to assess the effectiveness of watershed nutrient
reduction targets and measure progress toward efforts to reduce the size of their respective
dead zones. The National Weather Service and Ocean Service are working with States to
develop new tools to forecast runoff risk which should help limit nutrient runoff to the Gulf of
Mexico, Chesapeake Bay, Great Lakes and other regions by identifying the optimal times for
fertilizer application within these watersheds.

NOAA’s Role in Flood Awareness and Public Safety
Floods kill an average of 90 people each year in the US. The majority of these cases could have
been easily prevented by staying informed of flood threat and following the direction of local
emergency management officials.
       To help people and communities prepare, NOAA offers the following flood safety tips:
    ● Determine whether your community is in a flood-risk area and continue monitoring local
       flood conditions at http://water.weather.gov.
    ● Learn what actions to take to stay safe before, during and after a flood at
       https://www.weather.gov/safety/flood and https://www.ready.gov/floods.
● Visit http://www.floodsmart.gov to learn about FEMA’s National Flood Insurance
Program and for flood preparedness advice to safeguard your family, home and
possessions.
● Purchase a NOAA Weather Radio All- Hazards receiver with battery power option to stay
informed of quickly changing weather information.
● Study evacuation routes in advance and heed evacuation orders.
● Turn Around, Don’t Drown – never cross flooded roads, no matter how well you know
the area or how shallow you believe the water to be.
NOAA’s National Weather Service is the primary source of weather data, forecasts and
warnings for the United States and its territories. It operates the most advanced weather and
flood warning and forecast system in the world, helping to protect lives and property and
enhance the national economy. Visit us online or on Facebook and Twitter
NOAA’s mission is to understand and predict changes in the Earth's environment, from the
depths of the ocean to the surface of the sun, and to conserve and manage our coastal and
marine resources. Visit us online or on Facebook and Twitter.About This Product The National Hydrologic Assessment is a report issued each spring by the NWS that provides an outlook on U.S. spring flood potential, river ice jam flood potential, and water supply. Analysis of flood risk integrates late summer, fall, and winter precipitation, frost depth, soil saturation levels, streamflow, snowpack, temperatures and rate of snowmelt. NOAA's network of 122 Weather Forecast Offices, 13 River Forecast Centers, National Water Center, and other national centers nationwide assess this risk, summarized here at the national scale. The National Hydrologic Assessment depicts flood risk over large areas, and is not intended to be used for any specific location. Moreover, this assessment displays river and overland flood threat on the scale of weeks or months. Flash flooding or debris flow, which accounts for the majority of flood deaths, is a different phenomenon associated with weather patterns that are only predictable days in advance. To stay current on flood risk in your area, go to water.weather.gov for the latest local forecasts, warnings, and weather information 24 hours a day.
You can also read