2020: How to pivot a crisis into a time of opportunity? - Covid ...
←
→
Page content transcription
If your browser does not render page correctly, please read the page content below
www.singular.ch
                                   https://www.linkedin.com/company/singular-group/

2020: How to pivot a crisis
into a time of opportunity?

Singular’s view: COVID-19
impact in South Africa

08 May 2020

                              Singular Africa (Pty) Ltd – 25 Rudd Road – Johannesburg
In collaboration
                                    Singular Group GmbH – Kaiserstrasse14a – Munich
with:
                                            Singular Group AG – Baarerstrasse43 – Zug
Preliminary view as of 07 May 2020 – might have to be adjusted daily based on situation and new findings

Disclaimer and acknowledgments
This Presentation is intended to provide decision-makers with a concrete and focused view on how the crisis in South Africa could develop over the next weeks
and months. Therefore, we have considered a large variety of credible research sources and analyses; however, we have tried to apply a strict focus and cut
out any unnecessary information – which is a challenge given the storms in the media.

The situation surrounding COVID-19 is dynamic and rapidly evolving, on a daily basis. Although we have taken great care prior to producing this presentation,
it represents Singular’s view at a particular point in time. This Presentation is not intended to constitute safety advice, nor be seen as a formal endorsement of
a particular response. As such you are advised to make use of this presentation as guidance.

We at Singular will update this view dynamically depending on new data available as required.

Singular Group and its affiliates, officers, directors, employees and agents do not accept responsibility or liability for this Presentation or its contents (except to
the extent that such liability cannot be excluded by law).

This Presentation is (i) for discussion purposes only; and (ii) speaks only as of the date it is given, reflecting prevailing market conditions and the views
expressed are subject to change based upon a number of factors, including market conditions. Singular Group has relied upon and assumed without
independent verification, the accuracy and completeness of all information which may have been provided directly or indirectly by the Recipient. No
representation or warranty is made as to the Information’s accuracy or completeness and Singular Group assumes no obligation to update the Information.
The Presentation is incomplete without reference to, and should be viewed solely in conjunction with, the oral briefing provided by Singular Group. The
analyses contained in the Presentation are not, and do not purport to be, appraisals of assets, stock, or other businesses. The Information does not take into
account the effects of a possible transaction or transactions involving an actual or potential change of control, which may have significant valuation and other
effects.

The Presentation is not exhaustive and does not serve as legal, accounting, tax or investment advice. Any recipient must make its own independent
assessment and such investigations as it deems necessary. In preparing this presentation Singular Group has acted independently and nothing in this
presentation is intended to create or shall be construed as creating a fiduciary relationship between any recipient and Singular Group.

Acknowledgments content support include:
• Luca Rosetti – Beaconforce
• Ask Africa

Singular Group                                                                                                                                                       1

Preliminary view as of 07 May 2020 – might have to be adjusted daily based on situation and new findings

Purpose and context

       Objectives
       ▪ Contribute to South African decision-makers, by hypothesising an “in-the-making” viewpoint on:
               ‒ Recent developments on COVID-19
                 ‒ Possible first and second-degree implications for the country and business

                 ▪ Offer practical ideas on how businesses can react to the threat and some opportunities that
                   could lie ahead

                       Assumptions and many unknowns
                       ▪ Our sources are often consisting of the best academic research available; and
                          assumptions will be continuously updated as more information becomes available

                             ▪ Key “wild card” variables not considered as of now:
                                ‒ Real ability to enforce a true lockdown in rural and poor communities
                                 ‒ The seasonality of the virus
                                  ‒ The impact of broad-based anti-bodies testing and a gradual selective
                                     release of recovered patients
                                     ‒ Mutations of the virus (i.e. ability to be re-infected)
                                       ‒ The impact of BCG vaccines on reducing case severity
                                        ‒ Accuracy of death counts in countries outside of South Africa

Singular Group                                                                                                              2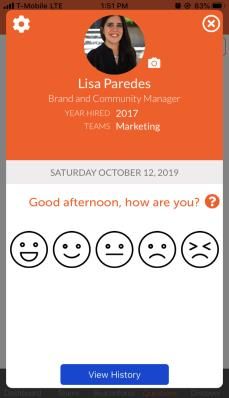
Preliminary view as of 07 May 2020 – might have to be adjusted daily based on situation and new findings

Summary (1/3): SA has started the COVID race early and strong –
more testing is needed to keep this up
 A    Virus and Healthcare

•1 South Africa’s good progress: Death rates have remained low in comparison to other countries
   ‒ 12 days after deaths reached 0.1 per million SA’s death rate is 13x less than that of Italy. SA’s death rate is following
      the trajectory of best practice countries such as South Korea – so far, so good!
   ‒ Globally, the true death toll of COVID-19 appears understated e.g. Spain has had an excess of 19 700 weekly deaths
      of which only 12 401 are attributed to COVID-19, which appears understated. This is not the case in SA, currently SA’s
      COVID-19 death toll appears to be a true reflection of natural causes
•    More testing is needed: Despite the low infection rate, SA should be cautious as the WC becomes a new hotspot
 2
     ‒   The infection fatality rate of SA could be between 0.4-0.7%, considering both SA’s young population and HIV+
     ‒   The lower fatality rate is due to COVID-19 being more widespread than cases reported. Of the 8 232 cases today, there
         could be 20 500- 32 000 cases in SA today
     ‒   Despite the lower than expected fatality rate, COVID has become one of the biggest killers of 2020, killing 2x more
         Americans per week than the height of the 1958 influenza pandemic (H2N2)
     ‒   Growth trends show that as countries test more, positivity of tests increases. SA’s test positivity (3%) is ~3x lower
         than the global average of 8%. In the same breath, uncertainty of the spread remains low due to lack of scaled
         testing. SA has 4.52 tests per 1 000 people. The global average is 20.52
     ‒   But SA needs to be cautious, WC has become the new hotspot
         o Over the past four weeks the WC has gone from attributing 24% to 66% of South Africa’s confirmed cases
         o The CT hosts ~87% of the WC’s cases with Khayelitsha’s cases increasing 16x over the past 3 weeks
     ‒   Is SA concentrating its testing to hotspots?
         o Countries follow three phases when it comes to testing over time. Phase 1: Widespread testing i.e. test everywhere;
            Phase 2: Focus testing on hotspot areas; Phase 3: Once hotspots are controlled, go back to widespread testing. This
            behavior creates U-shape curve in tests per confirmed case. SA has no such dip yet
•3 The known “unknowns”: Higher temperatures could reduce survival rate of the virus
   ⁻ Do we expect the seasonality effect to play a significant role in only one year?. Will South Africa experience a
      significant spike in June?; Will the weather negate the positive effects of lockdown?
Singular Group                       New insights since last publication on 24 April 2020                                         3
Preliminary view as of 07 May 2020 – might have to be adjusted daily based on situation and new findings

Summary (2/3): Timeline for easing of restrictions for industries
could prolong SA’s recovery period to 3-7 years
 B    Policy and Economy

•1 A perspective on South Africa: Testing ramp-up and containment measures may lead to three cases
   ‒ “Base Case”: Rate of spread ~2x the current rate (600 cases per day), leading to spike of infections in identified
      clusters. ~1 700 critical cases over the next three months. 23% of critical care beds could still be unutilised
   ‒ “Worst Case”: Rate of spread ~3x the current rate (900 cases per day), leading to multiple hotspots; ~2 400
      critical cases over the next three months. 10% of critical care beds could still be unutilised
   ‒ “Best Case”: Testing ramped-up but low positive tests indicate low spread, resulting in ~1 300 critical cases over
      the next three months which can be managed with existing medical infrastructure
•2 A perspective on South Africa: Prolonged restriction on businesses could make GDP contract further
   ‒ Following 5 weeks of lockdown, economic and digital changes can already be seen. There has been a sharp
      increase in food security concerns. A recent survey showed that more than 70% of households are concerned about
      the amount of food in their household. Whilst online banking has grew by 70% since the last quarter
   ‒ “Best Case”: A 14-day segmented release after lockdown (30 April) during level 4, allowing medium capacity (30-
      50%) for most industries. This is followed by slow recovery during level 3 and 2. Government mandates and enforces
      strict social distancing measures to control the spread. A GDP contraction of ~10% in 2020 is expected. This could
      lead to 4-year recovery period, ending in 2024
   ‒ “Base Case”: After 30 April, a 21-day segmented release at level 4 to 30% capacity for most industries. A GDP
      contraction of ~14% in 2020 is expected. This could lead to 6-year recovery period, ending in 2026
   ‒ “Worst Case”: A 28-day segmented release after 30 April at level 4, to 30% capacity for most industries. Hotspots
      appear after slow release, causing a second wave. Government enforces level 3 restrictions to stop the spread. A
      GDP contraction of ~17% in 2020 is expected. To recover 70% of this loss, it would take South Africa 7 years
   ‒ In all scenarios, GDP sector growth in 2020 is expected to come from Healthcare ONLY (16-27% growth in 2020)
   ‒ Biggest blow is estimated in Hospitality with a 38-46% expected contraction in 2020
   ‒ Hard hit sectors could possibly be Mining, Retail, Real estate and Construction which have a contraction range of
      14-21% contraction in 2020

Singular Group                       New insights since last publication on 24 April 2020                                   4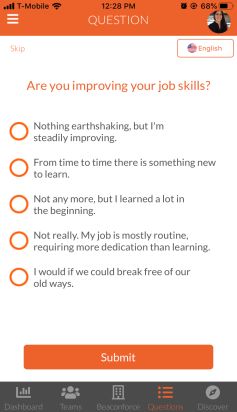
Preliminary view as of 07 May 2020 – might have to be adjusted daily based on situation and new findings

Summary (3/3): Businesses that capably survive external shocks
demonstrate common “resilience” characteristics
 C    External Shocks and Business Response
 •
 1   What do businesses that survive crisis have in common?: Businesses that successfully navigate external
     shocks have three resilience characteristics, namely responsiveness, adaptivity and thinking in ecosystems
     ‒ Responsive: in a crisis businesses should quickly mobilise resources and amend internal processes to swiftly to
        stabilise operations (i.e. maintain a healthy balance sheet, protect employees)
     ‒ Adaptive: businesses should proactively monitor trends and market performance to discern threats (e.g. changing
        consumer behaviors), adapt the business model (e.g. invest in digital skills) and pivot the product/ service offering
     ‒ Think in ecosystems: businesses should create buffer capacity / capability for critical components of the business
        system (e.g. vet extra suppliers) to be able to effectively replace/substitute business components in a crisis

 2   How will the environment shift?: Trends along Government regulations, consumer behaviour and geopolitics
     will shape a ‘new normal’ for businesses, with digital friendly sectors emerging as winners
     ‒ Government economic policy, regulations, consumer behavior and geopolitics will lead to short-term trends such
         as movement limitations and “every industry in hygiene” as Government controls the COVID spread
     ‒ Long-term trends include digital interactions over physical and digital globalisation. Remote working will inspire
         connectivity and globalisation of services
     ‒ Looking at both temporary and structural industry shifts, the trend of digital interactions over physical will result in
         sustained revenue growth in the next 2 year for industries that are compatible with social distancing practices
         (e.g. telehealth, streaming services) vs. those that structurally require physical contact (e.g. car sharing, travel)

 3   How to practically navigate the crisis?: To build resilience during a crisis, businesses should adopt a response
     framework clearly defining the strategy (WHY), initiatives (WHAT) and organisational setup (HOW)
     ‒    WHAT: Identify specific initiatives to undertake during each phase of the economic cycle, based on financial health
          (e.g. during the “Turnaround” focus on making structural changes and shifting the product / service offering)
     ‒    HOW: Set up SWAT teams and start to build an ecosystem of technology partners, advisors, analysts and investors
          o The role of SWAT is to collect and incorporate facts and intelligence and makes IMMEDIATE decisions on
              responses during the “Fall” and “Turnaround” while the partner ecosystem will help in identifying solutions faster

Singular Group                       New insights since last publication on 24 April 2020                                          5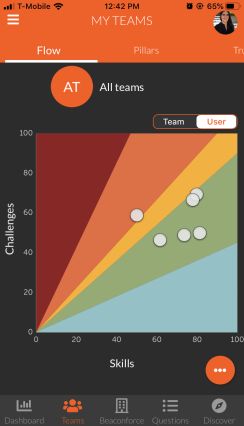
Preliminary view as of 07 May 2020 – might have to be adjusted daily based on situation and new findings

Contents of this document

A.
A Virus and Healthcare: How could COVID-19 develop in South Africa?

B.
B Policy and Economy: What could unfold in the next few months?

B.
C External Shocks and Business Response: How do companies respond?

Singular Group                                                                                                              6
Preliminary view as of 07 May 2020 – might have to be adjusted daily based on situation and new findings

SA has made good progress so far - death rate has remained low
in comparison to other countries
Log of deaths per million of population for number of days after total confirmed deaths
reached 0.1 per million of population

                                               1,000.0
Log of total confirmed deaths per million of

                                                100.0
                 population

                                                 10.0

                                                   1.0
                                                                                          •   12 days after deaths reached 0.1
                                                                                              per million SA’s death rate is 13x
                                                                                              less than that of Italy
                                                                                          •   Will South Africa continue on
                                                                                              the “positive” trajectory?

                                                   0.1
                                                         0   2   4   6   8   10 12 14 16 18 20 22 24 26 28 30 32 34 36 38 40 42 44 46 48 50 52 54 56 58 60 62

                                                                                       Days since total confirmed deaths reach 0.1 per million of pollution
Source: Our World in Data, Singular analysis
Singular Group                                                                                                Australia   Brazil     Germany      Italy          South Korea   Switzerland     7
                                                                                                              Belgium     France     Iran         South Africa   Sweden        United States
Preliminary view as of 07 May 2020 – might have to be adjusted daily based on situation and new findings
Globally, the true death toll of COVID-19 appears 40-50%
understated, however that is not currently the case in SA
Growth in total deaths imply Europe could be Currently, SA’s COVID-19 death toll appears to be a
miscounting COVID impact true reflection of non-natural causes
Average number of weekly deaths (historically) vs weekly deaths in 2020 Weekly deaths from natural causes 1 Jan-14 April
Difference of 12,000
6 500 (45%)
2020
15 000 weekly France has had
deaths not an excess1 of
attributed to
14 500 weekly
Weekly deaths
COVID-19 8,000
deaths of
which only
8 059 are
5 000 Historical average2
attributed to
COVID-19 4,000
01/2020 04/2020 07/2020 10/2020 01/2021
Jan Dec Weekly deaths from non-natural causes 1 Jan-14 April
Difference of 7
15 000 300 (37%) 1,600
weekly Spain has had
2020
deaths not an excess1 of 1,400
attributed to 19 700 weekly 1,200
Weekly deaths
COVID-19 deaths of 1,000
which only 800
12 401 are 600
5 000 Historical average2 attributed to 400
COVID-19 200
0
Jan Dec 01/2020 04/2020 07/2020 10/2020 01/2021
1. Excess of actual deaths from historic averages are measured between the 9th of March and the 5th of April 2020; 2. Historic averages are calculated between 2010-2019
Source: Report on weekly deaths in South Africa, Tracking the True Toll of the coronavirus crisis
Singular Group Actual weekly deaths Forecast Lower confidence Upper confidence 8Preliminary view as of 07 May 2020 – might have to be adjusted daily based on situation and new findings
SA cases could be more widespread than reported - potentially
21-32k cases today; fatality rate estimated at 0.4-0.7%...
Cases and deaths related to COVID-19 in South Africa
With a lockdown, COVID-19
could have a mortality rate
SA mortality • Iceland tested 14% of its population
that is 4-7x times that of the
flu (0.1%) and 4-6x less than range: and has a 0.6% fatality rate
the Spanish flu (2.5%) 0.4-0.7 % • All crew members and passengers of
Diamond Princess were tested for
161 COVID-19, resulting in a 1.5%
Data requires testing at
Deaths mortality rate (with an older
scale
Surveillance is likely to restrict population) from 19% being infected
4
testing to those with a travel • Lancet studies show tracking of
Severe cases
history or link and would miss asymptomatic cases in the Wuhan areas
asymptomatic cases could place mortality between 0.4-
8 232 0.8%
Total recorded cases • A study by JPM2,through antibody
testing in New York estimates the true
Symptoms can be missed if
rate of fatality in Wuhan to be 0.7%
tested at wrong time
There can be a period of 2–3
weeks between developing
symptoms and observation of
clinical outcome. This effect 20 500 – 32 000
was observed in past Asymptomatic (mild) cases1
epidemics, including (SARS)12
and H1N19 influenza
Testing is crucial – “we cannot treat what we don’t know”
1. Assumed that only 25-40% of cases reported. 2. JP Morgan
Source: Worldometers, Singular research; Source: Lancet (“Estimates of the severity of coronavirus disease”, 2020); Singular analysis
Singular Group 9Preliminary view as of 07 May 2020 – might have to be adjusted daily based on situation and new findings
…But COVID-19 is still more fatal compared to recent morbidities
– weekly deaths are ~2x greater than peak of H2N2 pandemic
New weekly reported deaths in the USA
45
40 2017 weekly avg. Apr 20-26 Heart disease
2017 weekly avg. Cancer
35
30 On avg. 12 000 – 61 000 people die of influenza
Deaths per million
in the US per year, COVID 19 accounts for ~73
COVID-19 000 US deaths to date.
25
20 1957 – 58 Influenza pandemic (H2N2 virus)
15
10
2017 - 18 Flu and Pneumonia
5
2017 – 18 Flu
0
1 3 5 7 9 11 13 15 17 19 21 23 25 27 29 31 33
Week
Source: The New Atlantis, Singular research
Singular Group 10Preliminary view as of 07 May 2020 – might have to be adjusted daily based on situation and new findings
Growth trends show that as countries test more, positivity of tests
increases; due to virus spread and improved locating of hotspots
Total number of tests per 1000 of population compared to the percentage of positive cases - from the day of the first case
High 50
Israel SA should be prepared for a trajectory
45 between Norway and UK, however, %
Positive tests1 are likely to increase
Cumulative number of tests2 per 1000 of population
40
Norway
35 Countries in the same quadrant 46
Germany Belgium
days ago as SA is today have ramped
Russia
up testing and increased positive testing
30
Confidence of results
– these countries detected more
Australia cases and increased their reported
25 Canada infection rate
20
United Kingdom
15 Turkey
Peru
Norway
10 South Korea
South Korea Germany
5 Australia South Africa today3
Canada Belgium
Israel Turkey United Kingdom
Russia Peru
0 South Africa 23.04
0 1 2 3 4 5 6 7 8 9 10 11 12 13 14 15 16 17 18 19 20
Low % Positive tests1
Low High
Infection rate
1. Total positive cases divided by total cumulative tests performed; 2. Total tests to date; 3. SA at 4.52 vs world average of 20.52 cumulative tests per 1000 population
Source: Our World In Data number of cases2 as of 23.04.2020
Singular Group number of cases2 as of 06.05.2020 number of cases2 as of 22.03.2020 World average tests per 1000 population World average % positive tests 11Preliminary view as of 07 May 2020 – might have to be adjusted daily based on situation and new findings
Today, Cape Town has become the new hotspot in SA with
increasing spread within Khayelitsha and Mitchell’s Plain townships
The WC has grown from 24%-66% of SA’s cases over Cape Town accounts for 87% of the WC’s cases and
the last 4 weeks Khayelitsha has grown 16x over the past 3 weeks
Weekly new confirmed cases per major province Cumulative cases per suburb within the City of Cape Town municipality
2,161
12% 9% 73%
13%
Gauteng Other Western Cape
1,694
22%
The Western Cape accounts 11%
for 17% of South Africa’s 8%
tests to date but ~50% of 1,348 234 11%
deaths 26% 687
21% 4% 10%
536 9%
381 377
777 34% 344 4% 478
15%
671 66%
43%
292
535 26% 12%
472 63%
47% 28%
134 34% 50% 45%
14% 38%
12 34% 29%
50%
52% 24% 34% 24% Informal
Informal township
townships
42% 8% 23%
Khayelitsha
Khayelitsha anand
Mitchell’s Plain
Mitchell’s
12 Mar 19 Mar 26 Mar 02- Apr 09- Apr 16- Apr 23- Apr 30- Apr 07- May have the fastest growth
Plain have the fastest growth
Mitchells
1. Week on Week Western Southern Northern Tygerberg Eastern Klipfontein Khayelitsha
Plain
Source: Data Convergence, WITS, iThemba Labs
Singular Group x Cumulative cases % Weekly average growth rate for the 4 weeks ending 07.05 X Weekly average growth rate for 4 the weeks ending 07.05 12Preliminary view as of 07 May 2020 – might have to be adjusted daily based on situation and new findings
Concentration of testing increases as countries identify hotspots
and target ramp up of testing
PHASE 1: Widespread testing – looking PHASE 2: Testing hotspots; virus PHASE 3: Widespread testing – looking
Typically for hotspots spreading fast for new hotspots, virus disappearing
countries Initial testing is scattered and countries Over time, countries improve their Concentration of testing is broadened
ability to locate hotspots and are able to after successful treatment and isolation of
follow a are still collecting data on hotspots
focus attention to specific locations - viruses hotspot cases
U-shaped grow in clusters not linearly
trend
Number of tests per confirmed case since confirmed deaths reached 5
70
65
Now that SA has
60
Number of tests per confirmed case
hotspots will we
55 expect this line to dip?
50
45
40
35 Germany and Italy reduced
30 number of tests per
confirmed case by 5x and 6x
25 respectfully
20 U-Shape
15 Source: Our World In Data
10
5
U-Shape
0
0 5 10 15 20 25 30 35 40 45 50 55 60 65 70 75
Days since the total confirmed deaths of COVID-19 reached 5
Singular Group Belgium France Germany Italy South Africa South Korea 13Preliminary view as of 07 May 2020 – might have to be adjusted daily based on situation and new findings
Most countries have reacted to hotspots with a concentrated
regional approach, Cape Town has yet to target hotspot clusters
% of country Lockdown and distancing Concentrated testing and Build regional health capacity
regulations quarantining
Hotspot cases
Only dormitories in lock down Established mobile testing at Multi-story car parks, military camps
Singapore 88% (including essential workers). Rest of dormitories and ramped up testing and floating hotels established as
dormitories the country unrestricted from 2 900 to 8 000 per day quarantine centres
(2.5x)
Rationed supplies, closed Aggressive screening of all Thousands of hotel rooms and
7%1 boarders, banned essential residence and isolation of hostels converted to quarantine
Bhilwara services and implemented curfews expected cases and care centres
Marked as “red zone”. Shut down Door to door testing and testing 52 Cuban doctors brought in to
37% non-essential services, households and neighbours of assist at a field hospital erected to
Lombardy checkpoints restricted movements confirmed cases expand medical capacity
Shut down non-essential Conducted tests outside Increased bed capacity by 18 000
29% retailers and services, voluntary essential stores and excluded beds and received over 4 000
New York social distancing persons under 18 additional ventilators
WILL CAPE TOWN RETURN TO WILL CAPE TOWN SEE A FASTER WILL 200 CUBAN DOCTORS BE
43% LEVEL 5 RESTRICTIONS? RAMP UP? (17% OF NATIONAL CONCENTRATE AT CAPE TOWN?
Cape Town TESTS BUT REPRESENT ~50% OF
CURRENT DEATH TOLL)
1. Percentage of cases attributed to the border Rajasthan region
Source: How Bhilwara Turned The Corner In War Against Coronavirus, Singapore Was A Shining Star In COVID-19 Control, Lessons from Italy’s Response to Coronavirus
Singular Group Severity of regional measures Key case points 14Preliminary view as of 07 May 2020 – might have to be adjusted daily based on situation and new findings
Lockdown has been effective – next step is to await impact of
testing ramp up, BCG, HIV cases and hotspots in rural clusters
Positive drivers Negative drivers
COVID-19 vaccine: Mutation:
• Human trials of vaccines are expected to start • Many infected people could in time build up an immune
• However success and approval could take 12-18 months response to COVID-19 (natural herd immunity). To do
so, 2/3 of population will need to be infected
BCG (TB) vaccine:
• Currently COVID-19 has already mutated since Wuhan,
• Clinical trials are underway to understand the positive
which may prevent herd immunity in the short-term
link between BCG (TB) vaccines and COVID-19 Deep dive to follow
• BCG coverage in SA has remained between 80% and Seasonality:
90%, except in 2017 and 2018 when stock-outs dropped • For influenza, absolute humidity affects transmission,
the rate to 75% and 70% respectively Critical to identifying with drier conditions being more favorable
• If true, this could negatively impact South Africa in the
hotpots post
next few months
Testing ramp up: lockdown
• SA is testing ~2x less per 1 000 of population than
1 TB and HIV cases:
best practice (South Korea), ramp-up will be crucial to • HIV patients, who are not consuming antiretrovirals tend
understand hotspots post lockdown to have weak immune systems Government has
• Consensus is that Italy and European countries may • ~30% of HIV+ are not on antiretrovirals been able to
have reacted too late, leading to cases rising during this distribute water to
Poor sanitation: households
period (due to asymptomatic cases)
• Water is critical for citizens to remain sanitised
• ~46.3% of households have access to piped water in
Cautious release measures: their dwellings 200 Cuban doctors
• Most-stringent release compared to Europe and USA
deployed to fight
which are mirroring a “level 4” lockdown today Limited healthcare capacity COVID in SA
Proving effective as • ~6 300 critical beds with ventilators coming with it
Young population: most fatalities are
with the elderly
• >91% of the population being under 60
• A 60 to 69-year-old is 12 times more likely to die with Concentrated urban and dispersed rural clusters:
COVID-19 compared to a 40 to 49-year-old • There is limited visibility and control in these areas
1. South Korea tested 9.8 per 1000 vs SA 4.5 (49 days after 100th confirmed case)
Source: Singular analysis; Our World in Data
Singular Group Global Local 15Preliminary view as of 07 May 2020 – might have to be adjusted daily based on situation and new findings
Based on recent social distancing announcements and peak of
spread in July, fatalities could be between 350-1300
Best Case: Ripples Base Case: Few Hotspots Worst Case: Multiple Hotspots
• Infection rate grows by 1.5x post • Infection rate grows by ~2x post • Infection rate grows by ~3x post
lockdown (>450 cases per day) lockdown (>600 cases per day) lockdown (>900 cases per day)
• Current peak followed by multiple minor • Initial complacency followed by a • Hidden cases spread in some urban
outbreaks larger second wave limited to existing and rural concentrates – HOTSPOTS
• Peaks in minor resurgence coincide hotspots - slow ramp up of testing. Spread is
Context with flu season while summer seasons • Hidden cases appear but tracing and too severe for mass quarantining –
troughs testing ramp-up is able to contain the isolated shut down occurs
• Positive tests still remain low. Spread spread to the relevant clusters • Spread of asymptomatic and
contained by mid-end June • Hotspot regions return to level 5 five undetected cases increases as travel
lockdown restrictions restrictions are lifted
COVID
impact in
Estimates for infected people in thousands (till end-July
the next 46 2020) 58 86
3 months
1.3 1.7 2.4
0.32 0.58 1.3
Detected Severe Cases Fatalities Detected Severe Cases Fatalities Detected Severe Cases Fatalities
Cases Cases Cases
21% 48% 31% 6200 28% 49% 23% 6100 39% 50% 11% 6030
Critical bed capacity is sufficient
in all scenarios. Lockdown has
1. Assuming 30% of the HIV+ population does not have antiretroviral | Source: Singular research, validated with growth of China, Italy
and South Korea; Lancet (“Estimates of the severity of coronavirus disease”, 2020), Institute of Disease Modelling, Department of Health flattened the curve thus far
Total capacity
Singular Group Severe Cases Normal Cases Unutilised Capacity 16Preliminary view as of 07 May 2020 – might have to be adjusted daily based on situation and new findings
Deep dive: Higher temperatures likely affect survival of virus;
Warmer / humid climates might find it easier to manage outbreak
Given that current case rate is already high in Europe, will
infections drop this summer / June?; Do we expect the
seasonality effect to only play a role in one year?
Spread is higher near China.
Could interaction
(sneezing, hand shakes etc.)
impede effects of
climate?
Confirmed
> 30 000
Degrees Celsius
39.4
5 000
Will we spike
0 significantly in June /
winter?; Will this impede
lockdown releases?
< 1 000 -53.6
Coronavirus COVID-19 deaths Mean January Land Temperature
Source: Business Insider; Worldometer; Singular analysis
Singular Group 17Preliminary view as of 07 May 2020 – might have to be adjusted daily based on situation and new findings Contents of this document A. A Virus and Healthcare: How could COVID-19 develop in South Africa? B. B Policy and Economy: What could unfold in the next few months? B. C External Shocks and Business Response: How do companies respond? Singular Group 18
Preliminary view as of 07 May 2020 – might have to be adjusted daily based on situation and new findings

Context: COVID-19 has led to a national lockdown and delays in
Basic Education; This could continue depending further spread

                                         Best Case                                 Base Case                                                 Worst Case

                        Reaction: Level 4 (work               184        Reaction: Level 4 (work                                 Reaction: Level 4 (work
                        and essential shopping only)                     and essential shopping only)         170                and essential shopping only)
                        remains for 2 weeks                              remains for 3 weeks                                     remains for 4 weeks                       153
                        Level 3 remains for 3 weeks                      Level 3 remains for 3 weeks                             Level 3 remains for 4 weeks
Government
                       Number of days in each phase of
 response              lockdown

                                                         26                                          33                                             28      28      36
                           21      14      14   21                         21    14    21     21                                   21        14

                                            2020                                          2020                                                        2020

                 •    ZAR 500 billion package (~10% •                   80% of ZAR 500 billion          •                       Only 50% of ZAR 500 billion
                      of GDP ) plus additional package of               package (~10% of GDP ) realised                         package (~10% of GDP ) realised
   Fiscal
                      ~2% of GDP to support tourism,                    on investment into healthcare                           as the IMF, World Bank and
   policy
                      retail and SMME’s and banks                       capacity, aid to SMME’s and                             African Development Bank
 response
                                                                        provisions to unemployed                                prioritise recovery for other
                                                                                                                                nations
                 •    South African Reserve Bank                    •   SARB has reduced repo rate to     •                     SARB has reduced repo rate to
                      (SARB) has reduced repo rate to                   4.25%                                                   4.25%
 Monetary             4.25%                                         •   SARB reduces repo rate further by •                     SARB reduces repo rate further by
   policy •           ZAR ~50 billion allocated to                      50bps to 3.75%                                          100bps to 3.25%
 response             strengthen large company capital
                      positions (through equity)

Source: Singular research and analysis                                                        Full Lockdown         Extension      Level 4        Level 3        Level 2    Level 1

Singular Group                                                                                                                                                                   19
Preliminary view as of 07 May 2020 – might have to be adjusted daily based on situation and new findings
Following 5 weeks of lockdown, a sharp increase in food
security concern is seen as consumers take a financial strain
FOOD SECURITY: Pre-lockdown, ~20% of South Africans faced FINANCIAL RESOURCES: Consumers are tapping into more
food insecurity, today >70% have food availability concerns financial resources due to the financial strain of the crisis
62%
“We were 45% 43%
concerned about
the amount of food 72%
21%
we had in our
12%
household before
we got money to
buy food again” I have started I don’t have any Borrowed money
Pre-COVID-19 Pre-COVID-19 COVID-19 using my savings means of from family,
Urban Rural Overall view financial assistance friends or employees
PRODUCTVITIY: 55% of respondents have stopped working ONLINE GROWTH: 60%-70% of respondents have increased their
during the lockdown use of technology and social platforms
Of participants have increased their use of
70% video calling platforms since pre-lockdown
51%
100%
Of participants agree social media have
70% become more important to them
41%
4% 4%
Of participants agree that the COVID has helped
Working Temporarily Continuing Employer has Working as 63% them to embrace technology
population no working to work closed down essential
from home service
Note: Ask Afrika conducted n=1627 interviews were conducted in the last 3 weeks. The quota structure aligns with the proportions / demograohics of the general population
Source: Ask Afrika
Singular Group Decline in work activity Work activity similar to pre-COVID 20Preliminary view as of 07 May 2020 – might have to be adjusted daily based on situation and new findings
Hard hit sectors across all cases will possibly be Retail2
(17-24% contraction) and Mining3 (15-21% contraction) (1/3)
Best Case Base Case Worst Case
184 170 153
Duration1 (no.
of days) 21 21 26 21 21 21 33 21 28 28 36
14 14 14 14
2020 2020 2020
Full Lockdown Extension Level 4 Level 3 Level 2 Level 1
cturing Services
Manufa- Govt.
17% 70% 70% 80% 89% 93% 94% 8% 70% 70% 80% 84% 88% 89% 12% 70% 70% 80% 81% 85% 86% 13%
GDP contribution per sector
13% 42% 42% 63% 85% 91% 92% 12% 42% 42% 63% 79% 85% 86% 16% 42% 42% 63% 75% 82% 83% 19%
Highly impacted sector
Retail2
8% 40% 40% 60% 82% 84% 85% 17% 40% 40% 60% 75% 77% 78% 20% 40% 40% 60% 70% 73% 74% 24%
Mining3
8% 39% 57% 73% 81% 85% 86% 15% 39% 57% 73% 76% 80% 81% 19% 39% 57% 73% 73% 77% 78% 21%
Banking
Finance
7% 56% 56% 74% 88% 93% 94% 6% 56% 56% 74% 83% 88% 89% 8% 56% 56% 74% 80% 85% 86% 10%
Trans-
port4
7% 45% 45% 60% 91% 94% 95% 10% 45% 45% 60% 85% 88% 89% 13% 45% 45% 60% 81% 85% 86% 17%
1. All cases had 86 days of a pre-lockdown phases with all sectors operating at 100%; 2. Includes wholesale trade; 3. Includes quarrying; 4. Includes storage
Source: Singular research and analysis
Singular Group xx% GDP contraction in 2020 xx% 2019 GDP contribution 21Preliminary view as of 07 May 2020 – might have to be adjusted daily based on situation and new findings
Hard hit sectors across all cases will possibly be Real estate (14-
21% contraction) & Construction (14-21% contraction) (2/3)
Best Case Base Case Worst Case
184 170 153
Duration1 (no.
of days) 21 21 26 21 21 21 33 21 28 28 36
14 14 14 14
2020 2020 2020
Full Lockdown Extension Level 4 Level 3 Level 2 Level 1
Services
Profsnl2
7% 60% 60% 80% 94% 94% 95% 8% 60% 60% 80% 88% 88% 89% 12% 60% 60% 80% 84% 85% 86% 14%
Highly impacted sector
Estate
Real
GDP contribution per sector
6% 30% 30% 55% 79% 92% 93% 14% 30% 30% 55% 73% 86% 87% 18% 30% 30% 55% 69% 83% 84% 21%
truction Services
Food
6% 50% 50% 65% 94% 94% 95% 9% 50% 50% 65% 87% 87% 88% 13% 50% 50% 65% 82% 83% 84% 17%
Highly impacted sector
Cons-
4% 20% 20% 50% 91% 92% 93% 14% 20% 20% 50% 84% 87% 88% 18% 20% 20% 50% 79% 83% 84% 21%
Insur-
ance
3% 65% 65% 75% 83% 85% 86% 13% 65% 65% 75% 79% 81% 82% 16% 65% 65% 75% 77% 80% 81% 17%
Health-
care
3% 110% 130% 120% 140% 131% 132% 27% 110% 130% 120% 132% 124% 125% 20% 110% 130% 120% 126% 119% 120% 16%
1. All cases had 86 days of a pre-lockdown phases with all sectors operating at 100%; 2. Professional
Source: Singular research and analysis
Singular Group xx% Sectors with GDP growth in 2020 xx% GDP contraction in 2020 xx% 2019 GDP contribution 22Preliminary view as of 07 May 2020 – might have to be adjusted daily based on situation and new findings
Hardest hit sectors across all cases will possibly be Recreation5
(32-40% contraction) & Hospitality6 (38-46% contraction) (3/3)
Best Case Base Case Worst Case
184 170 153
Duration1 (no.
of days) 21 21 26 21 21 21 33 21 28 28 36
14 14 14 14
2020 2020 2020
Full Lockdown Extension Level 4 Level 3 Level 2 Level 1
Tele-
com2
3% 65% 65% 80% 95% 95% 96% 7% 65% 65% 80% 89% 90% 92% 11% 65% 65% 80% 86% 87% 89% 12%
Agri3
GDP contribution per sector
2% 69% 69% 83% 96% 96% 97% 5% 69% 69% 83% 90% 91% 92% 9% 69% 69% 83% 86% 87% 87% 12%
Utilities4
2% 70% 70% 80% 98% 99% 100% 3% 70% 70% 80% 84% 88% 89% 11% 70% 70% 80% 81% 82% 83% 15%
Highly impacted sector
Recre-
ation5
2% 5% 5% 15% 62% 69% 70% 32% 5% 5% 15% 55% 62% 63% 37% 5% 5% 15% 50% 58% 59% 40%
Educa-
tion
2% 30% 30% 45% 83% 87% 88% 16% 30% 30% 45% 79% 83% 84% 20% 30% 30% 45% 77% 82% 83% 22%
Highly impacted sector
Hospi-
tality6
1% 5% 6% 20% 52% 59% 60% 38% 5% 6% 20% 45% 52% 53% 39% 5% 6% 20% 40% 48% 49% 46%
100% 10% 14% 17%
1. All cases had 86 days of a pre-lockdown phases with all sectors operating at 100%; 2. Telecommunication; 3. Includes forestry & fishing; 4. Includes electricity, water & gas ;
5. Includes culture & sports; 6. Includes hotels and restaurants; Source: Singular research and analysis
Singular Group xx% Sectors with GDP growth in 2020 xx% GDP contraction in 2020 xx% 2019 GDP contribution 23Preliminary view as of 07 May 2020 – might have to be adjusted daily based on situation and new findings
2020 GDP to contract by 10%-17% (yoy, real terms) and lost GDP
recovery expected by Q3 2024 to Q3 2027, under 3 cases
Best Case Base Case Worst Case
28 days of
21 day long
Impact of cautious
period of
-10% lockdown and -14% -17% release at
2020 Real 6 6 cautious 6
5.1 14 days of 5.1 5.1 level 4,
GDP vs. 4.6
staggered 4.4 release 4.2 followed by a
2019 Real 4 4 during level 4
release second
4, followed
GDP during level by 21 days
wave forces
(in trillion 2 4 2 2 28 days at
at level 3
ZAR) level 3
0 0 0
2019 2020 2019 2020 2019 2020
Expected to have a growth surge during late 2021/early 2022
Contraction Recovery due to delayed consumption from COVID-19 pandemic
SA Real 1.6 Q2: 25-32% 2021 GDP growth: 1.1 – 2.2%
GDP Q3: 7-17% 2022 GDP growth: 1.7 – 2.4%
estimates Q4: 7-16% 2023 GDP growth: 1.7 – 1.8%
1.4
by
quarters 1.2 Delayed bounce back
drives a contraction of Slow to recover as extended release prevents key
for 3
~17% in Q3 and ~16% in industries from ramping up operations quick enough to
different 1.0
capture demand during 2022, as 2021 focuses on
Q4, delaying ramp-up in
cases growth by ~3 years recovering from recession
(in trillion 0.8
Q1 Q2 Q3 Q4 Q1 Q2 Q3 Q4 Q1 Q2 Q3 Q4 Q1 Q2 Q3 Q4 Q1 Q2 Q3 Q4 Q1 Q2 Q3 Q4 Q1 Q2 Q3 Q4 Q1 Q2 Q3 Q4 Q1 Q2 Q3 Q4
ZAR)
2019 2020 2021 2022 2023 2024 2025 2026 2027
Best case Base case Worst case Expected time to recover ~70% of 2020 GDP loss Average 2019 quarterly GDP
Source: World Bank, Goldman Sachs, Tackling COVID-19 in Africa (2020), How the coronavirus is killing SA’s economy (2020), COVID-19: Briefing materials (2020), Singular research and analysis
Singular Group 24Preliminary view as of 07 May 2020 – might have to be adjusted daily based on situation and new findings Contents of this document A. A Virus and Healthcare: How could COVID-19 develop in South Africa? B. B Policy and Economy: What could unfold in the next few months? B. C External Shocks and Business Response: How do companies respond? Singular Group 25
Preliminary view as of 07 May 2020 – might have to be adjusted daily based on situation and new findings

Business, social and biological systems have shown us that
recovering from shocks depends on three resilience characteristics
                                                                                                             Resilience characteristics / building blocks of companies
                                                                                                             that are recover from external shocks
                                                        Strategy
                                                                                                                        RESPONSIVE: Mobilise resources quickly in a crisis to mitigate
                                                                                                                        losses, restructure (if required) and exploit potential
                                                                                                                        opportunities
 Company structure

                                                                                           Product & Sales
                                                                 Management
                                                   Procurement
                                   Investment

                                                                                                                        ADAPTIVE: Proactively scan the market on an ongoing basis to

                                                                              Operations
                     Finance

                                                                                                                        identify threats and opportunities early, adapt and pivot products
                                                                   Talent
                                                                                                                        and business model quickly

                                                                                                                        THINK IN ECOSYSTEMS: Create reasonable duplication (e.g.
                                                                                                                        layered supplier networks) and connections to partners, to create
                                                Org & Governance
                                                                                                                        buffer capacity in a crisis

                                                                                                             External shocks impacting businesses during a crisis
External shocks

                                                                                                                         ECONOMICS: Micro and macro policy shifts impacting the
                                                                                                                         business operating environment

                                                                                                                         REGULATION: Control and monitoring measures affecting
                                                                                                                         business processes and compliance requirements

                                                                                                                         CONSUMER BEHAVIOUR: Changes in consumer demand,
                                                                                                                         buying behaviour and purchasing power

                                                                                                                         GEOPOLITICS: Shifts due to globalisation, international trade
                                                                                                                         dynamics and global business model approaches

Source: How to build a business that survives a 100 years (2016), Singular analysis
Singular Group                                                                                                                                                                          26
External Preliminary view as of 07 May 2020 – might have to be adjusted daily based on situation and new findings
shocks
External shocks: Trends along economics, regulations, consumer
behaviour and geopolitics will shape a ‘new normal’ for businesses
“Knee A new
The Fall jerk”
The Turnaround Structural The Bounce Back way of
~6 months ~6 months-2 years changes ~4-8 years
reactions living
RESCUE STIMULUS DEMAND & SUPPLY SIDE STIMULUS INVESTMENT STIMULUS
• Investment into grant and loan pools, tax • Increase government spending to • Investment in infrastructure and
1 exemptions and subsidies (fiscal policy) stimulate demand (expansionary policy) reshoring to create employment
ECONOMICS
EVERY INDUSTRY IS IN HYGIENE HYGIENE STANDARDISED BUSINESS HEALTH IMMUNITY
• Required PPE worn at the workplace • Workplace hygiene standards (e.g. • Minimum healthcare training
WORKFORCE LIMITATIONS minimum air quality level required) requirements for all businesses
2 • Limited workforce during shifts (e.g. FINE LINE TO PUBLIC PRIVACY PUBLIC CONNECTEDNESS
33% allowed to go back to work) • Laws to track individual health status • Regulations for more businesses to be
connected to cloud to access inflow in
REGULATION real-time
MINIMAL HUMAN INTERACTION ONLINE LIVING DIGITAL DATA PROTECTION
• Preference for working remotely (i.e. • Increased activity on e-commerce • Increase in demand for digitalisation of
working from home) platforms records and data
3
FRUGAL LIFESTYLE HEALTH CONSCIOUS DIGITAL OVER PHYSICAL PRESENCE
CONSUMER • Increased spend on essential items • High demand for digital engagement • More spend on digital for work flow,
BEHAVIOUR (e.g. between patients and doctors) entertainment, shopping, etc.
Deep dive on next slide
CHANGE RELATIONSHIP STATUS INTERNATIONAL PROTECTION DIGITAL GLOBALISATION
• Relaxation in trade agreements (e.g. lift • Increase in intra-continental trade (e.g. • Remote working increases connectivity to
regulations for more trade) Nigeria supplies Ghana oil, etc.) bounce back globalisation
4
BACKLASH AGAINST CHINA BUSINESSES OF THE FUTURE
• Stimulus to shift away from China (e.g. • Diversification of businesses into new
GEOPOLITICS Japan spending $2bn on reshoring) markets and sectors
Source: COVID-19 perspectives (2020), COVID-19 Business Impact (2020), Post COVID-19 business model: Finding the new normal (2020), Singular research
Singular Group 27External Preliminary view as of 07 May 2020 – might have to be adjusted daily based on situation and new findings
shocks
Deep dive: How has the shift from physical interactions to digital
impacted and changed different industries?
Industry outlook after The Turnaround (~6 months - 2 years)
Structural positive
(permanent change,
revenue generating)
Collaboration
software
Telehealth For segments
Online
Recruitment, that were already
groceries Meal kits
Will augmented reality be culture and operational prior
integrated into traditionally performance to Food delivery to crisis, will
be increasingly eLearning accelerated
experiential services, such Freelance
managed Telecom/ demand stay?
as property viewing?
remotely? hosting
Remote talent
Cyclical negative management Cyclical positive
(temporary change, Professional Gaming (temporary change,
Real estate services Fintech Streaming
revenue losing) apps video/music revenue generating)
Will Fintech adoption permeate
Hospitality to lower income customers?
Sporting (e.g. government grants)
Luxury health
events and beauty
Travel Gambling and
casino
Sharing
economy
Ride hailing
Car sharing Is the car sharing
economy over?
Structural negative High negative impact
(permanent change, Medium negative impact
revenue losing) Medium negative impact
High negative impact
Source: Dealroom.co, Singular research
Singular Group 28Resilience Preliminary view as of 07 May 2020 – might have to be adjusted daily based on situation and new findings
elements
Resilience elements: Survivors of external shocks responded fast,
adapted in the long term and setup modular ecosystems…
To understand characteristics that make companies resilient, we studied Our analysis shows that
various companies that were able to recover or thrive from external shocks companies have 3 characteristics
• Implemented RESPONSIVE
2008 rationalization and Immediate “sacrifices” to maintain
financial short-term changes, a healthy balance sheet during the
crisis based on reduced worst of times
consumer buying power
ADAPTIVE
• Moved with trends or Continuously scan the market (for
Digital adjacencies to prevent new trends, technologies and
disruption being knocked out by threats),
industry disruption adapt and change fast
THINK IN ECOSYSTEMS
Duplication and connections to
Supply • Setup ecosystems to external partners that creates
chain create modularity and buffering capacity in components of
disruption redundancy the business system
Source: Lead Your Business Through the Coronavirus Crisis (2020), Singular research
Singular Group 29Resilience Preliminary view as of 07 May 2020 – might have to be adjusted daily based on situation and new findings
elements
…these elements have been successfully applied by various
businesses to respond to shocks during and after a crisis
RESPONSIVENESS ADAPTIVITY THINK IN ECOSYSTEMS
Due to JIT, Toyota
had only 1 day of
buffer parts
Costco focused on short term “crisis gains” Fujifilm was able to monitor trends effectively Toyota relied on the in-built redundancy of its
when the 2008 financial crisis impacted & pivot when the shift to digital photography supplier ecosystem when a fire burnt down a
consumer buying power... threatened their core film business… sole supplier (Aisin) of a brake-related part…
SMALL WINS MONITOR BUILD PARTNERS
o Predicted the shift in consumer buying o Continuously watched market and o Suppliers were already organised into
from hard goods to staples adjacent revenue growths (noticed spike “keiretsu” – a network of separate
o Refocused resources on the businesses in digital sales) suppliers that work collaboratively
which could make money (e.g. ramped o Compared existing technology and skills (typically 2-3 suppliers make a part)
up private label brand to cater to to future needs to identify opportunities o Toyota set up a war-room, got the
consumer brand switching and increased other suppliers to provide additional
demand for discounts) BUILD FROM THE CORE engineers to build machines that
o Utilised its core capability for the anti- produce the part; commenced
CUT COSTS DEEP AND WIDE aging of camera film to develop and test production and delivery within 4 days
o Limited SKUs options to enable improved anti-aging skin products
bulk buying (i.e. procurement costs) o Quickly diverted investment (37% of LEVERAGE OTHERS TO FILL THE GAPS
o Scaled cost cutting on small cost total spend) to skincare opportunities o Aisin leveraged to provide technical
components (e.g. changing from round o Rapidly acquired skincare capabilities assistance, design drawings, machine
peanut jars to cubic, reducing packaging (acquisitions of cosmetic and tools, and raw materials to help
and logistics expenses) pharmaceutical companies) interim suppliers ramp up production
• Overall retail sales went down ~8% in • Launched a successful anti-aging skin care • Assembly plants were reopened after only
2009, while Tesco was up 2% range (Astalift) in 2007 five days of shutdown
• Costco carried ~4500 SKUs, ~10% the • In a few years, expanded to China, • Toyota has since increased parallel
amount of competitors (Wal-Mart & Target) Southeast Asia, and Europe sourcing (redundancy)
Key case points
Source: Lead Your Business Through the Coronavirus Crisis (2020), Singular research
Singular Group 30Resilience Preliminary view as of 07 May 2020 – might have to be adjusted daily based on situation and new findings
elements
If you are an entrepreneur that wants to survive – you will be
thinking about four things
1 2 3 4
WHAT ARE THE HOW DO I CUT WHAT ARE MY WHO CAN I
SHORT-TERM COSTS DEEP CORE CONNECT WITH,
PRODUCT AND WIDE? CAPABILITIES? LEARN AND
CHANGES THAT PULL
WILL SELL SOLUTIONS
TODAY? FROM?
What do my What is my cost How do I leverage Instead of re-building
customers need restructure and how this to pivot? my entire house –
today and how could many pennies can I are there parts which
I leverage my collect from each I can buy pre-built?
company to offer it bucket?
to them?
Source: Singular
Singular Group 31Resilience Preliminary view as of 07 May 2020 – might have to be adjusted daily based on situation and new findings
elements
Practical steps: Responses to external drivers impacting a
business will differ depending on financial health of the business
Stage of
economy The Fall The Turnaround The Bounce Back
Company
financials
STAY LIQUID MAKE STRUCTURAL PIVOT TO
AS POSSIBLE CHANGES TO COSTS NEW NORM
E.g. focus primarily on E.g. restructure to optimise E.g. optimise supply
accumulating cash from all labour costs (i.e. labour networks (localise for supply
sources (financing, payment reduction; reallocate talent) surety, offshore remote
Distress
deferrals, etc.) needs, etc.)
Deep dive on next slide
STABILISE ABOVE ADAPT THE GROW
ALL ELSE BUSINESS MODEL THE CORE
E.g. proactively drive E.g. modify the business and E.g. build the core through
customer price & payment operating model in line with new customer channels and
Moderate
terms negotiation new customer demands products
(contactless delivery, etc.)
SEARCH FOR SECURE WIDEN THE GAP
NEW WINS NEW WINS CREATED
E.g. make structural changes E.g. execute value-for- E.g. integrate operating
(governance, etc.) to enable money & add-on (i.e. model (existing + new
quick release of funding for additional capabilities) acquisitions)
Healthy
new pivots / ideas acquisitions
Source: Singular
Singular Group 32Resilience Preliminary view as of 07 May 2020 – might have to be adjusted daily based on situation and new findings Response
elements framework
Deep dive: Commercial construction companies should prioritise
hygiene, low capital conversions and even new markets
The Fall The Turnaround The Bounce Back
~6 months ~6 months-2 years ~4-8 years
WHY
STAY LIQUID CHANGE STRUCTURES TO PIVOT TO
Strategy
AS POSSIBLE SHIFT OFFERING FOCUS NEW NORM
▪ Accumulate cash from all sources ▪ Implement stringent cash ▪ Free up debt – repay as revenue
Finance (e.g. financing, payment deferrals) monitoring (e.g. establish cost starts coming in
monitoring software)
▪ Free up capital (e.g. freeze new ▪ Clean up portfolio – review, ▪ Partner with tech companies to add
Investment capital spend) mothball, divest from low potential “healthy building” capabilities (e.g.
business units premium air quality filtration)
▪ Negotiate flexible payment options ▪ Introduce equipment sharing with ▪ Optimise supply chain based on
Procurement with non-critical spend (e.g. lease competitors to reduce leasing costs “learnings” (e.g. localise for supply
WHAT
agreements, services) surety or offshore remote needs)
▪ Introduce variable pay ▪ Implement remote working ▪ Upskill employees to focus on new
Talent
Management
▪ Distribute accountability / decision employee engagement and sectors (e.g. healthy building
making power development tools development)
▪ Implement “hygiene in construction” ▪ Setup lean construction / “takt ” 1 ▪ Invest in PMO software to improve
Operations ▪ Isolate shifts from each other processes to reduce deliverable delivery, track human interaction
▪ Co-develop laws with Government costs and reduce costs further
▪ Negotiate “pay-as-you-go” initiatives ▪ Offer low capital conversions ▪ Pivot construction offering to
Product &
that link payment to milestones ▪ Offer construction as a service “winning” markets (e.g. education,
Sales
achieved ▪ Offer modular construction healthcare, low cost housing, etc.)
SWAT team tasked with ▪ A Neural Network Org/
HOW
Org &
Governance ▪ SWAT Team(s) responses and will eventually
snowball into an Ecosystem
System of Ecosystems
RESPONSIVE ADAPTIVE THINK IN ECOSYSTEMS
Key responses
1. Based on Toyota’s lean performance principles and is the speed of work cycles needed to complete construction to meet customer demand
Source: Shaping the future of construction (2017), COVID-19: What it means for construction and engineering (2020), Reviving the construction sector post-COVID-19 (2020), Singular research
Singular Group 33Resilience Preliminary view as of 07 May 2020 – might have to be adjusted daily based on situation and new findings
elements What
Talent: Toyota and Unilever are adopting engagement apps to
monitor motivation, communicate and e-learn (case example)
Companies adopting Example: Beaconforce is an app-based tool that combines behavioural
employee engagement tools sciences and machine learning to track employee motivation
Sends push notifications Tracks employee Enables staff to develop
/ mass motivation and helps remote self-
communication as identify employees that management skills
well as online surveys need support and shares training
videos and material to
mobile devices
Note: Beaconforce is an employee engagement platform in partnership with Singular Africa
Singular Group 34Resilience Preliminary view as of 07 May 2020 – might have to be adjusted daily based on situation and new findings
elements How
SWAT: Organisations need to setup a SWAT team to collect
intelligence and make fast fact-based decisions on BIG WINS
WHAT WHO HOW
• Internal team for the “first line of • Executive – decision Maker (COO, MONITOR:
fighting” CPO, CFO, CDO) • Sets up and manages a simple data
room – connected to multiple
• Consists of senior executive and • Legal – What are the legal &
partners and sources
leadership for rapid decisions while compliance hurdles?
• Develops tracking dashboard to
on the field
• PMO – How can we practically enable data-driven decision making
• Collects and incorporate facts implement this project?
and intelligence, by establishing UNDERSTAND IMPACT:
• Finance - What is the financial
partnerships and networks of data • Updates business scenarios
impact of our decisions?
channels • Links scenarios to profit and loss
• People – Are we being transparent and business strategy taking into
• Makes IMMEDIATE decisions on
and engaging staff well? account threats and opportunities
programs on BIG WINS only (e.g.
large cost savings, major • Topic relevant specialists –
restructuring, new investments – key technology, supply chain, tax, lean RESPOND:
value drivers of the business) • Defines response plan initiatives
• Manages problem solving and
execution with sub teams
Three to four teams to allow for
• Hosts weekly feedback loops with
shift work and sustained CEO
effectiveness over a
prolonged crisis event
Singular Group 35Resilience Preliminary view as of 07 May 2020 – might have to be adjusted daily based on situation and new findings
elements How
Ecosystem: Increase in business complexity and need for speed
will require an ecosystem approach
Let your SWAT team be the architect of your “new normal” organisation
New key complexities:
Research
• Value Chain & Finance
partners Traders o Which products and services do we
Data & onshore? Offshore?
Analytics o How do we access financing?
o How can we stabilise our supply chain?
Labour
partners Invest- • People
People ments o How could the post-COVID team structure
work better?
o How do we reskill remotely?
Business leadership
• Technology
o How do we ride the digitisation wave?
Investors o How do we pivot to online channels?
SWAT o How do we improve our ability to innovate?
Executive
Suppliers
Execs Committee team
• Data & Analytics
o When will markets rebound?
o What’s the status on employee health?
Value Techno-
Chain & logy • Investments
Customers
Finance o How do we snatch up cheap investments?
o Which investments should we be looking
out for?
Commun- Tech-
Health & nology
ity • Health & regulations
Strategic
Govern- regulatio partners
ment ns o How do we catch up with new health and
advisors
safety measures?
Singular Group 36You can also read