2021 Assessment of Oil and Gas Resources: Alaska Outer Continental Shelf Region
←
→
Page content transcription
If your browser does not render page correctly, please read the page content below

2021 Assessment of Oil and Gas Resources   Alaska Outer Continental Shelf Region

2021 Assessment of Oil and Gas Resources:
Alaska Outer Continental Shelf Region

U.S. Department of the Interior                                 OCS Report
Bureau of Ocean Energy Management                             BOEM 2021-066
Alaska Outer Continental Shelf Region
2021 Assessment of Oil and Gas Resources:
Alaska Outer Continental Shelf Region
Office of Resource Evaluation

               Front Cover. Map of the Alaska OCS Region showing planning areas
                 and the assessed limit of Undiscovered Technically Recoverable
               Resources defined for the 2021 National Assessment. Planning areas
                                  are as annotated on the map.

U.S. Department of the Interior
Bureau of Ocean Energy Management                                           Anchorage, Alaska
Alaska Outer Continental Shelf Region                                           October 2021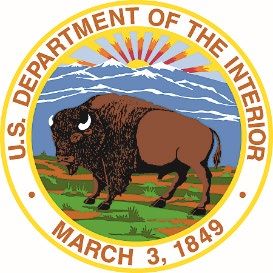
2021 Assessment of Oil and Gas Resources                                                       Alaska Outer Continental Shelf Region

Table of Contents
Abbreviations and Acronyms ..................................................................................................ii
Executive Summary ..................................................................................................................1
Introduction ...............................................................................................................................1
Planning Areas ..........................................................................................................................4
Resource Assessment Results ................................................................................................6
   Undiscovered Technically Recoverable Resources .............................................................................. 6
   Undiscovered Economically Recoverable Resources (UERR) ............................................................ 13
Regional Economic Assumptions .........................................................................................14
   UERR Model Parameter Changes...................................................................................................... 15
   Capital Cost Updates ......................................................................................................................... 15
   Transportation Tariffs ......................................................................................................................... 17
      Tangible Fractions ......................................................................................................................... 19
   Summary of UERR Assessment Results ............................................................................................ 20
References ..............................................................................................................................22
Glossary ..................................................................................................................................23

                                                            List of Tables
Table 1:            Risk UTRR of the Alaska OCS Region Play ...................................................................... 7
Table 2:            Undiscovered Technically Recoverable Oil and Gas Resources of the Alaska OCS
                    Region by Planning Area (2021) ..................................................................................... 11
Table 3:            Alaska OCS Planning Area Cost Adjustment Factors ...................................................... 14
Table 4:            Comparison of Alaska OCS Planning Areas Estimated UERR (Oil and Gas) ................... 20

                                                           List of Figures
Figure 1:           Map showing Alaska OCS Region, Planning Areas, and Assessed Area........................... 3
Figure 2:           Undiscovered Technically Recoverable Oil and Gas Resources of the Alaska OCS
                    Region by Planning Area ................................................................................................ 12
Figure 3:           Beaufort Sea OCS Estimated Exploration Costs in Million $ versus Drilling Depths at
                    Various Water Depth Tranches ...................................................................................... 16
Figure 4:           Comparison of Estimated Production Platform Well Drilling and Completion Costs .......... 18
Figure 5:           Estimated Transportation Tariff Costs for Alaska OCS Planning Areas ............................ 19
Figure 6:           Comparison of UERR results by planning area from the 2016 and 2021 National
                    Assessment. .................................................................................................................. 21

Table of Contents                                                                                                                                    i
2021 Assessment of Oil and Gas Resources Alaska Outer Continental Shelf Region Abbreviations and Acronyms API American Petroleum Institute O API Degrees API, a unit of measurement of the American Petroleum Institute for the gravity of oil Bbbl billion (109) barrels bbl barrels BBOE billion (109) barrels of oil-equivalent resources BOE barrels of oil-equivalent resources BOEM Bureau of Ocean Energy Management cf cubic feet DOI Department of the Interior LNG liquified natural gas Mcf thousand (103) cubic feet MMbbl million (106) barrels OCS Outer Continental Shelf TAPS Trans-Alaska Pipeline System Tcf trillion (1012) cubic feet UERR undiscovered, economically recoverable resources UTRR undiscovered, technically recoverable resources U.S. United States Acronyms and Abbreviations ii
2021 Assessment of Oil and Gas Resources                   Alaska Outer Continental Shelf Region

Executive Summary
The U.S. Bureau of Ocean Energy Management performs an Outer Continental Shelf (OCS)-
wide assessment of undiscovered oil and gas resources every five years to inform the scoping
and development of the National OCS Oil and Gas Leasing Program. This assessment provides
estimates of undiscovered, technically and economically recoverable oil and natural gas
resources located outside of know oil and gas fields on the Alaska OCS. The assessment
utilizes a probabilistic play-based approach to estimate the Undiscovered Technically
Recoverable Resources (UTRR) and Undiscovered Economically Recoverable Resources
(UERR) of oil and gas for individual geologic plays in 11 of the 15 Alaska OCS planning areas.
Four planning areas (Aleutian Arc, Aleutian Basin, Bowers Basin, and St. Matthew-Hall) are not
evaluated in this assessment due to their negligible petroleum potential. Volumes are reported
at the 5th and 95th percentiles in addition to the mean value to capture a reasonable range of
uncertainty within the modeled results.

The total volume of undiscovered technically recoverable resources in the Alaska Region is
estimated to be 46.76 BOE (mean case). The planning areas that contain the most
undiscovered resources are Chukchi Sea and Beaufort Sea, which account for about 82% of
BOE (mean case) in the Alaska OCS. While the Chukchi Sea Planning Area showed a modest
increase in resources from the 2016 assessment, resources in the Beaufort Sea Planning Area
dropped significantly due to the new risking methodology and a lowered chance of success in
the Upper Ellesmerian Beaufort Sea play.

Executive Summary                                                                          ES-1
2021 Assessment of Oil and Gas Resources                       Alaska Outer Continental Shelf Region

Introduction
The Bureau of Ocean Energy Management (BOEM) is charged with the management and
development of energy and mineral resources on the Outer Continental Shelf (OCS) of the
United States (U.S.) in an environmentally and economically responsible way. This mandate
includes assessing the amount of technically and economically recoverable undiscovered oil
and natural gas resources on the U.S. OCS.

This report documents the 2021 assessment of undiscovered technically and economically
recoverable oil and gas resources of the Alaska OCS Region. The Alaska OCS Region
comprises submerged lands that extend from the seaward limit of State of Alaska waters (three
miles offshore) to the U.S.-Canadian maritime boundary in southeastern Alaska, west and north
to the U.S.-Russian maritime boundary in the Bering Sea, and the northeast to the U.S-Canada
maritime boundary in the Beaufort Sea (Figure 1).

The 2021 assessment of the Alaska OCS Region provides an updated appraisal of the location
and volume of undiscovered resources. It is based upon geological work that was performed for
the 1995 Undiscovered Oil and Gas Resources, Alaska Federal Offshore and compiled into
OCS Report MMS 98-0054 (Sherwood, et al., 1998). New well data, geologic interpretations,
and technologies (as of January 1, 2019) are incorporated with updated economic scenarios
into the 2021 assessment by a team of geoscientists and engineers in Anchorage, Alaska. The
team utilizes a large volume and variety of proprietary and nonproprietary data (including
geologic, geochemical, geophysical, petroleum engineering, and economic data). The
hydrocarbon resources assessed include oil (crude oil and condensate) and natural gas
(associated and non-associated gas).

There are many uncertainties regarding the geologic framework and petroleum geologic
characteristics of a given area and the location and volume of its undiscovered oil and gas
resources. BOEM uses a play-based approach for identification and estimation of geologic
resource parameters. BOEM employs probabilistic techniques to capture the range of
uncertainty in the geologic resource assessment factors. Undiscovered resource volume
estimates are generated stochastically and are reported at the mean and at the95th and 5th
percentiles. This range of estimates corresponds to a 95 percent probability (a 19 in 20 chance)
and a 5 percent probability (a 1 in 20 chance), respectively, of more than those volumes of
undiscovered resource within the reported area at the reported scale.

For the purpose of this report, oil is a liquid hydrocarbon resource, which may include crude oil
and/or condensate. Crude oil exists in a liquid state in both subsurface and surface conditions.
Condensate (natural gas liquids) is a very high API gravity (generally greater than 50° API)
liquid; it may exist in a dissolved gaseous state at subsurface conditions but drops out as liquid
at surface conditions. The volumetric estimates of oil resources from this assessment represent
combined volumes of crude oil and condensate and are reported as standard stock tank barrels
(barrels or bbl).

Natural gas is a gaseous hydrocarbon resource, which may include associated and/or non-
associated gas. The terms natural gas and gas are used interchangeably in this report.
Associated gas exists in spatial association with crude oil; it may exist in the subsurface as free
or undissolved gas within a gas cap or as gas that is dissolved in crude oil (solution gas). Non-
associated gas (dry gas) does not exist in association with crude oil. Gas resources that can be

Introduction                                                                                      1
2021 Assessment of Oil and Gas Resources                      Alaska Outer Continental Shelf Region

removed from the subsurface with conventional extraction techniques are assessed for this
project; unconventional gas resources, such as shale gas and gas hydrates, are not assessed.
The volumetric estimates of gas resources from this assessment represent aggregate volumes
of associated and non-associated gas and are reported as standard cubic feet (cubic feet or cf).

Oil-equivalent gas is a volume of gas (associated and/or non-associated) expressed in terms of
its energy equivalence to oil (5,620 cf of gas per barrel of oil) and is reported as barrels. The
combined volume of oil and oil-equivalent gas resources is referred to as combined oil-
equivalent resources or BOE (barrels of oil equivalent) and is reported as barrels.

Two categories of undiscovered resources are reported in this volume. Undiscovered,
technically recoverable resources (UTRR) are those resources that can be removed from the
subsurface with conventional extraction techniques. Undiscovered, economically recoverable
resources (UERR) are those undiscovered technically recoverable resources that can be
commercially extracted under specified economic and technological conditions.

The total resource endowment is the sum of the volume of undiscovered resources, contingent
resources, reserves, and cumulative production. For areas where there are no known
discoveries and no current or historical production, the volume of undiscovered, technically
recoverable resources comprises the total resource endowment.

The Alaska OCS includes more than one billion acres with over 6,000 miles of coastline spread
across 15 planning areas. Four planning areas (Aleutian Arc, Aleutian Basin, Bowers Basin, and
St. Matthew-Hall) are not evaluated in this assessment due to their negligible petroleum
potential (Sherwood, et al., 1998). The remaining 11 planning areas contain the 73 petroleum
geological plays (groups of geologically related hydrocarbon accumulations) which are
assessed with quantifiable hydrocarbon resources. Several planning areas shown in Figure 1
contain a delineation representing the UTRR limit. Seaward of this limit, BOEM assesses no oil
or gas accumulations that can be recovered using conventional technology. In some cases, this
assumption is based on an assessment of the underlying geology, where the geologic
components necessary for a working petroleum system are not believed to exist (such as
around the Aleutian Arc). In other cases, such as in the Arctic Beaufort and Chukchi seas,
current technology could not produce resources from oil or gas fields outside the UTRR limit
due to the extreme ice conditions present in the region for most of the year.

2                                                                                      Introduction
2021 Assessment of Oil and Gas Resources                  Alaska Outer Continental Shelf Region

        Figure 1:   Map showing Alaska OCS Region, Planning Areas, and Assessed Area

Introduction                                                                                 3
2021 Assessment of Oil and Gas Resources Alaska Outer Continental Shelf Region
Planning Areas
For lease planning purposes the Alaska OCS is divided into fifteen planning areas (Figure 1),
which are defined based on jurisdictional boundaries, rather than on geologic features. All but
four planning areas (Aleutian Arc, Aleutian Basin, Bowers Basin, and St. Matthew-Hall) are
assessed for this report.
The Chukchi Sea OCS Planning Area offshore northwestern Alaska has an eastern
boundary near Point Barrow (156°W Longitude) and a western boundary bordering the
Russian waters of the Chukchi shelf (169°58’37”W Longitude). It extends from near Point
Hope (68°20’N Latitude) northward to 75°N Latitude.
The Beaufort Sea OCS Planning Area extends from the 3-mile limit of the State of Alaska
waters northward to 75°N Latitude. The engineering challenges associated with oil and gas
production in waters deeper than 500 meters in the Arctic Ocean are considered too great to
overcome with conventional technology and thus were not assessed. The planning area is
bounded on the west at 156°W Longitude (near Utqiagvik) and on the east at the US-
Canadian maritime boundary.
The Hope Basin OCS Planning Area lies in the southern Chukchi Sea south of Point Hope
(68°20’N Latitude) between the northwest coast of Alaska and the U.S.-Russia maritime
boundary.
The Navarin Basin OCS Planning Area is bounded on the north and west by the U.S.-
Russia maritime boundary to 63°N Latitude. To the southwest, the 200-meter isobath
represents the UTRR limit of the Navarin Basin OCS Planning Area. The planning area
extends southward to 58°N Latitude and east to 174°W Longitude.
The North Aleutian Basin OCS Planning Area extends from the three-mile limit of the
State of Alaska waters on the south and east and is bounded on the north at 59°N Latitude.
The planning area extends to the west to 165°W Longitude.
The St. George Basin OCS Planning Area extends from the 3-mile limit of the State of
Alaska waters on the south to 59°N Latitude. It is bounded on the east by the North Aleutian
Basin OCS Planning Area (165°W Longitude), on the northwest by the Navarin Basin and
Aleutian Basin OCS Planning Areas (174°W Longitude), and on the southwest by the
Bowers Basin OCS Planning Area (171°W Longitude).
The Norton Basin OCS Planning Area is bounded by the Seward Peninsula on the north
and the Yukon Delta and St. Lawrence Island (63°N Latitude) on the south and southwest,
respectively. The western boundary is defined by the United States – Russia Convention
Line of 18672.
The Cook Inlet OCS Planning Area is located in offshore Southcentral Alaska between the
Kenai Peninsula on the east and the Aleutian Range to the west. The planning area extends
southward through the waters of the Shelikof Strait just past Kodiak Island. The federal
portion of the waters of Cook Inlet and Shelikof Straight begins three miles from the State of
Alaska shoreline. For this reason, the northern part of the inlet was not assessed as it is
entirely within the jurisdiction of the State of Alaska.
4 Planning Areas2021 Assessment of Oil and Gas Resources Alaska Outer Continental Shelf Region The Gulf of Alaska OCS Planning Area extends along an 850-mile long segment of the Alaska continental margin from the southwest tip of the Kenai Peninsula on the west to Dixon Entrance at the U.S.-Canadian border on the southeast. It extends from the three-mile limit of State of Alaska waters seaward to approximately the 2,000-meter isobath on the north (continental) side of the Amatuli Trough. The Shumagin OCS Planning Area extends from the Kodiak OCS Planning Area in the northeast (156°W Longitude) to just past the Sanak Islands near the end of the Alaska Peninsula. The assessed area extends from the three-mile limit of State of Alaska waters seaward to approximately the 2,000-meter isobath on the northern (continental) side of the Aleutian Trench. The Kodiak OCS Planning Area comprises the federal offshore lands on the continental shelf and slope surrounding the Pacific coastline of the Kodiak archipelago, landward of the Aleutian Trench. The planning area extends from its northeastern boundary with the Gulf of Alaska OCS Planning Area, along the coastline of the Kodiak archipelago and along the Aleutian Trench to the boundary with the Shumagin Planning Area (156°W Longitude). The boundary of the assessed area extends from the three-mile limit of State of Alaska waters seaward to approximately the 2,000-meter isobath on the northern (continental) side of the Aleutian Trench. Planning Areas 5
2021 Assessment of Oil and Gas Resources                      Alaska Outer Continental Shelf Region

Resource Assessment Results
Undiscovered Technically Recoverable Resources
Estimates of the total volume of undiscovered technically recoverable resources (UTRR) in the
Region are developed by statistically aggregating the constituent play estimates to the planning
area, then aggregating the planning area estimates to the Region. For complete geologic
descriptions of individual plays, please refer to OCS Report MMS 98-00543. The Alaska OCS
Region is assessed to contain a total volume of (mean estimates) UTRR of 46.76 billion barrels
of oil equivalent (BBOE). Table 1 presents detailed UTRR values by planning area and play for
the P95 (95th percentile), mean, and the P5 (5th percentiles) estimates, respectively.
Operationally, BOEM employs a “greater-than” standard logic when reporting the results of our
our probabilistic modeling; i.e., 95% of the distribution of the modeled results exceed the P95
value, and 5% of the distribution of the modeled results exceed the P5 value. Figure 2
graphically displays the mean UTRR values by planning area.

The total risked oil volume of UTRR (including crude oil and condensate) of the Alaska Region
is estimated to range from 17.17 Bbbl (P95) to 34.41 Bbbl (P5) with a mean estimate of 24.69
Bbbl (Table 1). The Chukchi Sea and Beaufort Sea Planning Areas are estimated to contain
approximately 87 percent (21.46 Bbbl) of the UTRR of crude oil in the Region. The total risked
volume of undiscovered technically recoverable gas resources (including associated and non-
associated gas) is estimated to range from 90.14 Tcf (P95) to 161.64 Tcf (P5) with a mean
estimate of 124.03 Tcf. As with oil resources, the largest volumes of gas are estimated to exist
in the Chukchi Sea and Beaufort Sea Planning Areas with 77.22 percent of gas resources
assessed in these planning areas (79.60 Tcf and 16.10 Tcf, respectively).

Assessment results of UTRR by planning area are as follows:

6                                                                    Resource Assessment Results
2021 Assessment of Oil and Gas Resources                                                                                  Alaska Outer Continental Shelf Region

                 Region                                                     2021 Undiscovered Technically Recoverable Oil and Gas Resources (UTRR)
Planning Area                                                              Oil (Bbbl)                      Gas (Tcf)                   Total BOE (BBOE)
                                                        Play     95%         Mean         5%         95%         Mean           5%           95%         Mean         5%
                 Alaska OCS                                      17.00       24.69       34.08       91.07       124.03        161.63        33.21       46.76       62.84
                         Undeformed Pre-Miss. Basement            0.00        0.01        0.02        0.00        0.03          0.15          0.00        0.01        0.05
                                                    Endicott      0.00        0.06        0.31        0.00        0.13          0.42          0.00        0.09        0.38
                                                    Lisburne      0.00        0.07        0.37        0.00        0.11          0.45          0.00        0.09        0.45
                                        Upper Ellesmerian         0.27        1.20        3.00        0.38        2.18          4.04          0.34        1.59        3.72
                                                          Rift    0.05        0.52        0.42        0.09        1.32         11.00          0.06        0.76        2.37
                         Brookian Faulted Western Topset          0.00        0.17        0.85        0.00        1.49          5.89          0.00        0.44        1.90
Beaufort Sea        Brookian Unstructured Western Topset          0.01        1.08        4.33        0.18        0.68          1.89          0.04        1.20        4.67
                       Brookian Faulted Western Turbidite         0.00        0.02        0.07        0.00        0.31          1.63          0.00        0.08        0.37
                  Brookian Unstructured Western Turbidite         0.00        0.15        0.52        0.00        0.21          0.63          0.00        0.18        0.63
                          Brookian Faulted Eastern Topset         0.00        0.64        1.31        0.00        6.01         20.25          0.00        1.71        4.91
                     Brookian Unstructured Eastern Topset         0.01        0.33        0.91        0.00        0.19          1.05          0.01        0.36        1.10
                        Brookian Faulted Eastern Turbidite        0.00        0.09        0.25        0.00        1.39          6.31          0.00        0.33        1.37
                   Brookian Unstructured Eastern Turbidite        0.00        0.04        0.18        0.00        0.09          0.34          0.00        0.06        0.24
                                         Brookian Foldbelt        0.00        1.37        5.01        0.00        1.96          9.41          0.00        1.71        6.68
                                                Tertiary - Oil    0.00        0.38        0.99        0.00        0.14          0.32          0.00        0.40        1.05
                                  Mesozoic - Stratigraphic        0.00        0.18        0.69        0.00        0.08          0.43          0.00        0.20        0.76
  Cook Inlet
                                     Mesozoic - Structural        0.12        0.48        1.04        0.06        0.22          0.43          0.13        0.52        1.11
                                              Tertiary - Gas      0.00        0.00        0.00        0.00        0.74          2.01          0.00        0.13        0.36
                               Endicott - Chukchi Platform        0.00        2.67        6.61        0.00       12.51         25.09          0.00        4.89       11.07
                                 Endicott - Arctic Platform       0.00        0.04        0.11        0.00        0.58          2.25          0.00        0.15        0.51
                                                    Lisburne      0.00        0.11        0.43        0.00        0.52          2.55          0.00        0.20        0.88
                                  Ellesmerian - Deep Gas          0.00        0.03        0.16        0.00        1.07          6.72          0.00        0.22        1.36
 Chukchi Sea                Sadlerochit - Chukchi Platform        0.14        0.58        1.27        0.98        4.19          8.83          0.31        1.33        2.84
                               Sadlerochit - Arctic Platform      0.00        0.71        1.52        0.00        4.50         18.95          0.00        1.51        4.89
                                       Rift - Active Margin       1.01        3.98        7.21        5.59       13.52         34.81          2.00        6.38       13.40
                                         Rift - Stable Shelf      0.12        1.96        6.56        1.96        9.73         22.86          0.47        3.69       10.63
                                            Rift - Deep Gas       0.00        0.01        0.03        0.00        0.20          1.07          0.00        0.04        0.22

  Notes:   Resource values are in billion barrels of oil (Bbbl), trillion cubic feet of gas (Tcfg), and billon barrels of oil equivalents (BBOE). The 95%, also known as
           the P95, indicates a 95 percent chance of at least the amount listed; 5%, or the P5, indicates a 5 percent chance of at least the amount listed. Only mean
           values are additive. Some total mean values may not equal the sum of the component values due to independent rounding.

                Table 1:           Undiscovered, Technically Recoverable Oil and Gas Resources of the Alaska OCS Region by Play

  Resource Assessment Results                                                                                                                                          7
2021 Assessment of Oil and Gas Resources Alaska Outer Continental Shelf Region
Region 2021 Undiscovered Technically Recoverable Oil and Gas Resources (UTRR)
Planning Area Oil (Bbbl) Gas (Tcf) Total BOE (BBOE)
Play 95% Mean 5% 95% Mean 5% 95% Mean 5%
L. Brookian Foldbelt 0.64 1.52 2.97 3.85 8.20 12.64 1.32 2.98 5.22
L. Brookian Wrench Zone - Torok Turbidites 0.03 0.24 0.52 0.05 1.52 4.90 0.04 0.51 1.39
L. Brookian Wrench Zone - Nanushuk Topset 0.00 0.19 0.87 0.00 1.04 3.40 0.00 0.37 1.48
Brookian North Chukchi High - Sand Apron 0.00 0.81 3.21 0.00 5.46 15.00 0.00 1.78 5.88
L. Brookian N Chukchi Basin - Topset 0.00 0.17 0.48 0.00 2.00 6.47 0.00 0.53 1.63
Brookian - Deep Gas 0.00 0.01 0.07 0.00 0.46 2.59 0.00 0.09 0.53
L. Brookian - Torok-Arctic Platform 0.00 0.03 0.15 0.00 0.12 0.69 0.00 0.05 0.27
L. Brookian - Nanushuk Arctic Platform 0.03 0.42 1.33 0.05 0.82 1.34 0.04 0.56 1.57
Chukchi Sea U. Brookian - Sag Phase-North Chukchi Basin 0.00 0.01 0.11 0.00 0.07 0.21 0.00 0.03 0.15
(Con't) U. Brookian - Tertiary Turbidites-North Chukchi Basin 0.00 0.02 0.09 0.00 0.27 1.16 0.00 0.07 0.30
U. Brookian - Tertiary Fluvial Valleys 0.00 0.91 3.52 0.00 3.09 8.89 0.00 1.46 5.11
U. Brookian - Intervalley Ridges 0.00 0.35 0.93 0.00 0.57 1.56 0.00 0.45 1.21
Franklinian-Northeast Chukchi Basin 0.00 0.21 0.46 0.00 2.50 8.38 0.00 0.65 1.95
L. Brookian - Nuwuk Basin 0.00 0.25 0.82 0.00 2.06 8.37 0.00 0.61 2.31
U.Brookian - Nuwuk Basin 0.00 0.44 2.36 0.00 3.14 7.54 0.00 1.00 3.71
Hope - Late Sequence (HB Play 1) 0.00 0.02 0.09 0.00 0.53 2.69 0.00 0.12 0.57
Hope - Early Sequence (HB Play 2) 0.00 0.02 0.07 0.00 0.57 2.71 0.00 0.12 0.55
Hope - Shallow Basal Sands (HB Play 3) 0.00 0.01 0.04 0.00 0.34 1.51 0.00 0.07 0.31
Middleton Fold and Thrust Belt 0.00 0.01 0.04 0.00 0.41 1.79 0.00 0.08 0.36
Yakataga Fold and Thrust Belt 0.00 0.15 0.56 0.00 0.93 3.71 0.00 0.31 1.22
Gulf of Alaska Yakutat Shelf- Basal Yakataga Formation 0.00 0.12 0.42 0.00 0.64 2.28 0.00 0.23 0.83
Yakutat Shelf - Kulthieth Sands 0.00 0.31 0.90 0.00 2.05 6.83 0.00 0.68 2.12
Subducting Terrane 0.00 0.07 0.27 0.00 0.30 1.12 0.00 0.13 0.47
Late Tertiary Sequence 0.00 0.08 0.22 0.00 1.95 8.16 0.00 0.43 1.68
Hope Basin Early Tertiary Sequence 0.00 0.03 0.09 0.00 0.72 3.30 0.00 0.15 0.68
Shallow Basal Sands 0.00 0.03 0.10 0.00 0.84 3.57 0.00 0.18 0.74
8 Resource Assessment Results2021 Assessment of Oil and Gas Resources Alaska Outer Continental Shelf Region
Region 2021 Undiscovered Technically Recoverable Oil and Gas Resources (UTRR)
Planning Area Oil (Bbbl) Gas (Tcf) Total BOE (BBOE)
Play 95% Mean 5% 95% Mean 5% 95% Mean 5%
Miocene Basin Sag 0.00 0.03 0.13 0.00 0.16 0.78 0.00 0.05 0.27
Late Oligocene Basin Shelf 0.00 0.20 0.59 0.00 1.49 5.12 0.00 0.46 1.50
Navarin Basin Oligocene Rift Subbasin Neritic Fill 0.00 0.02 0.07 0.00 0.15 0.87 0.00 0.04 0.23
Oligocene Rift Subbasin Bathyal Fill 0.00 0.01 0.05 0.00 0.19 1.19 0.00 0.05 0.26
Eocene Rift Onset 0.00 0.01 0.03 0.00 0.15 0.88 0.00 0.03 0.18
Bear Lake/Stepovak (Miocene/Oligocene) 0.00 0.45 3.45 0.00 6.17 3.82 0.00 1.55 4.13
Tolstoi Fm. (Eocene/Paleocene) 0.00 0.11 0.18 0.25 2.29 5.86 0.05 0.52 1.22
North Aleutian
Basin Black Hills Uplift - Amak Basin 0.00 0.15 0.88 0.00 0.29 0.65 0.00 0.20 1.00
Mesozoic - Deformed Sedimentary Rocks 0.00 0.04 0.20 0.00 0.02 0.10 0.00 0.05 0.22
Mesozoic Basement - Buried 'Granite Hills' 0.00 0.04 0.30 0.00 0.24 0.58 0.00 0.08 0.41
Upper Tertiary Basin Fill 0.00 0.01 0.05 0.00 0.55 2.52 0.00 0.11 0.49
Mid-Tertiary East Subbasin Fill Play 0.00 0.00 0.03 0.00 0.24 1.36 0.00 0.05 0.27
Norton Basin
Mid-Tertiary West Subbasin Fill 0.00 0.05 0.18 0.00 2.50 9.97 0.00 0.49 1.95
Lower Tertiary Subbasin Fill 0.00 0.00 0.01 0.00 0.07 0.38 0.00 0.01 0.08
Graben 0.00 0.10 0.25 0.00 1.07 2.67 0.00 0.29 0.72
South Platform 0.00 0.03 0.14 0.00 0.80 3.71 0.00 0.18 0.80
St. George Basin
North Platform 0.00 0.03 0.08 0.00 0.54 3.04 0.00 0.13 0.62
Pribilof Basin 0.00 0.05 0.15 0.00 0.39 2.04 0.00 0.12 0.51
Shumagin Neogene Structural Play (Shumagin Shelf) 0.00 0.01 0.04 0.00 0.41 1.79 0.00 0.08 0.36
Kodiak Neogene Structural Play (Kodiak) 0.000 0.042 0.105 0.000 1.60 7.138 0.000 0.33 1.375
Resource Assessment Results 92021 Assessment of Oil and Gas Resources Alaska Outer Continental Shelf Region Chukchi Sea: The 2021 assessment of the Chukchi Sea OCS Planning Area identified 29 exploration plays, 27 of which were assessed with quantifiable hydrocarbon resources. The planning area is oil-prone, with 53 percent of the UTRR consisting of oil and condensate. Beaufort Sea: The 2021 assessment of the Beaufort Sea OCS Planning Area identified 14 exploration plays. Plays are mostly oil prone, however four plays are gas-prone, with 68 percent of the undiscovered hydrocarbon potential consisting of oil. Hope Basin: The 2021 assessment of the Hope Basin OCS Planning Area identified four exploration plays, three of which were assessed for their oil and gas potential. The three quantified plays in the Hope Basin OCS Planning Area are predominantly (79 percent) gas plays with a minor volume of oil in smaller, mixed (oil and gas) pools. Navarin Basin: The 2021 assessment of the Navarin Basin OCS Planning Area identified six exploration plays, five of which were assessed for their oil and gas potential. The planning area is gas-prone, with 63 percent of the undiscovered hydrocarbon potential consisting of natural gas with some associated oil and/or gas condensate. North Aleutian Basin: The 2021 assessment of the North Aleutian Basin OCS Planning Area identified six exploration plays, five of which were assessed for quantifiable oil and gas potential. The planning area is gas-prone, with 67 percent of the undiscovered hydrocarbon potential consisting of natural gas. St. George Basin: The 2021 assessment of the St. George Basin OCS Planning Area identified four exploration plays. The planning area is gas-prone with 70 percent of the undiscovered hydrocarbon potential consisting of natural gas. Norton Basin: The 2021 assessment of the Norton Basin OCS Planning Area identified four exploration plays which are assessed for their oil and gas potential. The planning area is gas- prone as 100 percent of the UTRR is expected to exist as natural gas and condensate. Cook Inlet: The 2021 assessment of the Cook Inlet OCS Planning Area identified four exploration plays. Most resources (83 percent) in the planning area are modeled to exist as liquid hydrocarbons (oil and condensate). One geologic play in the Cook Inlet was modeled as a gas play (with insignificant condensate). Gulf of Alaska: The 2021 assessment of the Gulf of Alaska OCS Planning Area identified five exploration plays. The planning area is gas-prone with 57 percent of the hydrocarbon resources modeled to exist as natural gas. Shumagin: The 2021 assessment identified one exploration play. The planning area is highly gas-prone (no free oil) with natural gas comprising 87 percent of the UTRR and the remainder present as condensate. Kodiak: The 2021 assessment identified one exploration play. The planning area is gas-prone with natural gas comprising 87 percent of the UTRR. 10 Resource Assessment Results
2021 Assessment of Oil and Gas Resources                                                                                        Alaska Outer Continental Shelf Region

                                                                 Undiscovered Technically Recoverable Resources (UTRR)
                 Alaska OCS Region
                                                            OIL (Bbbl)                           GAS (Tcf)                       Total BOE (BBOE)
                     Planning Area                              Mean                                Mean                                  Mean

             Chukchi Sea                                       15.718                              79.580                                29.878
             Beaufort Sea                                       5.743                              16.101                                 8.608
             Hope Basin                                         0.141                               3.514                                 0.766
             Navarin Basin                                      0.257                                2.14                                 0.637
             North Aleutian Basin                               0.787                               9.019                                 2.392
             St. George Basin                                   0.220                               2.809                                 0.720
             Norton Basin                                       0.062                               3.353                                 0.658
             Cook Inlet                                         1.041                               1.183                                 1.252
             Gulf of Alaska                                     0.664                               4.329                                 1.434
             Shumagin                                           0.011                               0.409                                 0.083
             Kodiak                                             0.042                               1.597                                 0.326
             Alaska OCS Total:                                 24.686                             124.034                                46.754
Notes:   Resource values are in billon barrels of oil (Bbbl), trillion cubic feet of gas (Tcf) and billion barrels of oil equivalent (BBOE) for barrel of oil equivalent.
         Mean values are additive; P95 and P5 values are not.

   Table 2:            Undiscovered, Technically Recoverable Oil and Gas Resources of the Alaska OCS Region by Planning Area (2021)

Resource Assessment Results                                                                                                                                                 11
2021 Assessment of Oil and Gas Resources Alaska Outer Continental Shelf Region
80
70
Oil (Bbbl)
60
Gas (Tcf)
50
Volume of Resource (Mean Values)
Total BOE (BBOE)
40
30
20
10
0
Chukchi Beaufort Hope Basin Navarin North St. George Norton Cook Inlet Gulf of Shumagin Kodiak
Sea Sea Basin Aleutian Basin Basin Alaska
Basin Planning Area
Figure 2: Undiscovered, Technically Recoverable Oil and Gas Resources of the Alaska OCS Region by Planning Area
12 Resource Assessment Results2021 Assessment of Oil and Gas Resources Alaska Outer Continental Shelf Region Undiscovered Economically Recoverable Resources (UERR) The fraction of UTRR that is estimated to comprise the volume of undiscovered, economically recoverable resource (UERR) varies based on several assumptions beyond those implicit in the calculation of geologic resources, including commodity price environment, cost environment, and relationship of gas price to oil price. In general, larger volumes of resources are estimated to be economically recoverable under more favorable economic conditions. For example, in this assessment, the Region’s UERR are estimated at January 1, 2019 market conditions. Using a price pair of $100 per bbl of oil and $5.34 per Mcf of natural gas, the total volume of UERR is estimated to be 5.62 Bbbl of oil and 5.68 Tcf of natural gas (mean values). Economic scenarios under constant cost environments with more favorable (higher prices) economic conditions yield higher UERR volumes while less favorable (lower prices) economic conditions yield lower UERR volumes. BOEM uses the GRASP (Geological Resource Assessment Program) program to calculate both the UTRR and the UERR volumes reported in the Assessment report. When the UTRR are subjected to a risked discounted cash flow (DCF) analysis using the GRASP economics module, the result is an estimate of UERR. Assessments of economically recoverable resources are strongly influenced by the engineering development scenarios, the cost estimates for operations, and transportation strategies to modeled market destinations. These factors are reviewed and updated for each assessment. The key differences of the 2021 assessment methodology, compared to the 2016 assessment for the Alaska OCS provinces, are discussed in further detail later in this document. Base costs are referenced to a $70/bbl oil price for the 2021 Assessment, which is the same as used in the 2016 Assessment. It is important to note that the modeling and simulations assume that current and foreseeable technologies will be used for offshore production operations. Regional Economic Assumptions 13
2021 Assessment of Oil and Gas Resources Alaska Outer Continental Shelf Region
Regional Economic Assumptions
Alaska is a large geographical area with a wide variance in the estimated cost of construction
based on remoteness, degree of availability of infrastructure support, and local environmental
engineering conditions. To simplify the estimating process in this analysis, the OCS planning
areas are grouped into four regional cost centers: North Slope (Beaufort Sea, Chukchi Sea, and
Hope Basin); Southcentral (Cook Inlet); Bering Sea (Norton Basin, Navarin Basin, St. George
Basin, and North Aleutian Basin); and North Pacific (Shumagin, Kodiak, and Gulf of Alaska).
For this analysis, two basic cost centers (North and South) were used from which to base the
construction and support necessary to support production and development. In the northern part
of Alaska, the Beaufort Sea was used as a known cost center since this area is adjacent to
existing oil production activities on the North Slope of Alaska. The Chukchi OCS Planning Area
is immediately west of the Beaufort Sea and it is expected that offshore development costs
related to platforms and well drilling should be similar to the Beaufort Sea. Across the northern
planning areas, it is expected that the offshore (subsea) pipeline construction costs should be
similar on a per mile basis. However, due to the frontier status of the Chukchi Sea, it is
anticipated that additional onshore and offshore pipelines will be required to support this
development.
In the southern part of Alaska, the Cook Inlet area is used as a known cost center due to its long
production history from both onshore and offshore state oil and gas developments.
Geographically, this area of Alaska is often referred to as Southcentral Alaska. There is
historical cost data available related to onshore and state offshore development in Cook Inlet
that can be used to estimate OCS development costs. Cost files for the Bering Sea are based
on the Cook Inlet planning area cost file with a 1.25 adjustment factor to account for the
remoteness of this location. Similarly, cost files for the North Pacific Planning Area were created
using the Cook Inlet cost file with an adjustment factor of 1.15.
Table 3 summarizes the four primary Alaska OCS cost centers used to estimate project costs
where the North Slope is one distinct regional cost center, and the remaining regions are based
on the Southcentral (Cook Inlet) using the associated cost multipliers indicated to help simplify
the estimation of OCS development costs for the most recent Assessment.
Cost Factor
Area IDs OCS Planning Areas
Multiplier
North
North Slope Regional Cost Factor 1.0 Beaufort Sea Chukchi Sea Hope Basin
South
Southcentral Regional Cost Factor 1.0 Cook Inlet
Bering Sea Regional Cost Factor
1.25 St. George Basin Navarin Basin North Aleutian Basin Norton Basin
(Southcentral x 1.25)
North Pacific Regional Cost Factor
1.15 Kodiak Gulf of Alaska Shumagin
(Southcentral x 1.15)
Table 3: Alaska OCS Planning Area Cost Adjustment Factors
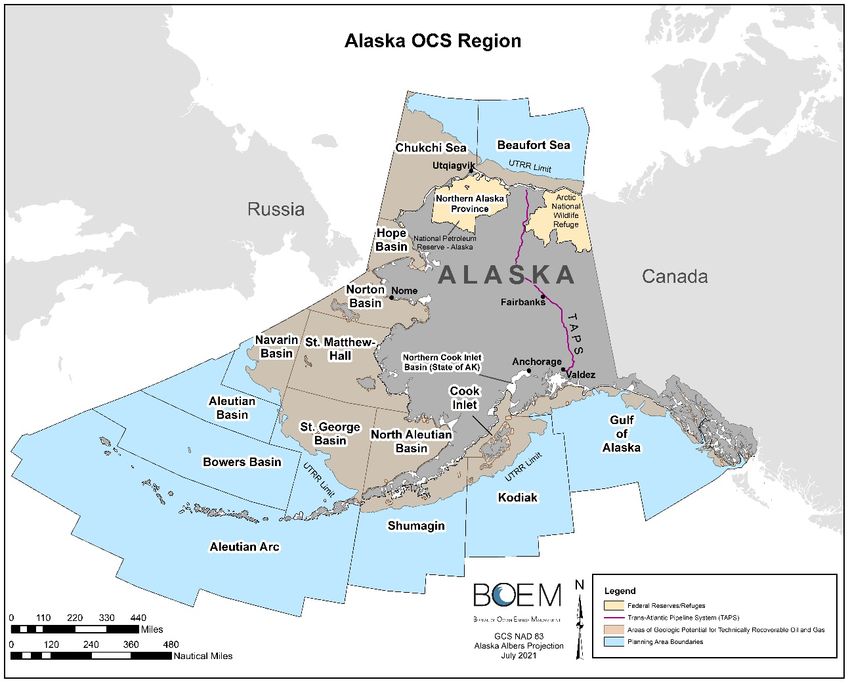
14 Regional Economic Assumptions2021 Assessment of Oil and Gas Resources Alaska Outer Continental Shelf Region UERR Model Parameter Changes Several changes to input model parameters and assumptions contribute to changes in UERR estimates when compared to the 2016 assessment. While the GRASP model itself did not change, empirical data analysis and a re-assessment of production cost inputs led to several notable changes in UERR volumes. In planning areas where the UTRR estimates changed significantly from 2016, the resulting change in UERR is due to a combination of changes to both the economic and engineering assumptions as well as the UTRR. Capital Cost Updates The 2021 UERR assessment includes updates to the economic costs used in the GRASP model. The GRASP costs include estimates of costs for the following production activities: operating costs, platform (fabrication), platform removal (decommissioning); single, dual and subsea well completion; exploration and delineation wells; production wells; subsea wells; pipeline gas; pipeline oil; production equipment gas; and production equipment oil. For the 2021 assessment most of the cost input data was obtained using Que$tor, a commercially available project cost estimating software developed for the offshore and onshore oil and gas industry. The costs obtained from the program were input into the cost file with a ±25 percent variance to account for actual regional differences from the information within the project databases used by the software. In general, increased costs would be expected to decrease the estimated UERR values of the OCS planning areas. Exploratory drilling costs for the GRASP model inputs are estimated by searching current exploratory drilling rig day-costs. Anticipated costs are extrapolated for a drilling season based on local Alaska environmental conditions. For the Arctic OCS regions, it is assumed that a mobile offshore drilling unit (MODU) will be contracted for a minimum period of nine months in order to be staged prior to the drilling season and returned to port after drilling is completed. If modifications to the drillship are necessary to meet Arctic conditions, then additional time may be required. Estimated day rates of drill ships are available from various trade publications. The average reported daily jack-up rig rates are estimated at $55k/day (IHS Markit rate4), while the reported rental rates for drillship are estimated at an average of two and a half (2.5) times the cost of a jack-up. Exploratory drilling also requires extensive support vessels since they do not operate solo during drilling operations. This support cost was estimated to equal the contracted daily rate of the drillship for an estimated contract duration of 180 days for Arctic planning areas and 120 days in sub-arctic planning areas, respectively. Both the drillship and support vessel costs are added to obtain an estimate of the exploratory well drilling cost. The total drilling cost is normalized to the predicted average reservoir depth and water depth of the planning area. Drilling costs are adjusted for drilling depths through linear extrapolation. Deeper water depths require a larger drillship resulting in increased rental rates. Table 3 shows a comparison of estimated exploratory drilling costs in the Beaufort OCS from the 2016 and 2021 assessments. The costs used for the 2021 assessment (as analyzed in 2019) are based on an expected increase in MODU rates based upon industry activity at that time. Regional Economic Assumptions 15
2021 Assessment of Oil and Gas Resources Alaska Outer Continental Shelf Region
$400.00
Estimated Exploration Well Cost $ 2021
Estimated Exploration Well Cost $ 2016
$350.00
$300.00
Exploration Well Cost, $ Million
$250.00
$200.00
$150.00
$100.00
$50.00
$0.00
1000
5000
10000
15000
20000
25000
30000
1000
5000
10000
15000
20000
25000
30000
1000
5000
10000
15000
20000
25000
30000
1000
5000
10000
15000
20000
25000
30000
1 100 300 600
Well Drilling Depth at Water Depth Tranches, FT
Figure 3: Beaufort Sea OCS Estimated Exploration Costs in Million $ versus Drilling Depths at Various Water Depth Tranches
16 Regional Economic Assumptions2021 Assessment of Oil and Gas Resources Alaska Outer Continental Shelf Region A comparison of the estimated production platform well drilling costs for the Beaufort Sea planning area is examined where costs from the 2016 assessment are compared to those used in the 2021 assessment (Figure 4). Production drilling costs for the 2021 assessment are derived using an oil and gas project estimating software (Que$tor). The project drilling cost reported by the software was divided by the number of wells identified in the development plan to obtain a per well cost. This well cost is then further divided by the average drilling depth of the planning area to obtain a drilling cost on a per foot basis which is then scaled for the corresponding tables in the GRASP input file. A review of the estimated costs shows a significant increase in costs for the current assessment for measured well depths greater than 25,000 feet. Most of the wells forecasted to be drilled in the Beaufort Sea Planning Area are expected to be less than 15,000 feet suggesting that this increase will have little effect on the UERR. Figure 4 is an example of the production well costs from a platform in the Beaufort OCS. Transportation Tariffs Transportation of oil and gas production to market is a key component of the assessment of economically recoverable resources. Typically, Alaska’s remote petroleum provinces lack infrastructure and nearby markets, so transportation incurs difficult cost and logistical hurdles. Markets in Alaska might absorb a fraction of future production, but large-scale production could easily overwhelm the relatively small local demand. Only Cook Inlet has existing facilities and a local market for oil and gas. In comparison, oil production from the North Slope is carried to outside markets by the Trans-Alaska Pipeline System (TAPS) and using tankers from Valdez. In all other provinces future oil and gas production will have to be exported thousands of miles using infrastructure that does not exist today. One of the costs examined in this assessment is the transportation strategy and resulting tariffs to deliver oil and/or gas to market. An analysis of the effect of the differences associated with the previous tariffs was examined for the Beaufort Sea Planning Area. At an oil/gas price ratio of 0.3 at $100STBl/$5.34mcf, the 2016 tariff rates produced an estimated 7.88 percent higher UERR value when compared with the results using the estimated 2021 assessment tariff rates, even with a revised federal tax production rate of 21 percent and a revised cash flow discount rate of 11 percent. For this oil/gas price pair, the estimated tariff for delivering produced gas from Beaufort Sea offshore leases exceeds the market price for gas resulting in a very significant decline to the estimated UERR for oil and gas. The sequence of discovery and development of plays in a planning area is based on the mean technically recoverable oil and gas volumes in the plays. Large pools in resource-rich plays are assumed to be discovered and developed first and support the initial infrastructure required in the planning area. The development of smaller pools in resource-poor plays will be delayed until the new infrastructure is in place. This anticipated sequence of future development is modeled with discovery scheduling, prorated capital costs, and cost-of-service fees for shared infrastructure. Regional Economic Assumptions 17
2021 Assessment of Oil and Gas Resources                                                                                                                          Alaska Outer Continental Shelf Region

                                                                 Beaufort Sea Estimated Production Platform Well Costs $MM
            90

            80                   Sum of ML Production Well Cost $ 2016

            70                   Sum of ML Production Well Cost $ 2021

            60
Cost, $MM

            50

            40

            30

            20

            10

            0
                 1000

                          5000

                                 10000

                                         15000

                                                 20000

                                                         25000

                                                                  30000

                                                                          1000

                                                                                 5000

                                                                                        10000

                                                                                                15000

                                                                                                        20000

                                                                                                                25000

                                                                                                                        30000

                                                                                                                                1000

                                                                                                                                       5000

                                                                                                                                              10000

                                                                                                                                                      15000

                                                                                                                                                              20000

                                                                                                                                                                      25000

                                                                                                                                                                              30000

                                                                                                                                                                                      1000

                                                                                                                                                                                             5000

                                                                                                                                                                                                    10000

                                                                                                                                                                                                            15000

                                                                                                                                                                                                                    20000

                                                                                                                                                                                                                            25000

                                                                                                                                                                                                                                    30000
                                          1                                                     100                                                   300                                                   600
                                                                                           Well Drilling Depth (ft), Water Depth Intervals (ft)

            Notes:      Based on water depth and well depth between the 2021 (blue) assessment and 2016 (red) assessment.

                                              Figure 4:          Comparison of Estimated Production Platform Well Drilling and Completion Costs

            18                                                                                                                                                                        Regional Economic Assumptions
2021 Assessment of Oil and Gas Resources Alaska Outer Continental Shelf Region
The 2021 assessment includes updated transportation assumptions for each planning area
based on engineering feasibility and market conditions. Typically, pipelines are the most cost-
effective means of transporting oil and gas; where pipelines are not feasible, oil and gas must
be transported by marine tankers. Some provinces involve a combination of pipeline and
tankers (for example, TAPS from northern Alaska). For the remote gas-prone Alaska OCS
provinces, the most likely development scenario is to convert natural gas to Liquefied Natural
Gas (LNG) for marine transport. Recovered liquids (oil and condensates) from these remote
areas are modeled based on floating production and storage operations (FPSO) as the most
cost-effective solution. Based on current gas pipeline development scenarios, BOEM assumes
that LNG will be shipped to receiving terminals in East Asia (South Korea and Japan).
Transportation costs are modeled using cost-of-service tariffs for the export systems. Tariffs are
bundled to include all charges associated with common-carrier pipelines, processing
(separation, LNG conversion), storage, loading, and shipping costs. Estimated tariffs for 11
Alaska OCS planning areas are shown in Figure 5.
Estimated Tariff Costs AKOCS
16 14.68
13.5
14
11.22 10.67 10.21 9.95 10.99
12 10.59 10
9.46 9.96
9.31
Cost ($USD)
10 8.57 8.7
7.53
8 6.85 6.53 6.53
6 4.78 4.78 4.78
4
1.39
2
0
Oil $/bbl
Planning Area Gas $/Mcf
Figure 5: Estimated Transportation Tariff Costs for Alaska OCS Planning Areas
Tangible Fractions
In addition to the transportation tariffs, other notable changes affecting the UERR estimate from
the previous assessment include revisions of the depreciable tangible fractional capital
investment costs. Based on the results observed from the GRASP simulation, the revised
tangibles fractions only contributed to a small fraction (approximately two percent) of the loss
observed in the estimated UERR when compared to the previous assessment results.
Regional Economic Assumptions 192021 Assessment of Oil and Gas Resources Alaska Outer Continental Shelf Region
Summary of UERR Assessment Results
Based on the development scenarios employed in each of the planning areas, a brief summary
of the UERR results from the current assessment is compared with the prior assessment. The
UERR comparison for each of the Alaska OCS planning areas is illustrated in Table 3 and
Figure 6 at an oil/gas price pair of $100/bbl oil and $5.34/Mcf gas which corresponds with an
oil/gas price ratio of 0.3 based upon an equivalent BTU content.
There are many variables contributing to the estimated UERR values reported in the 2021
Alaska OCS Assessment. Based upon this recent analysis, the overall UERR estimated for the
Alaska OCS have decreased from the last assessment due to both a decrease in the estimated
UTRR and changes in the estimated project capital costs (material, construction, and labor) that
had occurred between the time economic data was gathered for the 2016 National Assessment
and the 2021 National Assessment.
Oil Economic Resource Values (Bbbl), Gas Economic Resource Values (Tcf),
Region $100/bbl and $5.34/MCF $100/bbl and $5.34/MCF
2016 2021 2016 2021
Planning Area 95th Mean 5th 95th Mean 5th 95th Mean 5th 95th Mean 5th
Alaska OCS 12.47 17.29 23.62 4.01 5.62 7.59 22.98 33.59 47.90 3.68 5.68 8.26
Chukchi Sea 5.45 9.25 14.07 1.65 2.80 4.15 12.96 22.58 34.32 2.09 3.75 5.88
Beaufort Sea 3.11 6.08 10.31 0.72 1.67 3.02 4.00 8.09 14.06 0.60 1.42 2.55
Hope Basin 0.00 0.06 0.19 0.00 0.02 0.08 0.00 0.17 0.55 0.00 0.02 0.11
Navarin Basin 0.00 0.05 0.18 0.00 0.01 0.06 0.00 0.12 0.52 0.00 0.01 0.06
North Aleutian Basin 0.06 0.49 1.31 0.03 0.37 1.14 0.03 0.28 0.75 0.01 0.17 0.56
St. George Basin 0.00 0.10 0.33 0.00 0.02 0.06 0.00 0.15 0.39 0.00 0.01 0.04
Norton Basin 0.00 0.00 0.00 0.00 0.00 0.00 0.00 0.00 0.00 0.00 0.00 0.00
Cook Inlet 0.24 0.98 1.96 0.24 0.72 1.39 0.22 0.77 1.41 0.09 0.28 0.56
Gulf of Alaska 0.04 0.31 0.82 0.00 0.02 0.03 0.13 1.62 4.28 0.00 0.03 0.06
Shumagin 0.00 0.00 0.00 0.00 0.00 0.00 0.00 0.00 0.00 0.00 0.00 0.00
Kodiak 0.00 0.00 0.00 0.00 0.00 0.00 0.00 0.02 0.05 0.00 0.00 0.00
Notes: From the 2016 and 2021 National Assessments at $100/STB and $5.34/Mcf.
Table 4: Comparison of 2016 and 2021 Alaska OCS Planning Areas Estimated UERR (Oil and Gas)
20 Summary of UERR Assessment Results2021 Assessment of Oil and Gas Resources Alaska Outer Continental Shelf Region
Comparison of 2021 vs. 2016 UERR
at oil $100/bbl and gas $5.34/Mcf
25
Oil 2016 (MM bbl)
20 Oil 2021 (MM bbl)
Gas 2016 (Tcf)
15
Gas 2021 (Tcf)
Volume
10
5
0
Beaufort Chukchi Cook Inlet Gulf of Hope Kodiak Navarin North Norton Shumagin St. George
Sea Sea Alaska Aleutian Basin Basin
Basin
Planning Area
Figure 6: Comparison of UERR results by planning area from the 2016 and 2021 National Assessment.
Regional Economic Assumptions 212021 Assessment of Oil and Gas Resources Alaska Outer Continental Shelf Region
References
1. Bureau of Ocean Energy Management (2016). Assessment of Undiscovered Technically
Recoverable Oil and Gas Resources of the Nation’s Outer Continental Shelf (RED-2016-01b).
https://www.boem.gov/2016-National-Assessment-Fact-Sheet/
2. U.S.-Russia Convention Line of 1867. (1965). United States: Department of State, The
Geographer, Office of the Geographer, Bureau of Intelligence and Research.
3. Sherwood, Kirk W., et al. (18 additional authors) 1998, MMS (Minerals Management
Service, U.S. Department of the Interior), Undiscovered Oil and Gas Resources, Alaska
Federal Offshore, January 1995, (OCS Report MMS 98-0054).
https://www.boem.gov/About-BOEM/BOEM-Regions/Alaska-Region/Resource-Evaluation/ta98-
0054.aspx
4. IHS Markit “Petrodata Offshore Rig Day Rate Trends”: https://ihsmarkit.com/products/oil-
gas-drilling-rigs-offshore-day-rates.html,
5. Offshore Energy Today – “Shelf Drilling: Jack-up utilization rising, day rates historically
low.”: https://www.offshoreenergytoday.com/shelf-drilling-jack-up-utilization-rising-
dayrates-historically-low/
6. Que$tor Oil-Gas Project Cost Estimation Software:
https://ihsmarkit.com/products/questor-oil-gas-project-cost-estimation-software.html
22 GlossaryGlossary
Barrel: A volumetric unit of measure for crude oil equivalent to 42 U.S. gallons.
Basin (geologic basin): A basin is a depressed and geographically confined area of the earth’s
crust in which sediments accumulated and hydrocarbons may have formed.
Field: A field means an area consisting of a single reservoir or multiple reservoirs all on, or
related to, the same general geological structural feature or stratigraphic trapping condition. Two
or more reservoirs may be in a field, separated vertically by intervening impervious strata or
laterally by local geologic barriers, or both.
Outer Continental Shelf: The continental margin, including the shelf, slope, and rise, beyond
the line that marks the boundary of state ownership; that part of the seabed under Federal
jurisdiction.
Play: A group of known and/or postulated pools that share common geologic, geographic, and
temporal properties, such as hydrocarbon generation, migration, reservoir development, and
timing of entrapment.
Conceptual plays: Those plays in which hydrocarbons have not been detected but for which
data suggest that hydrocarbon accumulations may exist.
Established plays: Those play in which hydrocarbon accumulations have been discovered.
Production: Production is the cumulative quantity of petroleum that has been recovered over a
defined time period.
Pool: A pool is a discrete accumulation (discovered or undiscovered) of hydrocarbon resources
that are hydraulically separated from any other hydrocarbon accumulation; it is typically related
to a single stratigraphic interval or structural feature.
Planning Area: OCS planning areas are not based on geology or geography but are delineated
based on political boundaries in the same fashions as state or county lines.
Prospect: A prospect is an untested geologic feature having the potential for trapping and
accumulating hydrocarbons.
STB: Stock Tank Barrel refers to a measure of stabilized oil at surface conditions, i.e., standard
pressure and temperature.
Total resource endowment: This is the sum of the discovered resources (original recoverable
reserves) and undiscovered resources.
Undiscovered Resources: These are resources that have not been discovered but are
estimated to exist outside and between known accumulations based on broad geologic
knowledge and theory. Undiscovered resources may be categorized into:
• Technically Recoverable Undiscovered Resources are resources that can be removed from
the subsurface with conventional extraction techniques (that is, technology whose usage is
considered common practice as of this assessment).
Glossary 232021 Assessment of Oil and Gas Resources Alaska Outer Continental Shelf Region
• Economically Recoverable Undiscovered Resources are technically recoverable resources
that can be extracted profitably by conventional techniques under specified economic
conditions.
Authors
Kelly Jemison
Michael Lu
Contributing Personnel
Michael Bradway
Jason Burt
Kelsey Crocker
William Czyzewski
Jennafer Foreman
Timothy Harper
William Hokanson
Caleb Jennings
Daniel Lasco
Linda Liu
Michael Lu
Molly McCreary
Louis Niglio
Justin Miller
Ikechuku Odi
Vilma Perez de Pottella
Catherine Roso
Kirk Sherwood
Kristen Sommers
Lean Stillens Vinzant
Michael Unger
Martin Wensrich
Loren Zeigler
24 GlossaryThe Department of the Interior Mission As the Nation's principal conservation agency, the Department of the Interior has responsibility for most of our nationally owned public lands and natural resources. This includes fostering sound use of our land and water resources; protecting our fish, wildlife and biological diversity; preserving the environmental and cultural values of our national parks and historical places; and providing for the enjoyment of life through outdoor recreation. The Department assesses our energy and mineral resources and works to ensure that their development is in the best interests of all our people by encouraging stewardship and citizen participation in their care. The Department also has a major responsibility for American Indian reservation communities and for people who live in island communities. The Bureau of Ocean Energy Management The Bureau of Ocean Energy Management (BOEM) works to manage the exploration and development of the nation's offshore resources in a way that appropriately balances economic development, energy independence, and environmental protection through oil and gas leases, renewable energy development and environmental reviews and studies.
You can also read