2021 CONFERENCE CALL - DIC Asset AG

Page created by Derrick Gonzalez
 
CONTINUE READING
2021 CONFERENCE CALL - DIC Asset AG
H1
HALF-YEAR RESULTS
                        2021
11 August 2021 CONFERENCE CALL
2021 CONFERENCE CALL - DIC Asset AG
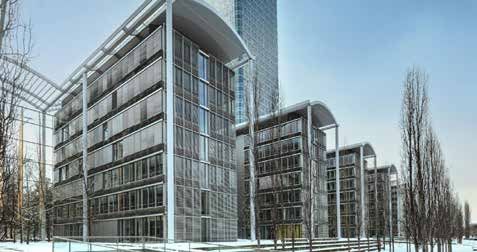
Successful H1 2021: 360° value creation accelerates our
          growth and profit
MATCH     Investor closing for third logistics property fund                       Mid-Term                        TRANSACT   Successful placement of first ESG-linked promis-
          with target volume of EUR 400 million success-                           AuM Target                                 sory note for EUR 250 million ensures early refi-
          fully completed after only four months                                   EUR 15.0 billion                           nancing of liabilities in 2022; used temporarily for
          Successful warehousing generates additional                                                                         high-yield warehousing activities
          rental cash flows: acquisition of largest office                                                                    Logistics expertise enhanced: integration of
          property “Uptown Tower” in Munich for marke-                                                                        RLI Investors completed
          ting to international and national investors                                                                        Transaction volume around EUR 900 million:
                                                                                              TR
                                                                                                   A
                                                                     CH
          Additional equity commitments of more than                                                                          half way to achieving annual target
          EUR 700 million available for investments                                                                           Acquisitions in Cologne and Munich for approx.

                                                                                                   N
                                                                AT

                                                                                                       SA
                                                                                                                              EUR 138 million strengthen balance sheet port­

                                                               M

                                                                                                         CT
                                                                                                                              folio with rental income of EUR 7.1 million p.a.

                                                                                360°
                                                                                VALUE
                                                                               CREATION

                                                                                                                   OPERATE    Assets under Management increase by 33% to
                                                                  OP

                                                                                                       OP
                                                                                                                              EUR 11.3 billion
                                                                 L

                                                                                                       E
                                                                                              RA
                                                               E

DEVELOP   ESG portfolio screening: focus on carbon reducti-          V                          TE                            Balance sheet portfolio optimised further:
          on and development of further development                      DE                                                   EPRA vacancy rate drops by 140 basis points to
          potential in the balance sheet portfolio                                                                            6.1%, WALT remains stable at 5.9 years
          Manage to Core: currently nine properties under                                                                     Real estate management fees increase by 20% to
          repositioning, refurbishment or development, four                                                                   EUR 50.5 million
          of which are in the balance sheet portfolio
                                                                                                                              FFO reaches half-year high of EUR 53.0 million
                                                                                                                              Profit for the period increases by 32% to EUR 37.7
                                                                                                                              million

                                                                              ESG-Strategy „Know       how and know why“
                                                                              Comprehensive ESG roadmap published

                                    Half-year results 2021 | Conference Call                                                                                                   2
2021 CONFERENCE CALL - DIC Asset AG
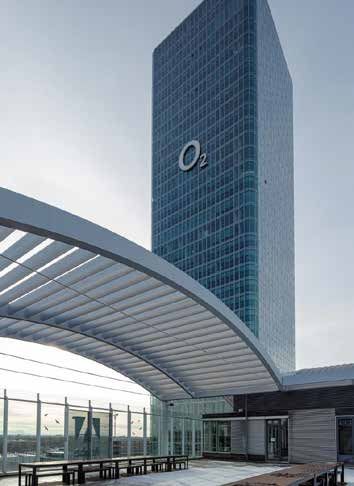
Mid-year targets achieved: high transaction volume and strong
AuM growth
Transaction volume                                                           Assets under management                                               n Transaction volume rose 81% year-on-year to EUR 897
in EUR million, notarised since 1.1.2021                                     in EUR billion                                                          million (all figures are total investment costs)
    Acquisitions                                                                                                                                     – Balance Sheet Portfolio: Access at two properties for
    Sales
                            897                                                      + 33%                                                             around EUR 138 million (Campus C in Munich and
                                                                                                    11.3                                               MBC Cologne)
      + 81%                          586
                                     Warehousing                                       8.5                                                           – Warehousing: Purchase of two properties for around
            495                                                                                              8.6   Institutional
                                                                                                                                                       EUR 586 million (logistic property "ILP" nearby Erfurt
                                                                                                                   Business
                                                     Commercial
                                                     Portfolio                6.6                                                                      and office property "Uptown Tower" in Munich), to
      249                            138                                                                                                               be transferred to the Institutional Business
                                     Balance Sheet
                                     Portfolio
                                                                                                             0.6   Warehousing
                                                                                                                                      Commercial     – Sale of two properties from the Institutional Business
     246                                                                                                     2.1   Balance Sheet
                                     173                                       1.9                                 Portfolio
                                                                                                                                      Portfolio        for around EUR 173 million in Frankfurt am Main
          H1 2020        H1 2021                                                     30.06.         30.06.                                             ("Villa Kennedy" and "Riverpark" project develop-
                                                                                     2020           2021                                               ment)
Portfolio by segment
                                                                                                                                                   n 		As a result of transactions and valuation gains, Assets
 30.06.2021                                                Commercial Portfolio                         Institutional                 Total           under management increased 33% year-on-year to
                                                      Balance Sheet            Ware-                       Business
                                                           Portfolio         housing                                                                  EUR 11.3 billion
 Number of properties                                                93                         3                  138                234          n DIC's real estate platform comprises a total of 234
 Market value in EUR million*                               2,110.1                     620.2                8,576.4          11,306.7               properties with a rental space of around 3.1 million sqm
 Rental space in sqm                                       826,100                    81,900           2,204,200             3,112,200             n The Balance Sheet Portfolio (Commercial Portfolio excl.
                                                                                                                                                     Warehousing) as at 30 June 2021 contains 93 proper-
 30.06.2020                                                Commercial Portfolio                         Institutional                 Total          ties with a market value of approx. EUR 2.1 billion
                                                      Balance Sheet            Ware-                       Business
                                                           Portfolio         housing
                                                                                                                                                   n Warehousing contains 3 assets for further placement
 Number of properties                                                93                         0                   94                187            (approx. EUR 620 million)
 Market value in EUR million*                               1,902.9                             0            6,598.2               8,501.1
                                                                                                                                                   n Assets under management in the Institutional Business
 Rental space in sqm                                       837,200                              0      1,358,400             2,195,600               increased to around EUR 8.6 billion as at 30 June 2021,
*	Market value as at 31.12. of the previous year, later acquisition generally considered at cost                                                    e.g. due to the acquisition of RLI

                                       Half-year results 2021 | Conference Call                                                                                                                                  3
2021 CONFERENCE CALL - DIC Asset AG
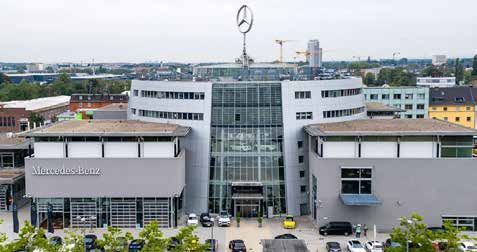
OPERATE: Increased rental income on like-for-like basis in both
segments
Letting volume                                                 Average rents                                               n Letting performance in the first six
in sqm                                                         in EUR/sqm                                                    month amounted to 100,100 sqm
  New lettings                                                                                                               (H1 2020: 125,800 sqm), with several
                          125,800                                          10.36                  11.21            11.98     new high-volume lettings dominating the
  Renewals

                  30,400                                                                                   incl.             activities (58%, 57,700 sqm). This was in
                      (24%)
                                       100,100                 Commercial                                 ware­              sharp contrast to last year, when most
                                                               Portfolio                                 housing
                                                                                                                             signings were renewals
                                                    57,700
                                                       (58%)               15.04                  15.68                    n Average rents in Commercial Portfolio
                                                                                                                   11.90     (incl. Warehousing) increases to
                                                               Institutional                               incl.             EUR 11.98 per sqm. In the Institutional
                  95,400
                      (76%)                       42,400       Business                                     RLI              Business, they increased to EUR 15.68
                                                       (42%)                                                                 per sqm (excl. RLI, lower average rents
                                                                                                                             for logistics properties)
                             H1 2020      H1 2021                         H1 2020                        H1 2021
                                                                                                                           n Like-for-like rental income generated
                                                                                                                             across the platform increased by +0.2%,
Like-for-like rental income                                    Lease maturity total portfolio                                with both the Commercial Portfolio
annualised, in EUR million                                     in % of annualised rental income                              (+0.5% l-f-l) and the Institutional Busi-
                             +0.2%                                                                                           ness (+0.1% l-f-l) contributing to the in-
               317.3                      318.0                                                                              crease
                              Total                                                                        74.9
                                                                                                                           n The 2021 lease expiry volume fell to just
                             +0.1%                                                                                           2.8 % as a result of the letting activities.
         231.8                                   232.1                                                                       More than 74% of leases expire in 2025
                          Institutional
                            Business                                                                                         or later
                             +0.5%
                                                                                         10.4     7.6
          85.5            Commercial             85.9
                                                                         2.8     4.3
                           Portfolio

             30.06.2020                   30.06.2021                    2021    2022      2023    2024      2025
                                                                                                           et seq.

                              Half-year results 2021 | Conference Call                                                                                                 4
2021 CONFERENCE CALL - DIC Asset AG
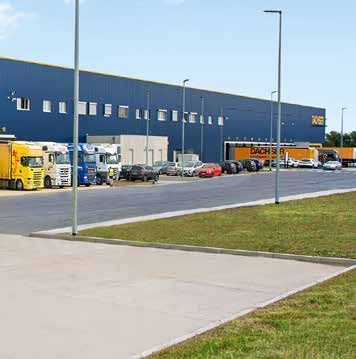
OPERATE: Optimised Balance Sheet Portfolio with low vacancy

Commercial Portfolio – Asset classes                                                                                                                         n Office properties are the largest asset
                                Asset class        No of.                    market value                rental income p.a.                  EPRA
                                                                                                                                                               class at 68% of market value
                                               properties   in EUR million           in %        in EUR million       in %             vacancy rate   WALT
                                                                                                                                                             n The most significant transactions 2021
                                 Office              55        1,426.9            68 %                   67.9          66 %                 6.5 %     6.0      were the acquisitions of the "MBC" in
                                                                                                                                                               Cologne (Mixed-Use) and of "Campus C"
                           Mixed-use                 15          341.0            16 %                   18.4          18 %                 6.3 %     5.2
                                                                                                                                                               in Munich (Office)
                                  Retail             11          285.9            14 %                   12.9          13 %                 4.2 %     6.7    n The EPRA vacancy rate decreased 140
                              Logistics                8           47.9             2%                     2.8            3%                2.9 %     5.0
                                                                                                                                                               basis points year-on-year to 6.1%
                                                                                                                                                               (30 June 2020: 7.5%) due to our letting
                                 Other                 4             8.4            0%                     0.4            0%               16.2 %     2.8      activities and acquisitions of properties
                                                                                                                                                               with low vacancy rates
         Balance Sheet Portfolio                     93        2,110.1          100 %                  102.4         100 %                  6.1 %     5.9
                                                                                                                                                             n Currently, we manage three properties
                    in Warehousing                     3         620.2                                   19.2                               0.0 %     9.9      with a market value of EUR 0.6 billion in
        Total (incl. Warehousing)                    96        2,730.3                                 121.6                                5.1 %     6.5      warehousing for new property funds,
                                                                                                                                                               thereby generating attractive rental cash
EPRA vacancy rate                                                                     Like-for-like rental income                                              flows
in %*                                                                                 in EUR million*
                              - 140 bp                                                                               + 0.5%

                           7.5                                                                                   85.5 85.9
                                        6.1

                           30.06.      30.06.                                                                    30.06.       30.06.
                           2020        2021                                                                      2020         2021
* without warehousing and repositioning properties                                    * without warehousing and repositioning properties

                                    Half-year results 2021 | Conference Call                                                                                                                               5
TRANSACT: Strengthening our balance sheet portfolio with
attractive rental cash flows
                                                                                           n "MBC" in Cologne West
                                                                                             – Hybrid building with state-of-the-art
                                                                                               exhibition space, office, conference
                                                                                               and catering space as well as work-
 Cologne | "MBC"                                                                               shops
Purchase Price (TIC):        c. EUR 71 million                                               – Location with high potential for fur-
Rental space (sqm):            approx. 34,600                                                  ther development
Parking spaces:                   around 400                                                 – Gross rental yield >7%
WALT/Option:            4.7 years / 2 x 5 years
                                                                   GROWTH                  n 		"Campus C" in Munich
Year of construction:                    2006                      ON TRACK
                                                                                             – Fully let multi-tenant office
                                                                   Properties for c. EUR     – Annual rental income of
                                                                   138 million acquired        EUR 2.4 million
 Munich | "Campus C"                                               for our balance sheet
                                                                   portfolio                 – Attractive cash-flow generating acqui-
Purchase Price (TIC):        c. EUR 66 million                                                 sition with additional value and rental
Rental space (sqm):             approx. 9,200                                                  growth potential in the future
WALT:                                3.1 years
Year of construction:                    2004

                        Half-year results 2021 | Conference Call                                                                       6
TRANSACT/MATCH: Warehousing of highly attractive
properties - growth of Institutional Business
Erfurt                                                                          Munich
"ILP"                                                                           "Uptown Tower"

                    DGNB Gold received                 WAREHOUSING
                                                                                    n Largest single transaction
  n Purchase for new logistics                         High-class real estate         in the company's history
    fund in January 2021                               secured for over
                                                       half a billion euros         n Purchase for warehousing
  n Warehousing for 6 months                                                          in June 2021

  n Transfer to fund "RLI-GEG                                                       n Additional rental cash flow
    Logistics & Light Industrial                                                      since end of June 2021
    III" in Q3 2021 completed
                                                                                    n Marketing launched with
                                                                                      international and national-
                                                                                      investors

                                                                                    n Transfer to new investors
                                                                                      vehicle expected in H2
                                                                                      2021

                   Half-year results 2021 | Conference Call                                                         7
MATCH: New logistics property fund closed - high level of
equity investments to drive further AuM growth
Assets under Management                                                                n Assets under management in the Institutional Business rose
in EUR billion                                                                           33% to EUR 8.6 billion (30.06.2020: EUR 6.6 billion )
                                                                8.6
                                                       7.6                             n Real estate management fees with substantial increase of
                                 CAGR                                                    20% to more than EUR 50 million in H1 2021
                                 c. 41%
                                                5.7                                    n Third logistics property fund fully placed, fundraising of EUR
                                                                                         210 million completed after four months – future market with
                                    3.9                                                  attractive yield upside
                         2.8
                 1.9                                                                   n 		Further investments secured: current equity commitments in
                                                                                           the Institutional Business of more than EUR 700 million allow
                                                                                           further acquistions in the amount of up to c. EUR 1.3 billion
                 2016    2017       2018        2019   2020   30.06.2021

Types of use Institutional Business
Basis: assets under management in EUR million

                                                                               8%
                                                                           Logistics

                                        AuM
86%                                 EUR 8.6 billion
Office/infrastructure
                                                                               5%
                                                                              Retail

                                                                               1%
                                                                             Other

                           Half-year results 2021 | Conference Call                                                                                       8
Mid-term Target: Assets under Management of 15+ billion

          Our market expectations and ...                  action plan – built on our
                                                           long-term track record
                                                                                                                              0.66 0.70
n Germany continues to be the most at-        n 		Growth targeted in both business                   DIVIDEND         0.48
  tractive and sustainable real estate mar-       ­segments                                          in EUR/share

  ket in Europe, but promising opportuni-     n Expand product offer inside & outside                                                          106-110
  ties outside Germany                          of Germany                                                                              97
                                                                                                                                                 (exp)
                                                                                                                               95
n "Run for Core": unrestrained investor de-   n DIC's competitive advantage: highest
  mand for German Top-7 locations               level of vertical integration of real estate                          68
                                                                                                     FFO
n Especially post-covid, attractive oppor-      services and strong access to the market                                                                        >15
                                                                                                     in EUR million
  tunities will arise in the value-add seg-     vs. peers
  ment                                                                                                                       CAGR
                                              n Deliver on our ESG Roadmap                                                   c. 31%
n Entrepreneurial action and high deal        n Institutional Business
                                                                                                                                        9.6
  speed is necessary to tap opportunities                                                                                      7.6
                                                 – Significant expansion of international
  along different risk profiles                    investor base
                                                                                                     AUM
                                                                                                                      5.6
                                                                                                     in EUR billion
n Active management approach is key to           – Targeting higher share of recurring manage-
  succeed                                          ment fees along with AuM growth

n ESG becomes more and more important         n Commercial Portfolio
                                                 – Use potential from selective repositionings/re-                    2018    2019      2020     2021    2022    2023
                                                   furbishments of own stock                                            Institutional Business      Commercial Portfolio
                                                 – Further strengthening of portfolio quality
                                                   by acquisitions/disposals

                                              n Using our warehousing capacity to gen-                   è Further increase of the value of both
                                                erate significant setup fees and additional                the Institutional Business and the
                                                cash flow from rents                                       Commercial Portfolio

                    Half-year results 2021 | Conference Call                                                                                                          9
Our ESG strategy – know how and know why

                                                                               We manage our business proactively in line
                                                                               with sustainability aspects

                                                                         GOVERNANCE:
                                                                         We are a reliable partner, and conduct our business
                                                                         ­activities in a transparent and accountable manner

                                                                 SOCIAL:
                                                                 We shape our business with and for the people

                                                           ENVIRONMENT:
                                                           We positively mitigate climate change

                                      360°
                                   SUSTAINABLE
                                     BUSINESS
                                                                                 The ESG approach has become an essential and
                                                                                 integral component of our corporate strategy, of
                                                                                 our management approach and of our business
                                                                                 activities.

                                                                                 Combining it with our digital and IT strategy
     DIGITISATION:                                                               creates a powerful foundation.
 We use digitisation
   for ESG purposes
      as yet another
 building block (3+1)

                Half-year results 2021 | Conference Call                                                                            10
ESG: sustainability report 2020 published

                                                            DIC Asset AG stands for responsibility and values:

                                                            We are on track:                            ESG Roadmap:
             Our                                            ESG Milestones                              Focus on our sustainable future
             ESG JOURNEY                                    in H1 2021

                                                            n ESG strategy presented in             E     – Further investment in energy-efficient and
                                                              sustainability report 2020                    sustainable real estate
                                                                                                          – ESG portfolio screening with prioritised ESG
                                                            n Newly created position                        criteria
                                                              Head of Sustainability and start of         – Carbon Due Diligence of selected assets to
                                                              ESG committee                                 identify further measures to reduce CO2 emis-
                                                                                                            sions
                                                            n Definition of a 20% green building
                                                              quota by the end 2023 for the ex-     S     – Increase attractiveness as employer and focus
                                                              isting property portfolio                     on occupational health and safety
                                                                                                          – Charitable/societal involvement and further
                                                            n Placement of ESG-linked                       engagement in the future
                                                              promissory note with a volume
         ESG – foundation of our 360° value creation
                                                              of EUR 250 million                    G     – Broadening our guidelines & reporting
         for over 10 years
                                                                                                          – Guidelines and risk management including
2009: First-time communi-
                                                                                                            ESG aspects
cation about sustainable                                    n Launch of new ESG website for
business activities                                           regular updates
                                                                                                    D     – Digitalisation of raw data for our control and
                                                                                                            reporting processes
                                                                                                          – Initiating and offering sustainable and digital
                                                                                                             concepts

                            Half-year results 2021 | Conference Call                                                                                   11
Transact – Operate – Develop – Match:
360° value creation leads to higher profit for the period

                                                                                                                                         + 32%       37.7
                            Sales profits                                                                         Significantly higher
                                                                                                                 profit for the period     28.5
                                    16.3
                                                    Profit of associates and
                                                    sales profits
Profit of associates

  6,3
            3.8                                                                           TR A
                            2.5                                                 CH               N

                                                                           T

                                                                                                 SA
                                                   in EUR million                                                     in EUR million

                                                                         MA
                                                                                     360°

                                                                                                   CT
H1 2020 H1 2021           H1 2020 H1 2021                                                                                                H1 2020   H1 2021

                                                                                     VALUE

                                                                                                     O PE
                                                                                    CREATION
                                                                                P
                                                                             LO
Transaction and

                                                                                                     R
Performance Fees
                                                                                            AT
                                                                                VE             E
Asset-, Propertymanagement                                                           DE
and Development Fees                50.5
                          42.1
                                                    Rising real estate                                                                    41.0     40.2
                                                    management fees in                                Net rental income from the
                                                    Institutional Business                                   Commercial Portfolio
                                            31.7                                                     as a stable basis, temporarily
                   24.0
                                                                                                              below previous year

                   18.1                     18.8
                                                   in EUR million                                                    in EUR million

                       H1 2020     H1 2021                                                                                               H1 2020   H1 2021

                          Half-year results 2021 | Conference Call                                                                                           12
Adjusted NAV rises to EUR 21.91 per share

Reconciliation of net asset value to adjusted net asset value                                                                                                                n NAV rose by 1.2% to EUR 1,427.2 million
                                                                                                                                                                               or EUR 17.43 per share compared to the
                                                                                                                                                                               year-end 2020, mainly due to the posi-
                                                                                                                                                                               tive profit for the period in the first half
                                                                                                                             +6.88
                                                                                                                                                                               year of 2021.
                                                                                                                                                                21.91
                                                                                                                                                                             n Adjusted NAV slightly increased to EUR
                                                                                                                                                 -2.40                         1,793.7 million or EUR 21.91 per share as
                                                                                           +3.89           17.43                                                               of 30 June 2021
                                                                                                                                                                             n Number of shares increased by c. 1.3
   13.75             +0.47
                                                                        13.54                                                                                                  million following the scrip dividend
                                       -0.46            -0.22

   Equity           Profit for          Cash          Other ef-          Equity           Fair value         NAV            Fair Value less goodwill             Adjusted
 31.12.2020        the period         dividend        fects (incl.     30.06.2021        adjustment       30.06.2021       Institutional   / other                 NAV
                    H1 2021                             dilution                                                             Business    intangible             30.06.2021
                                                      from scrip                                                                                 assets /
                                                      dividend)*                                                                               other assets
                                                                                                                                                & liabilities

* Other effects: cashflow hedges and losses on financial instruments classified as measured at fair value through other comprehensive income

                                     Half-year results 2021 | Conference Call                                                                                                                                          13
Strong Financial Structure with ESG profile

Loan-to-value*/Adjusted LTV**                                                                     Average interest rate                                            n ESG-linked promissory note for refinanc-
in %                                                                                              in % of total financial debt                                       ing 2022 maturities and temporarily fi-
      57.0                                                                                                                                                           nancing warehousing activities
                      53.1
                                         47.8                                48.1                                       2.1                                        n The average maturity of loans and bor-
                                                            44.5                                                                    1.9
                                                                                                                                                                     rowings increased to 4.2 years due to
                    Adjusted LTV                                                                                                                                     the newly issued ESG-linked promissory
                                         41.8                                43.2                                                                                    note (31 December 2020: 3.6 years)
                                                            39.2
                                                                                                                                                                   n The average interest rate of loans and
      2017             2018              2019               2020          30.06.2021                                30.06.2020 30.06.2021                            borrowings at the reporting date de-
* The ratio of total financial debt, corporate bonds and liabilities to related parties minus
  cash in banks on the one hand and the fair value of investment property, equity invest-
                                                                                                                                                                     creased to 1.9%
  ments and receivables from related parties and intangible assets, e.g. goodwill on the
  other hand, adjusted for warehousing.                                                                                                                            n The interest cover ratio (ICR, the ratio of
** including fair value of Institutional Business                                                                                                                    EBITDA to net interest result) rose to
                                                                                                                                                                     572% in H1 2021
Maturities of loans and borrowings (H1 2021)*
700EUR million
                                                                                                                                                                   n The LTV (adjusted for warehousing) in-
in
                                                                                                                                                                     creased by 360 bp to 48.1 % (31 De-
600                                                                                                                                                                  cember 2020: 44.5 %), mainly due to the
                                                                                                                                                                     most recent acquisitions for the Com-
                                                                                                                                   Promissory note with ESG link
500
                                                                                                                                   Promissory note                   mercial Portfolio and the (cash) dividend
                                                                                                                                   Corporate bonds                   payment in April 2021
400                                                                                                                                Liabilities to banks
                                                                                                                                                                   n Only a minor amount of maturities re-
300                                                                                                                                                                  mains up for refinancing in 2021,
                                                                                                                                                                     EUR 340 million are up for refinancing in
200
                                                                                                                                                                     2022
100                                                                                                                                                                n Cash and cash equivalents decreased to
                                                                                                                                                                     c. EUR 214 million, mainly due to invest-
  0
          2021            2022             2023            2024            2025             2026         2027        2028        2029      2030       2031           ment activities in H1 2021
* nominal values as of 30 June 2021

                                        Half-year results 2021 | Conference Call                                                                                                                            14
FFO up 5% year-on-year – higher disposal gains boost FFO II

FFO Bridge H1 2020 / H1 2021
                                                                                                                                 Π  Net rental income slightly decreased by
in EUR million                                                                                                                       EUR 0.8 million, especially as a result of
                                                                                                                                     lower gross rental income compared to
                                                                                                                                     the previous year due to sales and
                                                                                                                                    transfer of warehoused assets
                                                                                                              16.3     69.3
                                     Œ  Ž                                                                                        The increase in real estate management
                                                                                                                                     fees reflects the successful growth of
                                                8.4
     53.1
                                                                                          2.3     53.0
                                                                                                                                     our management platform in the Insti-
                                                                                                                                     tutional Business
                            50.6                           -2.5
                   -2.5               -0.8                            -4.6     -0.4                                              Ž   Share of the profit of associates de-
                                                                                                                                     creased due to lower transaction-
                                                                                                                                     related profits

                                                                                                                                    Operating expenses rose due to the
                                                                                                                                     growth of the real estate platform and
                                                                                                                                     the acquisition of RLI Investors

                                                                                                                                    Other operating income/expenses
                                                                                                                                     mainly increased y-o-y due to the re-
                                                                                                                                     lease of provisions in Q1 2021
     FFO II       Sales     FFO        Δ         Δ           Δ         Δ         Δ          Δ        FFO      Sales     FFO II
    H1 2020       profit   H1 2020     Net       Real     Share of    OPEX    Net inte-    Other   H1 2021    profit   H1 2021
                 H1 2020              rental
                                     income
                                                Estate
                                               Manage-
                                                         the profit
                                                             of
                                                                             rest result                     H1 2021                The increase in sales volume led to an
                                                ment      associa-
                                                                                                                                     31% increase in FFO II
                                                 fees       tes

                             Half-year results 2021 | Conference Call                                                                                                        15
Half-year 2021 - targets achieved, guidance confirmed
                                                    Gross Rental Income
                                                    98–102 EUR million
        Mid-Term
       AuM Target
                                                                 Real Estate Management Fees
        ~15.0                                                    94–104 EUR million
        EUR billion

                                                                          FFO
                                                                          106–110 EUR million

       30 June 2021                                                       Acquisitions
           AuM                                                            1.2–1.8 EUR billion
          11.3                                                            thereof
        EUR billion                                                       200–300 EUR million for the Commercial Portfolio
                                                                          1.0–1.5 EUR billion for the Institutional Business

                                                              Sales
                                                              approx.   300–400 EUR million
                                                              thereof
                                                              approx. 100 EUR million from the Commercial Portfolio
                                                              200–300 EUR million from the Institutional Business

         Half-year results 2021 | Conference Call                                                                              16
Investor Relations – Contact

                                                                                                               For more information:
                                                                                                               www.dic-asset.de/en/ir/
                                                                                                               For instance
                                                                                                               >> Up-to-date company presentation
                                                                                                               >> Audio webcast

                                                                                                               IR Calendar 2021
   Peer Schlinkmann                                            Maximilian Breuer, CFA                          02.09.2021       Commerzbank Corporate Conference 2021
                                                                                                               08.09.2021       SRC Forum Financials + Real Estate 2021
   Head of Investor Relations and                               Investor Relations Manager                     20.09.2021       Berenberg GS German Corporate Conference 2021
   Corporate Communications                                                                                    21.09.2021       Baader Investment Conference 2021
                                                                                                               11.11.2021       Publication Q3 2021 Financial Statement
   Tel. +49 (0) 69 9 45 48 58-14 92                             Tel. +49 (0) 69 9 45 48 58-14 65               November         German Equity Forum 2021
   Fax +49 (0) 69 9 45 48 58-93 99                              Fax +49 (0) 69 9 45 48 58-93 99                01.12.2021       DZ Bank Equity Conference 2021
   P.Schlinkmann@dic-asset.de                                   M.Breuer@dic-asset.de

Disclaimer                                                                                                     Legal
This publication contains forward-looking statements including associated risks and uncertainties. These       DIC Asset AG
statements are based on the Management Board’s current experience, assumptions and forecasts and               Neue Mainzer Straße 20 · MainTor
the information ­currently available to it. The forward-looking statements are not to be interpreted as        60311 Frankfurt am Main
guarantees of the future developments and results mentioned therein. The actual business performance           Tel. (069) 9 45 48 58-0 · Fax (069) 9 45 48 58-93 99
and results of DIC Asset AG and of the Group are dependent on a multitude of factors that contain              ir­­@dic-asset.de · www.dic-asset.de
various risks and uncertainties. In the future, these might deviate significantly from the underlying
­assumptions made in this publication. Said risks and uncertainties are discussed in detail in the risk re-
 port as part of financial reporting. This publication does not constitute an offer to sell or an invitation   Realisation:
 to make an offer to buy shares of DIC Asset AG. DIC Asset AG is under no obligation to adjust or update       LinusContent AG, Frankfurt am Main
 the forward-looking statements contained in this publication.
 For computational reasons, rounding differences from the exact mathematical values calculated (in EUR
 thousand, %, etc.) may occur in tables and cross-references.

                                Half-year results 2021 | Conference Call                                                                                                      17
You can also read