2023 Colorado River Annual Operating Plan - Colorado River Management Work Group 4th Consultation October 12, 2022
←
→
Page content transcription
If your browser does not render page correctly, please read the page content below
2023 Colorado River
Annual Operating Plan
Colorado River Management Work Group
4th Consultation
October 12, 2022
Upper Colorado Basin

      Water Year 2022
        Hydrology

2
Upper Basin Storage (as of October 6, 2022)

                   Percent   Current     Live
                   Current     Live    Storage    Elevation
      Reservoir
                     Live    Storage   Capacity     (feet)
                   Storage    (maf)     (maf)

    Fontenelle       81       0.27      0.33      6,497.47

    Flaming
                     73       2.67      3.67      6,012.75
    Gorge

    Blue Mesa        35       0.29      0.83      7,445.66

    Navajo           53       0.87      1.65      6,020.85

    Lake Powell      25       5.85      23.31     3,530.21

    UC System
                     34      10.08      29.79
    Storage
    Total System
                     33      19.57      58.48
    Storage
3
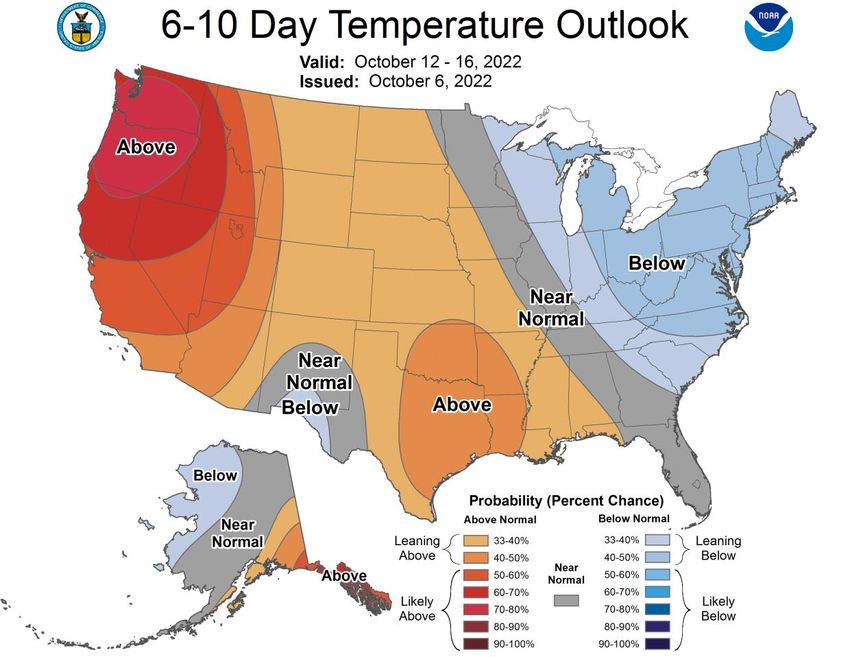
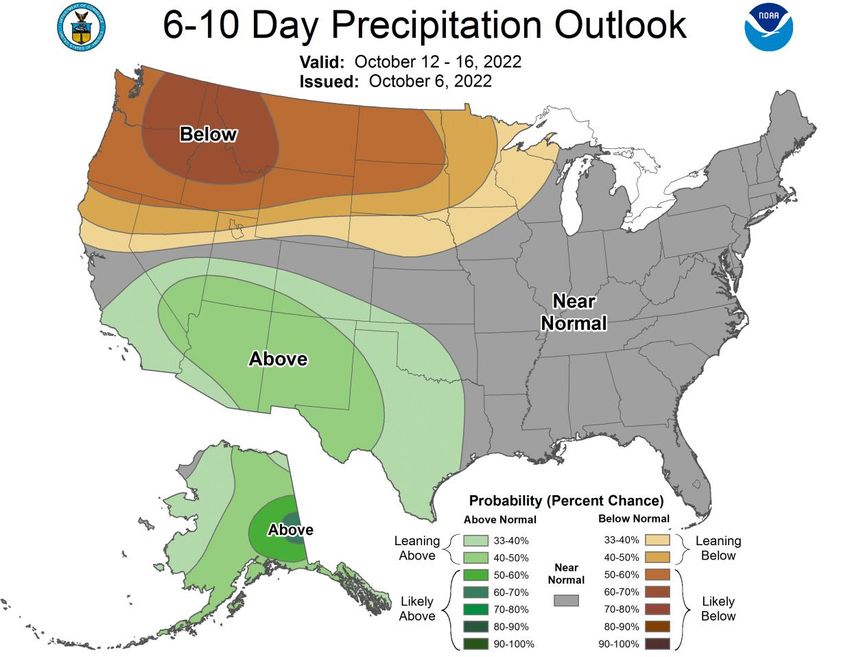
Precipitation and Temperature Outlook

4
Upper Colorado SWE and Observed Inflows

                        Available online at: https://waterwatch.usgs.gov/index.php?id=wwdur_cumrunoff

5
Most Probable – Observed and October Final
                                               Water Years 2022 and 2023
         April – July 2022                                           Water Year 2022                        Water Year 2023
    Observed Unregulated Inflow                                 Observed Unregulated Inflow            Unregulated Inflow Forecast
                                                                                                             as of October 1, 2022

                              Inflow        Percent                                Inflow   Percent                   Inflow     Percent
        Reservoir                                                      Reservoir                        Reservoir
                               (kaf)        of Avg1                                 (kaf)   of Avg1                    (kaf)     of Avg1

       Fontenelle               456            62                  Fontenelle       744       69       Fontenelle       930          87
    Flaming Gorge               552            57               Flaming Gorge       900       64      Flaming Gorge    1,215         86
       Blue Mesa                431            68                  Blue Mesa        639       71       Blue Mesa        820          91
         Navajo                 381            60                       Navajo      574       63         Navajo         790          87
         Powell                3,750           59                       Powell     6,079      63         Powell        8,100         84

    1Averages   are based on the 1991 through 2020 period of record.

6
7
Upper Basin Drought Response Actions
• The Bureau of Reclamation announced on May 3, 2022, two separate urgent drought response
  actions that will help prop up Lake Powell by nearly 1 million acre-feet (maf) of water over the next
  12 months (May 2022 through April 2023). To protect Lake Powell, more water will flow into the lake
  from upstream reservoirs and less water will be released downstream:

     • Under a Drought Contingency Plan adopted in 2022, approximately 500 thousand acre-feet (kaf) of water
       will come from Flaming Gorge Reservoir, located approximately 455 river miles upstream of Lake Powell
       (2022 Plan).
         • For more information: https://www.usbr.gov/uc/DocLibrary/Plans/20220429-2022DroughtResponseOperationsPlan-ApprovalMemo-
           508-DOI.pdf.

     • Another 480 kaf will be left in Lake Powell by reducing Glen Canyon Dam’s annual release volume from
       7.48 maf to 7.00 maf (GC Operational Adjustment), in accordance with Sections 6 and 7.D of the 2007
       Interim Guidelines.
         • For more information: https://www.usbr.gov/uc/DocLibrary/Plans/20220503-2022DROA-GlenCanyonDamOperationsDecisionLetter-
           508-DOI.pdf

8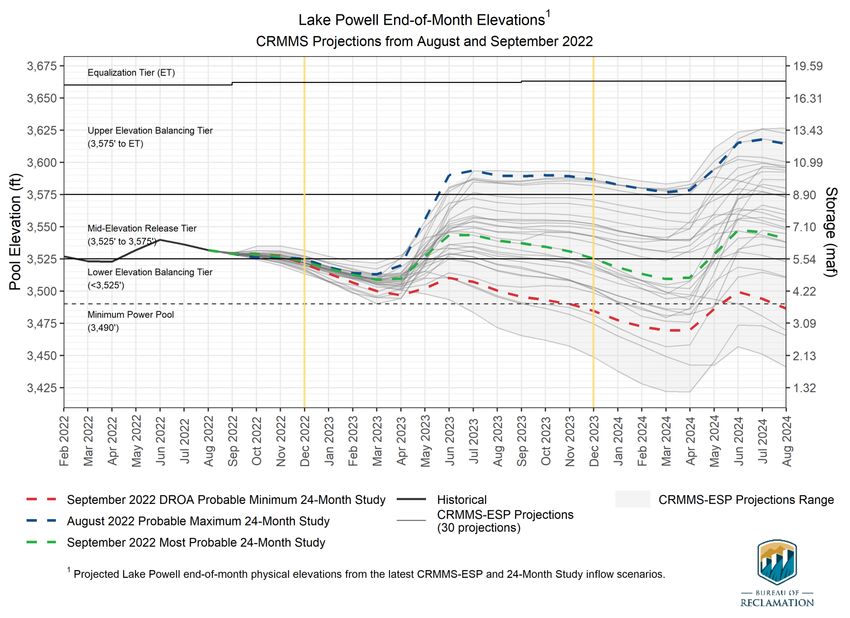
Drought Response Operations Agreement (DROA)
                                                                          Flaming Gorge 2022 Plan
              DROA Volumes Released1
                              2021            2022         Total   Historical   Future
                              DROA            DROA         DROA
      Reservoir
                             Volume          Volume       Volume
                              (kaf)           (kaf)        (kaf)
       Flaming
                                125             500        625
        Gorge
     Blue Mesa                   36               0         36
       Navajo                     0               0         0
     Volume in
                                161             500        661
      Powell
    1DROA   operational year is from May through April.

9
10
August & September
       24-Month Study
         Projections
     Upper Colorado Basin
      Region Operations

11
Timing of Operational Decisions • August 24-Month Study projections of January 1 elevations sets the operating tiers for Lake Powell and Lake Mead 12
Lake Powell & Lake Mead Operational Table
     Lake Powell Operational Tier Determination Run (aka “Exhibit Run”) with an 8.23 maf Release 1,2

          3,505.66 ft
         Jan 1, 2023
         Projection

     1Lake Powell and Lake Mead operational tier determinations are based on August 2022 24-Month Study projections and are documented in the draft 2023 AOP.
     2The operating determination for WY 2023 is based on a projected elevation “as if” the 0.48 maf were delivered to Lake Mead with a Glen Canyon Dam release pattern of 8.23
13
     maf.
Upper Basin Reservoir Operations
in Water Year 2023
• Lake Powell will be operated consistent with the 2007 Interim Guidelines, the Upper Basin Drought Response
Operations Agreement and Upper Basin Records of Decision
• Lake Powell’s projected end of calendar year (CY) 2022 “tier determination” elevation in the August 2022 24-Month
Study determines Lake Powell’s operating tier in CY 2023
• Lake Powell will operate in the Lower Elevation Balancing Tier where Lake Powell and Lake Mead will balance contents with Glen Canyon
Dam release volumes no less than 7.0 maf and no more than 9.5 maf
• Consistent with the provisions of the 2007 Interim Guidelines, and to preserve the benefits to Glen Canyon Dam
facilities from 2022 Operations into 2023 and 2024, Reclamation will consult with the Basin States on monthly and
annual operations. Reclamation will also ensure all appropriate consultation with Basin Tribes, the Republic of
Mexico, other federal agencies, water users and non-governmental organizations with respect to implementation of
these monthly and annual operations.
• The Glen Canyon Dam annual release has initially been set to 7.00 maf, and in April 2023 Reclamation will evaluate hydrologic conditions
to determine if balancing releases may be appropriate under the conditions established in the 2007 Interim Guidelines;
• Balancing releases will be limited (with a minimum of 7.00 maf) to protect Lake Powell from declining below elevation 3,525 feet at the
end of December 2023;
• Balancing releases will take into account operational neutrality of the 0.480 maf that was retained in Lake Powell under the May 2022
action1. Any Lake Powell balancing release volume will be calculated as if the 0.480 maf had been delivered to Lake Mead
in WY 2022; and
• The modeling approach for WY 2023 will apply to 2024.
14Powell Release Scenario 15
16
Reclamation Operational Modeling
Model Comparison
                               Colorado River Mid-term Modeling System (CRMMS)
                             24-Month Study Mode                   Ensemble Mode                               CRSS
                                (Manual Mode)                     (Rule-based Mode)
                            AOP tier determinations and
                                                            Risk-based operational planning     Long-term planning, comparison of
     Primary Use              projections of current
                                                                     and analysis                          alternatives
                                     conditions

     Simulated Reservoir
                            Operations input manually                               Rule-driven operations
     Operations
                                                                   Deterministic OR
     Probabilistic or          Deterministic – single
                                                               Probabilistic 30 (or more)           Probabilistic – 100+ traces
     Deterministic               hydrologic trace
                                                                   hydrologic traces

     Time Horizon (years)              1-2                                 1-5                                1 - 50
                                                                                                 Natural flow; historical, paleo, or
     Upper Basin Inflow     Unregulated forecast, 1 trace Unregulated ESP forecast, 30 traces
                                                                                                   climate change hydrology
     Upper Basin Demands                 Implicit, in unregulated inflow forecast                Explicit, 2016 UCRC assumptions

     Lower Basin Demands                    Official approved or operational                         Developed with LB users

17
Most Probable End of CY 2023 Projection:
3,525.22 feet (24% full)
Min/Max Range: 3,484.66 to 3,586.78 feet
Most Probable End of CY 2022 Projection:
3,522.79 feet (23% full)
Min/Max Range: 3,521.18 to 3,524.72 feet
18Lake Powell WY 2023 Operating Tier Scenarios
Based on August 2022 24-Month Study Inflow Scenarios
Inflow Operating Tier/
Scenario Release Volume
August DROA* Lower Elevation Balancing
Minimum Probable 7.00 maf
August Most Lower Elevation Balancing
Probable 7.00 maf
August DROA* Lower Elevation Balancing
Maximum Probable 9.50 maf
*The Drought Response Operations Agreement (DROA) can be found online at:
https://www.usbr.gov/dcp/finaldocs.html.
19Comparison of Current (August 2022) and Last Published (May 2022)
CRMMS-ESP 5-Year Projections
Chance of Lake Powell Falling Below Critical Reservoir Elevations in any Month of the Water Year (WY)
Run WY 2023 WY 2024 WY 2025 WY 2026 WY 20271
May 2022 90% 50% 37% 30% 23%
Lake Powell less than 3,525 feet August 2022 100% 50% 37% 30% 30%
Difference 10% 0% 0% 0% 7%
May 2022 3% 23% 17% 23% 13%
Lake Powell less than 3,490 feet
August 2022 10% 30% 20% 17% 13%
(minimum power pool)
Difference 7% 7% 3% -6% 0%
May 2022 0% 0% 0% 0% 0%
Lake Powell less than 3,375 feet
August 2022 0% 0% 0% 0% 0%
(dead pool = 3,370 feet)
Difference 0% 0% 0% 0% 0%
All results are computed based on projected physical elevations for Lake Powell.
1 For modeling purposes, simulated years beyond 2026 assume a continuation of the 2007 Interim Guidelines, the 2019 Colorado River Basin
Drought Contingency Plans, and Minute 323, including the Binational Water Scarcity Contingency Plan. Except for certain provisions related to
ICS recovery and Upper Basin demand management, operations under these agreements are in effect through 2026. Reclamation anticipates
beginning a process in early 2023 to develop operations for post-2026, and the modeling assumptions described here are subject to change
for the analysis to be used in that process.
20August & September
24-Month Study
Projections
Lower Colorado Basin
Region OperationsLower Colorado Basin System Conditions (as of October 6, 2022)
Percent Storage Elevation
Reservoir
Full (maf) (feet)
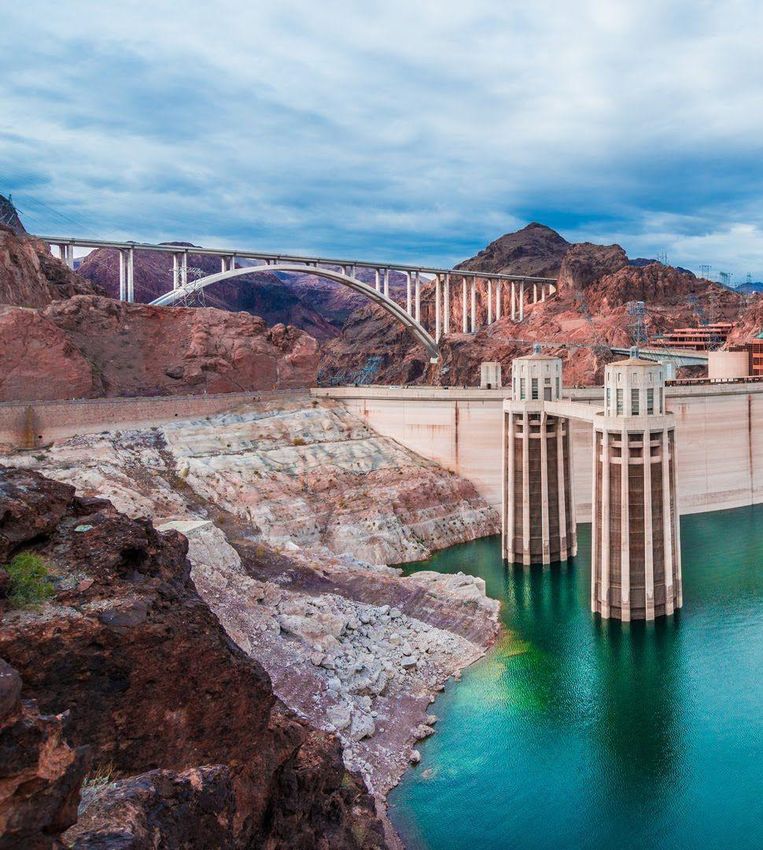
Lake Mead 28 7.35 1,045.38
Lake Mohave 86 1.56 637.85
Lake Havasu 93 0.58 447.81
Total System
33 19.57 -
Storage
Total System
Storage 38 22.82 -
(at this time last year)
22Lower Basin Side Inflows – WY/CY 20221,2,3
Intervening Flow from Glen Canyon to Hoover Dam
5-Year Average Observed Observed Difference From
Month in WY/CY 2022 Intervening Flow Intervening Flow Intervening Flow 5-Year Average
(kaf) (kaf) (% of Average) (kaf)
October 2021 69 80 116% 11
November 2021 68 42 62% -26
December 2021 69 64 94% -4
January 2022 87 60 69% -27
February 2022 88 58 65% -31
Observed
March 2022 107 41 39% -65
April 2022 72 30 43% -41
May 2022 43 8 18% -35
June 2022 22 16 72% -6
July 2022 56 70 125% 14
August 2022 66 186 283% 120
September 2022 62 120 193% 58
October 2022 69
Projected
November 2022 68
December 2022 69
WY 2022 Totals 810 776 96% -34
CY 2022 Totals 810 796 98% -14
1 Values were computed with the LC’s gain-loss model for the most recent 24-month study.
2 Percents of average are based on the 5-year mean from 2017-2021.
23 3Lake Mead's evaporation in the intervening flow mass balance incorporates evaporation coefficients developed by the USGS between 2010-2019. The study report
can be found online at: https://pubs.usgs.gov/of/2021/1022/ofr20211022.pdfLake Powell & Lake Mead Operational Table
Lake Mead Operating Condition Determination for CY 20231,2
1,047.61 ft
Jan 1, 2023
Projection
1Lake Powell and Lake Mead operational tier determinations are based on August 2022 24-Month Study projections and are documented in the draft 2023 AOP.
2The operating determination for CY 2023 is based on a projected elevation “as if” the 0.48 maf were delivered to Lake Mead with a Glen Canyon Dam release pattern of
24
7.00 maf in WY 2023.2007 Interim Guidelines, Minute 323, Lower Basin Drought Contingency Plan,
and Binational Water Scarcity Contingency Plan
Total Volumes (kaf)
Combined Volumes by Country
Binational
US: (2007 Interim Guidelines Shortages +
2007 Interim Minute 323 Total DCP Water Water Total
DCP Contributions)
Guidelines Delivery Combined Savings Scarcity Combined
Mexico: (Minute 323 Delivery Reductions +
Shortages Reductions Reductions Contributions Contingency Volumes
Lake Mead Binational Water Scarcity Contingency Plan
Plan Savings
Elevation Savings)
(feet msl)
Lower Lower Lower
Basin AZ NV CA Basin Mexico Basin
AZ NV Mexico AZ NV CA Mexico
States + Total Total Total States Total States +
Mexico Total Mexico
2022 2022
1,090 - 1,075 0 0 0 0 192 8 0 41 192 8 0 200 41 241 Operations
Operations
1,075 - 1050 320 13 50 383 192 8 0 30 512 21 0 533 80 613
1,050 - 1,045 400 17 70 487 192 8 0 34 592 25 0 617 104 721
2023 2023
1,045 - 1,040 400 17 70 487 240 10 200 76 640 27 200 867 146 1,013 Operations
Operations
1,040 - 1,035 400 17 70 487 240 10 250 84 640 27 250 917 154 1,071
1,035 - 1,030 400 17 70 487 240 10 300 92 640 27 300 967 162 1,129
1,030 - 1,025 400 17 70 487 240 10 350 101 640 27 350 1,017 171 1,188Most Probable End of CY 2023 Projection:
Most Probable End of CY 2022 Projection: 1,023.90 feet (23% full)
1,043.14 feet (28% full) Min/Max Range: 1,014.03 to 1,058.63 feet
Min/Max Range: 1,043.01 to 1,047.39 feet
26Projected Lake Mead Operational Tiers
Based on August and September 2022 24-Month Study Inflow Scenarios
Inflow CY 2023 CY 2024
Scenario Jan 1, 2023 Projection Jan 1, 2024 Projections
Level 1 Shortage Condition+
Probable Water Savings Contributions1,2
Maximum Level 2 Shortage Elevation 1,064.91 ft
Condition+ Water
Most Savings Level 2 Shortage Condition+
Water Savings Contributions1,3
Contributions1,2
Probable Elevation 1,031.30 ft
Level 3 Shortage Condition+
Probable Elevation 1,047.61 ft Water Savings Contributions1,3
Minimum Elevation 1,021.79 ft
1Water savings contributions consistent with the 2019 Colorado River Drought Contingency Plans and Section IV of IBWC Minute No. 323.
2Operating condition based on projected tier determination elevation from the August 2022 24-Month Study
3Operating condition based on projected tier determination elevation from the September 2022 24-Month Study
27Comparison of Current (August 2022) and Last Published (May 2022)
CRMMS-ESP 5-Year Projections
Chance of Lake Mead Falling Below Critical Reservoir Elevations in any Month of the Calendar Year
Run 2023 2024 2025 2026 20271
May 2022 40% 50% 47% 50% 53%
Lake Mead less than 1,020 feet August 2022 47% 57% 57% 60% 57%
Difference 7% 7% 10% 10% 4%
May 2022 0% 13% 20% 20% 13%
Lake Mead less than 1,000 feet August 2022 0% 23% 20% 20% 17%
Difference 0% 10% 0% 0% 4%
May 2022 0% 0% 0% 3% 3%
Lake Mead less than 950 feet
August 2022 0% 0% 0% 7% 3%
(minimum power pool)
Difference 0% 0% 0% 4% 0%
May 2022 0% 0% 0% 0% 0%
Lake Mead less than 900 feet
August 2022 0% 0% 0% 0% 0%
(dead pool = 895 feet)
Difference 0% 0% 0% 0% 0%
All results are computed based on projected physical elevations for Lake Mead.
1 For modeling purposes, simulated years beyond 2026 assume a continuation of the 2007 Interim Guidelines, the 2019 Colorado River Basin
Drought Contingency Plans, and Minute 323, including the Binational Water Scarcity Contingency Plan. Except for certain provisions related to
ICS recovery and Upper Basin demand management, operations under these agreements are in effect through 2026. Reclamation anticipates
beginning a process in early 2023 to develop operations for post-2026, and the modeling assumptions described here are subject to change
28
for the analysis to be used in that process.Additional Water Modeled Under 500 Plus Plan
(as modeled in the September 2022 Most Probable 24-Month Study)
Conservation Activity 2021 2022 2023
(volumes in AF) (Projected) (Projected)
CAP ICS delivery offset 6,147 19,604 -18,400
GRIC System Conservation 40,000 50,937 0
GRIC ICS creation 0 78,565 0
CRIT System Conservation (in lieu of ICS) 4,685 4,685 0
CAWCD System Conservation 0 35,506 0
YMIDD System Conservation 0 8,544 13,670
MVIDD System Conservation 0 9,592 9,592
MWD ICS delivery offset and/or creation 58,134 -9,200 -161,978
PVID System Conservation 12,305 50,800 58,000
SNWA ICS creation 12,832 15,000 15,000
Annual Total (Non-Shortage/DCP) 134,103 264,033 -84,116
Cumulative Total 134,103 398,136 314,020
• 2022 and 2023 volumes reflect executed agreements and/or current operational projections and are subject to change.
• Additional conservation activities are being considered. After new agreements are finalized and executed, these additional activities will be
29 included in Reclamation’s operational modeling.Additional Operational Data
Provisional 2022 Year-to-Date Totals
• Mexico Excess Flows
➢4,294 af (through 10/6)
• Brock Reservoir Total Storage
➢85,614 af (through 9/30)
• Senator Wash Total Storage
➢60,333 af (through 9/30)
30YAO Operations Update
• Pumped drainage return flows from the
Wellton-Mohawk Irrigation and Drainage
District
– Flow at station 0+00 on the Main Outlet
Drain from January through September 2022
was 72,761 ac-ft at 2,630 ppm
• Provisional drainage flows to the Colorado
River
– From the South Gila Drainage Wells
January through Sep 2022 was
1,355 ac-ft at 1,663 ppm
– From the Yuma Mesa Conduit January
through Sep 2022 was 25,050 ac-ft
31
at 1,219 ppm2023 Colorado River Annual Operating Plan
Colorado River Management Work Group
Final Consultation
October 12, 2022You can also read