2023 Integrated Resource Plan Public-Input Meeting - December 1, 2022
←
→
Page content transcription
If your browser does not render page correctly, please read the page content below
2023 Integrated Resource Plan
        Public-Input Meeting
            December 1, 2022

1
Agenda
    ▪ This is a RECORDED MEETING
    ▪ Approximate times shown in Pacific time zone

    9:00-9:30 a.m. – Introductions and Updates
    9:30-11:00 a.m. – Conservation Potential Assessment
    11:00-11:30 p.m. – State Allocation & MSP Status Update
    11:30-12:15 p.m. – Lunch Break (45 min)
    12:15-12:45 p.m. – Transmission Interconnection: Cluster Study 2 Results
    12:45-1:15 p.m. – Initial Risk and Reliability Study Plan
    1:15-2:15 p.m. – State Policy Update
    2:15-2:30 p.m. – Stakeholder Feedback Form Update
    2:30-2:45 p.m. – Wrap-Up / Next Steps

2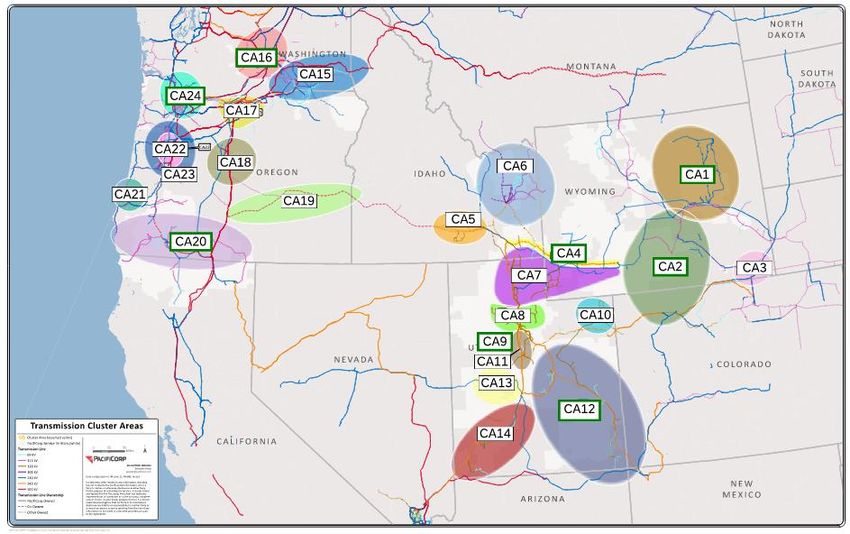
Overview of PacifiCorp’s
            IRP Development Process

Month 1   Month 2-3   Month 4-5 Month 6-11            Month 12-14         Month 13
                                                                                15

                                 Learn more about PacifiCorp's IRPs at:

3
Status Update Cont.
2023 IRP Upcoming Public Input Meeting Date(s)
February 25, 2022 - Public Input Meeting 1
April 7, 2022 - Public Input Meeting 2
May 12, 2022 - Public Input Meeting 3
June 10, 2022 - Public Input Meeting 4
July 14, 2022 - Public Input Meeting 5
September 1-2, 2022 - Public Input Meeting 6
October 13-14, 2022 - Public Input Meeting 7
December 1, 2022 - Public Input Meeting 8
January 13-14, 2023 - Public Input Meeting 9
February 23-24, 2023 - Public Input Meeting 10
4
Conservation Potential Assessment

5
Schedule and Milestones
        Throughout the 2023 CPA development process, we will continue to request feedback
        from interested parties.

          Timeframe                           Milestone                             Public Input Request
February 22, 2022           Share Work Plan                               Provide input on scope (2 emails)
February 25, 2022           Present on Scope of Work                      Additional input on scope (0 forms)
April 1 and April 7, 2022   Share Draft Lists, Present on Resource List   Provide feedback by April 11. (2 emails)
April 18, 2022              Finalize Resource Lists                       n/a – feedback incorporated
May 12, 2022                Share Key Drivers of Potential, Assumptions   Participate in meeting, provide input
September 1/2, 2022         Present Draft Results – Res and Com           Review materials and provide feedback
December 1/2, 2022          Present Final Results                         Provide final feedback
January 2023                Draft CPA for Review                          Provide input on draft report
February 2023               Publish Final Report                          n/a – feedback incorporated

    6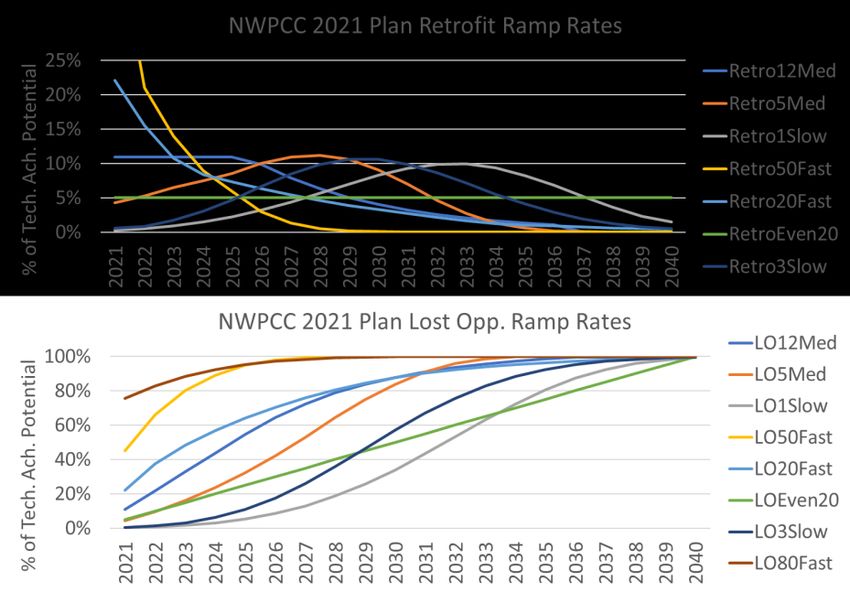
2023 CPA Analysis Themes
    CPA Forecasting is   • CPA forecasting is dynamic and markets change quickly
        Dynamic          • Analysis every two years to capture these changes

                         • Finalization of federal 45 lm/W backstop in 2022 for general service lighting
    Lighting Changes     • Adjusted federal lamp type definitions

      Segmentation       • Income thresholds for residential sector in all states

                         • Regional measure and market data sourcing
     State Specificity   • State specific codes, standards and lighting assumptions

                         • Baseline forecast includes climate change, building and vehicle
      Load Forecast        electrification

                         • 2023 CPA takes acceleration of key measures due to the 2022 Inflation
    New Federal Policy     Reduction Act (IRA) into account

7
Key Updates Relative to the 2021 CPA
        Change Area                                            Detail
                             Improved state-specific measure and market data sourcing
                             Updated residential surveys
State-Specific Adjustments   Updated load forecast data
                             Codes & Standards updates
                             Expanded integration of non-energy impacts in Washington
                             Residential Low- and Moderate-Income segmentation added
                             Lighting savings methods (market baseline and federal standards)
Forecasting Methodology      Inclusion of climate change in main forecast
                             Building electrification assumed in baseline forecast in all states
                             Adjusted key ramp rates to account for new federal efficiency legislation
                             Other updated secondary sources (e.g., DOE Annual Energy Outlook)
                             Renewed emerging technology screen
Other
                             Applicability and Saturation Sourcing Updates
                             Incremental Home Energy Reports only in CA/OR and New Construction
 8
Lighting
• General Service Lighting (GSL):
• 2023 CPA includes the codified 45 lm/W EISA (Energy Independence and Security Act of
2007) backstop and exempted bulb type re-definition, effective July 2022
• The 45 lm/W backstop does not currently have a widely available market analog
• Only CFLs and LEDs currently meet standard, and CFLs have low market penetration (~5%)
• Draft Results:
• UT and WY used frozen baseline = halogen standard jumped to new 45 lm/W backstop by 2024
• Final results incorporate:
• Market baseline (95% LEDs) for Utah
• Blended market and frozen baseline for Wyoming
• Other jurisdictions either 95% or 100% LED, depending on state
Overall Lighting Potential Trends, compared to 2021 CPA:
Lower CBSA 2019 exterior lighting power
New efficacy standard → large reduction
densities (LPDs) → reduction in exterior
in general service lighting
C&I lighting
Included CBSA 2019 data in weighting for
Bulb type redefinition → large reduction
Rocky Mountain Power states → lower
in exempted lighting
LPDs → reduction in C&I lighting
9Adjustments for Recent Federal Policy
• Inflation Reduction Act (IRA) + Infrastructure Investment & Jobs Act (IIJA) =
>$25 billion for rebate programs and tax incentives for energy efficiency
nationally
• Actual magnitude of cost reductions is uncertain at this time, but these Acts
are likely to accelerate measure adoption.
• To account for this, the 2023 CPA
accelerates the assumed uptake of
some HVAC, weatherization, and whole
building measures by accelerating
ramp rates from those used in the
2021 CPA.
• Examples:
• Window Measures
• Heat Pump Upgrades and Conversions
• ENERGY STAR Home Design
10Other Notable CPA Changes
• Climate Change inclusion • Measure Characterization Updates
• Higher AC saturation • Segmentation Updates
• EVs and Electrification • DOE Annual Energy Outlook 2022
Secondary
Load
Source
Forecast
Updates
Applicability
Emerging
& Saturation
Techs
Updates
• New Emerging Technologies • Updated residential survey
• More Efficient Options • Final NWPCC 2021 Power Plan
(e.g., NEEA Tier 5 HPWH) • CBSA 2019
112023 CPA – Energy Efficiency
Final Potential Results
12Key Drivers of Potential
Updated Load Forecast →
Increased incremental savings DOE Rulings (EISA backstop,
general service lighting
reclassification) →
Decreased Lighting potential
Electrification →
Increased HVAC and Water Heating
potential Updated ENERGY STAR® measure
>20% Increase in 20-
and market data →
Year Achievable Increased Cooking and Appliance
Updated residential surveys, AC
Technical Potential potential
saturation →
Increased Cooling potential
Updated measure
characterizations →
Increased HVAC, Water Heating,
Updated Segmentation → and Clothes Dryers potential as
Increased load and potential in more high efficiency equipment
office and retail passed cost screen for achievable
Decreased industrial potential technical potential
13Achievable Technical Potential Supply Curve
(All States, Cumulative MWh)
$800
$700
$600
Levelized Cost ($/MWh)
$500
$400
$300
$200
$100
$-
0 4,000,000 8,000,000 12,000,000 16,000,000 20,000,000
20-Year Cumulative Achievable Technical Potential (MWh at Gen.)
2021 CPA 2023 CPA
Total Cumulative 20-year Potential Comparison (GWh)
2021 CPA 2023 CPA % Difference
13,763 16,713 +21%
14Achievable Technical Potential Comparison
(All States – Incremental MWh – No Home Energy Reports)
Achievable Technical Potential Comparison (All States - No HERs - All Sectors)
1,200,000
1,000,000
Annual Incremental Potential (MWh at Gen.)
CA
800,000
ID
WA
600,000
WY
400,000 OR
UT
200,000
2021 CPA (No
HERs)
0
2023 2024 2025 2026 2027 2028 2029 2030 2031 2032 2033 2034 2035 2036 2037 2038 2039 2040 2041 2042
15Residential Results
Cumulative Savings by Measure Category (MWh, at Gen.) - All States - Residential
8,000,000
Cumulative Achievable Technical Potential
7,000,000
6,000,000 Whole Building/Home
Water Heating
(MWh, at Gen.)
5,000,000
Appliance/Plug Load
4,000,000
Weatherization
3,000,000 Lighting
HVAC
2,000,000
2021 CPA
1,000,000
0
2023 2024 2025 2026 2027 2028 2029 2030 2031 2032 2033 2034 2035 2036 2037 2038 2039 2040 2041 2042
Cumulative Cumulative
Rank Measure Name Savings % of Total Rank Measure Name Savings % of Total
(MWh at Gen) (MWh at Gen)
1 Water Heater (Residential Income-Based Analysis
20-Year Res ATP Savings Share by Income Share of Residential 20-Year ATP by Income and State
All States Except Oregon
Low Income
WY
13%
Regular Income
44%
WA
UT
ID
Moderate CA
Income
43%
0% 20% 40% 60% 80% 100%
Low Income Mod. Income Reg. Income
17Residential Income-Based Trends
• HVAC, lighting more dependent on household size. Larger income = larger size = more load
• For weatherization, disparity between income levels isn't as large as in HVAC
• For water heating, dependent on number of occupants per household. Typically, more
occupants in low-income homes, resulting in higher low-income water heating potential
20-Year Res Achievable Tech. Potential per Household by Measure Category and Income Level - All States
HVAC
Water Heating
Appliance/Plug Load
Weatherization
Whole Building/Home
Lighting
0 500 1,000 1,500 2,000
20-Year Achievable Technical Potential (kWh at Gen. per Household)
Low Income Mod. Income Reg. Income
18Commercial Results
Cumulative Savings by Measure Category (MWh, at Gen.) - All States - Commercial
7,000,000
Cooking
Cumulative Achievable Technical Potential
6,000,000 Waste Heat to Power
Refrigeration
5,000,000
Data Center
(MWh, at Gen.)
Behavioral/SEM
4,000,000
Whole Building/Home
3,000,000 Water Heating
Appliance/Plug Load
2,000,000
Weatherization
1,000,000 Lighting
HVAC
0 2021 CPA
2023 2024 2025 2026 2027 2028 2029 2030 2031 2032 2033 2034 2035 2036 2037 2038 2039 2040 2041 2042
Cumulative Cumulative
Rank Measure Name Savings % of Total Rank Measure Name Savings % of Total
(MWh at Gen) (MWh at Gen)
1 Linear Lighting 1,677,299 25.7% 6 Ventilation - Variable Speed Control 209,536 3.2%
2 Advanced New Construction Designs 376,227 5.8% 7 High-Bay Lighting 193,865 3.0%
3 Water-Cooled Chiller 289,004 4.4% 8 Retrocommissioning 163,218 2.5%
4 Strategic Energy Management 244,210 3.7% 9 Dedicated Outdoor Air System (DOAS) 137,080 2.1%
5 RTU 218,141 3.3% 10 HVAC - Energy Recovery Ventilator 135,860 2.1%
Total of Top 10 Measures 3,644,440 55.8%
19Industrial + Irrigation Results
Cumulative Savings by Measure Category (MWh, at Gen.) - All States - Industrial & Irrigation
4,000,000
Cumulative Achievable Technical Potential
3,500,000 Waste Heat to Power
Agriculture/Irrigation
3,000,000
Compressed Air
(MWh, at Gen.)
2,500,000 Refrigeration
Ind (Motor/Pump/Other)
2,000,000
Behavioral/SEM
1,500,000 Appliance/Plug Load
Weatherization
1,000,000
Lighting
500,000 HVAC
2021 CPA
0
2023 2024 2025 2026 2027 2028 2029 2030 2031 2032 2033 2034 2035 2036 2037 2038 2039 2040 2041 2042
Cumulative Cumulative
Rank Measure Name Savings % of Total Rank Measure Name Savings % of Total
(MWh at Gen) (MWh at Gen)
1 High-Bay Lighting 251,216 8.2% 6 Waste Heat to Power - Organic Rankine 154,437 5.0%
2 Linear Lighting 204,879 6.7% 7 Retrocommissioning 138,363 4.5%
3 Strategic Energy Management 202,625 6.6% 8 Fan System - Equipment Upgrade 101,308 3.3%
4 Pumping System - System Optimization 178,984 5.8% 9 Waste Heat to Power - High Temperature 100,392 3.3%
5 Advanced Industrial Motors 176,452 5.8% 10 Compressed Air - Equipment Upgrade 98,967 3.2%
Total of Top 10 Measures 1,607,622 52.5%
20Utah – Potential Results
Incremental Achievable Potential Potential by Sector (No HERs - UT)
700,000
Annual Incremental Potential (MWh at Gen.)
600,000
500,000
Irrigation
400,000
Industrial
Commercial
300,000
Residential
2021 CPA (No HERs)
200,000
100,000
0
2023 2024 2025 2026 2027 2028 2029 2030 2031 2032 2033 2034 2035 2036 2037 2038 2039 2040 2041 2042
20-Year Cumulative Achievable Technical Potential - UT - All Sectors
2023 CPA
2021 CPA
0 1,000,000 2,000,000 3,000,000 4,000,000 5,000,000 6,000,000 7,000,000 8,000,000 9,000,000 10,000,000
Cumulative Achievable Technical Potential (MWh, at Gen.)
21HVAC Lighting Weatherization Appliance/Plug Load Water Heating
Whole Building/Home Behavioral/SEM Ind (Motor/Pump/Other) Data Center Refrigeration
Compressed Air Waste Heat to Power Agriculture/Irrigation CookingWyoming – Potential Results
Incremental Achievable Potential Potential by Sector (No HERs - WY)
140,000
Annual Incremental Potential (MWh at Gen.)
120,000
100,000
Irrigation
80,000
Industrial
Commercial
60,000
Residential
2021 CPA (No HERs)
40,000
20,000
0
2023 2024 2025 2026 2027 2028 2029 2030 2031 2032 2033 2034 2035 2036 2037 2038 2039 2040 2041 2042
20-Year Cumulative Achievable Technical Potential - WY - All Sectors
2023 CPA
2021 CPA
0 200,000 400,000 600,000 800,000 1,000,000 1,200,000 1,400,000 1,600,000 1,800,000
Cumulative Achievable Technical Potential (MWh, at Gen.)
22HVAC Lighting Weatherization Appliance/Plug Load Water Heating
Whole Building/Home Behavioral/SEM Ind (Motor/Pump/Other) Data Center Refrigeration
Compressed Air Waste Heat to Power Agriculture/Irrigation CookingIdaho – Potential Results
Incremental Achievable Potential Potential by Sector (No HERs - ID)
60,000
Annual Incremental Potential (MWh at Gen.)
50,000
40,000
Irrigation
Industrial
30,000
Commercial
Residential
20,000
2021 CPA (No HERs)
10,000
0
2023 2024 2025 2026 2027 2028 2029 2030 2031 2032 2033 2034 2035 2036 2037 2038 2039 2040 2041 2042
20-Year Cumulative Achievable Technical Potential - ID - All Sectors
2023 CPA
2021 CPA
0 100,000 200,000 300,000 400,000 500,000 600,000 700,000
Cumulative Achievable Technical Potential (MWh, at Gen.)
23HVAC Lighting Weatherization Appliance/Plug Load Water Heating
Whole Building/Home Behavioral/SEM Ind (Motor/Pump/Other) Data Center Refrigeration
Compressed Air Waste Heat to Power Agriculture/Irrigation CookingOregon - Potential Results
Incremental Achievable Potential Potential by Sector (No HERs - OR)
250,000
Annual Incremental Potential (MWh at Gen.)
200,000
Irrigation
150,000
Industrial
Commercial
100,000 Residential
2021 CPA (No HERs)
50,000
0
2023 2024 2025 2026 2027 2028 2029 2030 2031 2032 2033 2034 2035 2036 2037 2038 2039 2040 2041 2042
20-Year Cumulative Achievable Technical Potential - OR - All Sectors
2023 CPA
2021 CPA
0 500,000 1,000,000 1,500,000 2,000,000 2,500,000 3,000,000 3,500,000 4,000,000
Cumulative Achievable Technical Potential (MWh, at Gen.)
24HVAC Lighting Weatherization Appliance/Plug Load Water Heating
Whole Building/Home Behavioral/SEM Ind (Motor/Pump/Other) Data Center Refrigeration
Compressed Air Waste Heat to Power Agriculture/Irrigation CookingWashington – Potential Results
Incremental Achievable Potential Potential by Sector (No HERs - WA)
90,000
Annual Incremental Potential (MWh at Gen.)
80,000
70,000
60,000
Irrigation
50,000 Industrial
Commercial
40,000
Residential
30,000
2021 CPA (No HERs)
20,000
10,000
0
2023 2024 2025 2026 2027 2028 2029 2030 2031 2032 2033 2034 2035 2036 2037 2038 2039 2040 2041 2042
20-Year Cumulative Achievable Technical Potential - WA - All Sectors
2023 CPA
2021 CPA
0 200,000 400,000 600,000 800,000 1,000,000 1,200,000
Cumulative Achievable Technical Potential (MWh, at Gen.)
25HVAC Lighting Weatherization Appliance/Plug Load Water Heating
Whole Building/Home Behavioral/SEM Ind (Motor/Pump/Other) Data Center Refrigeration
Compressed Air Waste Heat to Power Agriculture/Irrigation CookingCalifornia – Potential Results
Incremental Achievable Potential Potential by Sector (No HERs - CA)
14,000
Annual Incremental Potential (MWh at Gen.)
12,000
10,000
Irrigation
8,000
Industrial
Commercial
6,000
Residential
2021 CPA (No HERs)
4,000
2,000
0
2023 2024 2025 2026 2027 2028 2029 2030 2031 2032 2033 2034 2035 2036 2037 2038 2039 2040 2041 2042
20-Year Cumulative Achievable Technical Potential - CA - All Sectors
2023 CPA
2021 CPA
0 20,000 40,000 60,000 80,000 100,000 120,000 140,000 160,000 180,000
Cumulative Achievable Technical Potential (MWh, at Gen.)
26HVAC Lighting Weatherization Appliance/Plug Load Water Heating
Whole Building/Home Behavioral/SEM Ind (Motor/Pump/Other) Data Center Refrigeration
Compressed Air Waste Heat to Power Agriculture/Irrigation CookingDemand Response 27
DR Potential Methods

                                     3. Baseline
   1. Program        2. Customer                    4. Customer    5. Estimate
                                    Peak Demand
 Characterization   Segmentation                     Eligibility    Potential
                                      Forecast

 Main Data Sources:
 • Existing program data, where available (UT Cool Keeper, UT Batteries,
   Irrigation Load Control)
 • Northwest Power and Conservation Council’s 2021 Power Plan
 • Regional studies (e.g., 2018 BPA CTA-2045 water heater
   demonstration report)

28
DR Resources Assessed
Program Category Program Bundle Current/Planned Offering
Electric Vehicle Connected Charger Direct
Load Control (DLC)
HVAC DLC UT
Direct Load Control
(Conventional) Irrigation Load Control UT, ID, OR, WA
Pool Pump DLC
Domestic Hot Water Heater (DHW) DLC OR, WA
DLC of Smart Home
Direct Load Control
(Smart / Interactive) Grid Interactive Water Heater (GIWH) OR, WA
Connected Thermostats DLC OR, WA
Energy Storage Battery Energy Storage DLC UT, ID
Curtailment Third-Party ID, UT, OR, WA
29Technology Dependencies
Program Option Eligibility Requirements
Water Heater DLC Water Heater (electric resistance [ER] or heat pump [HP])
GIWH DLC Grid-Interactive Water Heater (ER or HP)
Pool Pump DLC Pool Pump
HVAC DLC At least one:
• Central AC • Electric Furnace
• Air-Source Heat Pump • Roof Top Unit (RTU)
• Geothermal Heat Pump
Third-Party - Fast Energy Management System
Smart Thermostats Smart Thermostat + at least one of:
• Central AC • Geothermal Heat Pump
• Air-Source Heat Pump
DLC of Smart Home Home Energy Management System
Saturations align with those calculated for the energy efficiency analysis.
30HVAC and Control Saturations
Steady levels of central cooling
over the study horizon. These
customers are eligible for HVAC
DLC.
In addition to central cooling,
used the adoption of smart
thermostats from the energy
efficiency analysis to determine
eligibility for Bring Your Own
Thermostat (BYOT) programs.
In RMP states, we prioritized
HVAC DLC over BYOT.
31Water Heater Saturations
OR and WA are requiring new
water heaters to be grid-
interactive (e.g., CTA-2045).
Non-GIWH stock decreases as
purchased GIWHs saturate the
market.
We assumed conservative grid-
interactive water heater growth
in other states.
In UT, electrification in the
baseline drove the growth in
electric water heating.
32Customer Segmentation DR programs typically target customers by sector and size. Used historical peak load data to allocate customers and peak load within states to the sector level. Used monthly demand* to further segment the C&I population: Small C&I < 30 MW Medium C&I 30-500 MW Large C&I 500-1,000 MW Extra-Large C&I > 1,000 MW *Non-coincident monthly maximum billed kW. 33
Peak Demand Forecast
Applied the customer segmentation to the utility peak demand forecast,
allowing the contribution to peak to change based on the sector-level changes
in energy consumption.

34
Peak Demand Forecast
Adjusted the utility forecast by removing the peak demand impacts generated
through achievable energy efficiency potential to account for interactions
between EE and DR and avoid double counting impacts.

35
2023 CPA – Demand Response
           Potential Results

36
20-Year Potential Summary - Summer Estimated potential (including existing/planned resources) ranged between 5% and 10% of the baseline peak demand forecast over the 20-year forecast period. DR potential is incremental to any peak demand impacts from energy efficiency. 37
20-Year Potential Summary - Summer
     HVAC DLC, Irrigation DLC, and Third-Party Curtailment contributed an
     estimated 57% of summer DR potential in 2042 (681 MW), much of which
     came from existing resources.
     HVAC DLC, EV DLC, and Smart Thermostats contributed most of the
     incremental potential (416 MW of the 736 MW from incremental potential)

38
20-Year Potential Summary - Winter
HVAC DLC, Grid-Interactive Water-Heating DLC (GIWH), and EV DLC
contributed most of the winter DR potential in 2042 (484 MW of 884 MW in
total).
39RMP Potential Summary - Summer
• Rocky Mountain Power potential was
driven by existing programs in ID
(Irrigation Load Control) and UT (AC
Cool Credit, Irrigation Load Control and
Curtailment, Wattsmart Batteries).
• Nearly all estimated potential in ID was
generated by existing Irrigation DLC.
• Customer and participation growth,
electrification led to incremental
potential in UT’s existing programs.
• New resources contributed just over
half (56%) of all estimated summer
potential in RMP states in 2042.
40Pac Power Potential Summary - Summer
• Most of the estimated potential
in Pacific Power in 2042 was
driven by new resources (76%).
• Control of grid-interactive water
heaters (GIWH) provided a
substantial source of DR potential
in 2042—over 25% of summer DR
potential in all Pacific Power
states was generated by GIWH
DLC.
• Water heating savings increase
by almost 50% in the winter.
415-Year Levelized Costs
• Incorporated incentive de-rate
factors for Pacific Power according
to the CA DR Cost-Effectiveness
Protocol.
• Levelized costs align well with the
2021 Power Plan.
• Costs are split 50/50 between the
summer and winter. Levelized
costs are doubled if running the
program for a single season.
(Except for Irrigation DLC, which
contributed no winter impacts)
42Next Steps • Input results for model selections • Prepare draft report for review • Finalize report • Conduct SCGHG scenario analysis for energy efficiency selections 43
State Allocation Methodology

44
Multi-State Protocol: Status Update
 • Presently, PacifiCorp’s six-state allocation of resource costs are prescribed by the 2020
   Protocol Agreement and the Washington Inter-Jurisdictional Allocation Methodology
   (WIJAM)
 • PacifiCorp is currently involved in settlement negotiations with signatories of the 2020
   Protocol through the Framework Issues Working Group.
      • The 2020 Protocol defined a modification of current allocation methods for the period from 1/1/2020 to
        12/21/2023
            •   Amended the 2017 Protocol for California, Oregon, Idaho, Utah and Wyoming
            •   Modified West Control Area (“WCA”) allocation method for Washington
      • Also resolves some issues for a future allocation method, subject to resolution of remaining open items,
        and sets out a process to resolve those remaining issues and finalize a new allocation method (“Post-
        Interim Period Method”) to be effective 1/1/2024 as structured in the 2020 Protocol
 • Consistent with the terms, various non-disclosure agreements, and settlement privileges in
   the various states, these negotiations are confidential.
 • The confidential nature of these discussions allows for parties to negotiate in good faith.
 • PacifiCorp continues to meet with stakeholders every other month, with significant
   engagement and involvement by all parties.
 • Various options have been proposed by the Company and other parties, and are being
   assessed.
      • This is necessarily a data and time-intensive process and analysis as stakeholders consider the various
        nuances of how to set allocation factors going forward.

45
State Allocations and Resource Planning
• PacifiCorp continues to maintain a system optimization approach in its long-term
resource planning and the IRP: the initial modeling is agnostic to state-specific
resource and cost allocations.
• To analyze and assess state-specific policies and compliance, a set of state-
specific allocations will be applied to all resources’ generation and associated
costs and characteristics (e.g., carbon emissions).
• Pending settlement of MSP Framework Issues and a Post-Interim allocation
methodology, assumptions must be made regarding an allocation framework
across the six-state system.
• The allocation methodology will be applied to optimized system portfolios to
analyze and evaluate portfolio performance against state-specific policies and
requirements:
• Washington’s Clean Energy Transformation Act (CETA) clean energy targets
• Oregon’s HB 2021 / Clean Energy Plan emissions targets
• Oregon's Small-Scale Renewable Capacity Standard
• Various state Renewable Portfolio Standards
• Wyoming HB 200 / low carbon standard for carbon capture utilization and storage technology
46Conceptual Framework: State Allocations
• To assess state-specific compliance of a system optimized portfolio, a post-model state-
allocation calculation is required:
• In the year 2023, allocations are set by the 2020 Protocol and WIJAM.
• Resource allocation is primarily based on the System Generation (SG) factor, which is weighted:
• 75% based on a state's share of load during the coincident peak hour in each month of a year
• 25% based on a state's share of total load in the year
• Certain "situs" resources are 100% assigned to specific states:
• Demand side management – both energy efficiency and demand response
• New QFs contracts, entered since 1/1/2020
• Existing QFs, contracted prior through 12/31/2019, starting in 2030
• Portfolio standard resources and other state-specific initiatives
• For 2024 and beyond, in the absence of a specific resolution of the MSP Framework Issues,
PacifiCorp proposes to continue applying allocations based on the SG factor from the 2020
Protocol and WIJAM, unless a particular resource is precluded by any applicable state-
specific policies
• The resulting resource allocations will be used to assess state policy compliance (listed on
prior slide):
• Any resource additions made after the system-optimized portfolio is developed will be allocated to
the state(s) that need them.
• The resulting portfolio of system resources and state-specific resources will ensure all state policy
requirements are met.
47Transmission Interconnection:
Cluster Study 2 Results
48Generation Interconnection:
Cluster Study 2
• PacifiCorp uses an annual Cluster Study process to identify transmission upgrades
necessary to accommodate new resources. 24 Cluster Studies were recently
completed for resource requests submitted in May 2022.
• Studies are posted online:
https://www.oasis.oati.com/woa/docs/PPW/PPWdocs/Cluster2_ClusterStudies.htm
• For more on interconnection and the IRP, see PacifiCorp’s June 10, 2022 public
input meeting.
• Transmission upgrade options for the 2023 IRP were previously identified in
PacifiCorp’s Oct. 13, 2022 public input meeting.
• The Cluster Study 2 results may replace or augment options previously identified,
depending on the particulars of each cluster location. This is still being evaluated.
• Key Cluster Study 2 details are provided on the next two slides.
49Cluster Study 2 Map
1,631 MW
733 MW
899 MW
1 MW 1,966 MW
9 MW 1,493
2,024 MW
719 MW
3,136 MW
160 MW 1,816 MW
1,100 MW 5,600 MW
2,349 MW 160 MW
2,607 MW
2,358 MW
4,971 MW 20 MW
20 MW
237 MW
3,566 MW
2,017 MW
50Cluster Study 2 Summary
Network Cluster Contingent
Upgrades Requests Project Project
Cluster Location $/kW MW Date Date Major Contingent Major Upgrades
CA01 northeastern Wyoming $ 1,041 1,966 2029 Q4 2027 D3 D3.2, D1.2, Casper-Anticline 500 kV
CA02 southeastern Wyoming $ 1,234 1,816 2029 Q4 2027 GWS, D3 GWS.2, D1.2
CA03 Laramie $ 730 160 2029 Q4 2027 GWS, D3 Fort Sander-Foote Creek-Standpipe 230 kV
CA04 Bridger System $ 1,389 5,600 2031 Q4 2027 D3 D3.2 x 5, Populus-Terminal 500 kV x 2, GWS.2
CA05 Borah West $ - 1,100 2026 Q4 2024 NRIS: B2H, SegE n/a
CA06 Goshen $ 700 1,493 2029 Q4 2030 Goshen-Populus-Terminal 345 kV
CA07 NUT $ 305 2,607 [tbd] [2024] Q799 Naughton-Ben Lomond 345 kV x 2
CA08 Salt Lake Valley $ 48 2,358 2028 Q4 2024 138 kV upgrades
CA09 Clover $ 52 4,971 2029 Q4 2027 GWS, SFM Mona-Mercer-Camp Williams 345 kV
CA10 Ashley $ 42 20 2026 n/a n/a
CA11 Nebo $ 187 20 2026 n/a n/a
CA12 southeast Utah $ 494 3,566 2029 Q4 2027 GWS, SFM Emery/Pinto/Clover/Huntington 345 kV
CA13 Pavant $ 331 237 2029 Q4 2027 SFM Pavant-Sigurd 230 kV
CA14 southwest Utah $ 716 2,017 2029 Q3 2028 GWS, SFM Sigurd/Clover/Various 345 kV
CA15 Walla Walla $ 40 733 2026 Q2 2027 NRIS: B2H, SegE NRIS: Longhorn-Cold Springs 500kV
CA16 Yakima $ 129 1,631 2029 Q4 2025 NRIS: B2H, SegE Union Gap/Midway/Various 230 kV/115 kV
CA17 northeast Oregon $ 770 1 2025 n/a n/a
CA18 central Oregon $ 103 2,024 2028 [tbd] NRIS: B2H, SegE North Corral 500/230 kV Substation
CA19 eastern Oregon $ 0 3,136 2029 Q4 2026 NRIS: B2H, SegE Burns-Summer Lake #2 500 kV
CA20 southern OR/northern CA $ 379 2,349 2029 Q4 2028 NRIS: B2H, SegE Lane/Dixonville/Sams Valley/Various 500 kV
CA21 Coos Bay $ 10 160 2026 n/a NRIS: Dixonville-Isthmus 230 kV
CA22 Albany $ 81 9 2025 n/a n/a
CA23 Willamette Valley $ 2 719 2026 2023 n/a
CA24 Portland $ 270 899 2029 n/a Swift/Various 230 kV / 115 kV
Total 39,591 SFM: Spanish Fork-Mercer 345 kV
NRIS: Network Integration Interconnection Service (supports transfers to less constrained parts of the system)
All results subject to change. Cluster Project Date includes 12 months to complete Facilities Study and execute LGIA.
51Initial Risk and Reliability
Study Plan
52Initial Risk and Reliability Study
PacifiCorp is preparing a pair of studies to evaluate risk and reliability:
• Hourly deterministic analysis: 1 iteration with “normal” conditions
• Same “ST” model analysis normally reported for each portfolio.
• Identify hourly loss of load events and hourly marginal energy prices.
• Hourly stochastic analysis: 50 iterations with a range of conditions
• Very processor intensive: normal ST model x 50. Four years to be
evaluated: 2025, 2030, 2035, 2040
• Identify hourly loss of load probability (LOLP) and hourly marginal energy
prices.
Analysis - Higher average loss of load probability and marginal energy prices
expected in stochastics vs “normal”
53Initial Risk and Reliability Study
Outputs that will set targets for use in the 2023 IRP:
• Planning Reserve Requirements:
• Identify generic incremental stochastic requirement above “normal” conditions.
• Requirements expected to vary over time, primarily as a result of the evolution of
the portfolio.
• For example, higher penetration of storage will increase the need for long-
duration resources.
• Reliability under “normal” conditions is calculated for every portfolio.
• Reliable portfolios need to have adequate resources to cover both portfolio-specific
“normal” shortfalls plus the generic incremental stochastic requirements.
• Energy Efficiency Bundling
• Net cost of each measure incorporates capacity contribution (calculated from LOLP)
and marginal energy value. Measures with similar net costs be bundled.
• Stochastic Risk Adjustment
• Difference in resource value between stochastic and “normal” conditions
• This credit has previously been applied to energy efficiency only
• The results may indicate whether other resource types have significant impacts on risk
54State Policy Update 55
Utah Community Renewable Program
                                        (HB411)
 Overview:
 • Created an opt-out program with a goal of being 100% net renewable by
   2030.
 • Cities and communities elect to participate on behalf of their residents.
   Customers within a participating community may opt out of the program
   and maintain existing rates
 • The legislation prohibits cost shifting to other non-participating customers.
 Timeline:
 • April 2019 – Utah passes HB 411
 • December 2019
     • 23 Utah communities pass a resolution to be 100% renewable by 2030 as required by
       the statute for participation. 18 of the 23 eligible communities have officially taken
       the next step in their participation by signing the Governance Agreement.
     • The Utah Public Service Commission adopts administrative rules to facilitate the
       program
 • January 2022 – program design meetings begin and are currently ongoing
56
Wyoming House Bill 200
Overview:
• Required the Wyoming Public Service Commission to establish administrative
rules requiring public utilities to develop low carbon portfolio standards utilizing
carbon capture, utilization and storage (CCUS) by 2030
• Requirement would apply to generation allocated to Wyoming customers only
• Two percent cost cap is specified in the legislation to limit customer impact
Timeline:
• Low carbon portfolio standard administrative rules went into effect on January 3,
2022
• PacifiCorp filed its initial application on March 31, 2022 requesting to conduct a
request for proposal (RFP) process to conduct further analysis to determine if
CCUS is technically and financially feasible for Jim Bridger Units 3 and 4 and Dave
Johnston Unit 4
• Wyoming Public Service Commission deliberations for the initial application are scheduled
for November 29, 2022
• Final plan is required to be filed no later than March 31, 2023
• PacifiCorp has requested an extension in order to complete the RFP process and the
technical and financial analyses
• RFP was issued on October 26, 2022
57Washington Clean Energy Transformation Act
(2019 WA. Laws SB 5116)
Overview:
• Created several state decarbonization policies, including:
• Eliminating coal-fired resources from Washington rates by the end of 2025;
• Requiring greenhouse gas-neutral retail electricity in Washington by 2030;
• Requiring carbon free retail electricity in Washington by 2045.
Timeline:
• May 2019 – CETA signed into law
• June 2019 through December 2021 – CETA Stakeholder discussions
• December 2021 – PacifiCorp files 2021 Clean Energy Implementation Plan
• June 2022 – WUTC Staff initiates Complaint on PacifiCorp’s CEIP
• November 2022 – Settlement Reached in Complaint on PacifiCorp’s CEIP
• December 2022 – Staff withdrawal of CEIP Complaint. CEIP docket currently in
process. Expected resolution by March 2023.
58Oregon Clean Energy Plan
(HB 2021)
Overview:
• Requires retail electricity providers to reduce GHG emission associated with
electricity sold to Oregon consumers by:
80% below baseline emissions levels by 2030;
90% below baseline emissions levels by 2035; and
100% below baseline emissions levels by 2040
Timeline:
• July 2021 – CEP signed into law, effective September 25, 2021
• January 2022 and on-going UM 2225 Staff’s Investigation into CEP of a near-term
focus on OPUC guidance for implementation
• March 2023 – PacifiCorp will file their first Clean Energy Plan with the IRP filing
In the January stakeholder meeting PacifiCorp will provide an update on its
ongoing coordination between with Portland General Electric, Oregon Department
of Environment Quality and Oregon Public Utility commission related to emissions
analysis assumptions, reporting templates and communication protocols.
59Oregon Clean Energy Plan
High-level Roadmap
Today
November December January February March April May
Initial Drafting + Review Filing:
IRP: 2040 GHG Analyze Final Review
Plan Establish High-level 2040 Resource Plan 3/31/23
and and Filing
Modeling Refine IRP/CEP
Identify Requirements Analyze and Draft Initial Results Finalize Initial
Resilience: Initial Study – CEP
Review Existing Data
Study Input
and Metrics
CBIAG Meetings - Monthly
Stakeholder
Establish CBIs CEP Input
Engagement
Finalize CBRE
Community Based Draft CBRE
Plan – CEP
Renewable Energy: Confirm Requirements and Assess Process/Approach Input
CBRE Projects
Initial Project Inventory Develop, socialize with stakeholders,
and finalize initial CBRE action plan
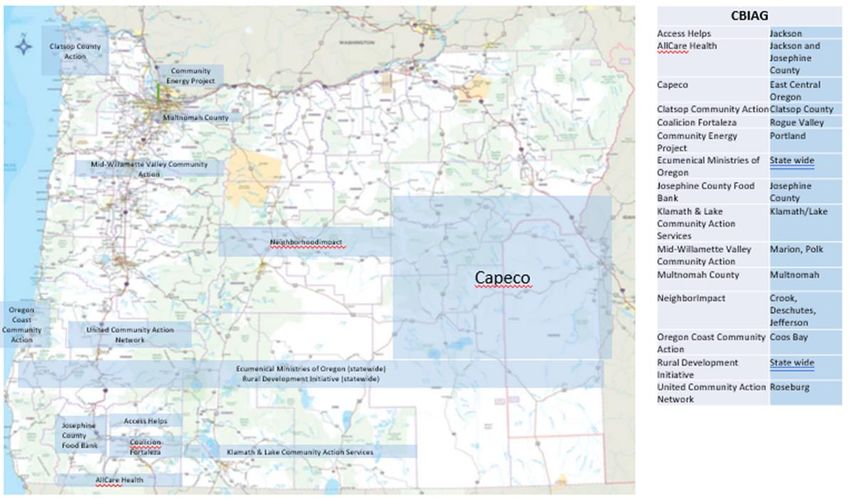
60Community Benefits &
Impacts Advisory Group (CBIAG)
Pacific Power has convened the CBIAG to focus on equity and a clean
energy future in the state of Oregon in accordance with HB 2021
• PacifiCorp plans to continue seeking direct stakeholder feedback to build an
inclusive and accessible process for consultation and collaboration. This
includes:
• Increasing participation from communities that have not traditionally
participated in utility planning processes.
• Providing the Company with a better understanding of community needs
and perspectives.
• Identifying barriers to participation and input on how to address these
barriers.
• Acting as a conduit to exchange information and ideas between the
Company and stakeholder communities; and
• Assisting with community outreach.
61Key Areas for Cross Utility Coordination 1.Coordinating on who is tapped for the CBIAG; each utility achieves a ‘unique’ footprint 2. Findings and learnings are shared to advance energy equity and an equitable clean energy future 3. Compensation and valuing CBIAG member contribution is the same 62
Past and Near Term CBIAG
                            Topics and Meetings
                                              Community needs & priorities
                                               CBIAG charter development
                                     Pacific Power programs and planning processes

OCT                          NOV                            DEC                      JAN
•   Orientation & Onboarding •  Programs overview           • CBIAG charter          • CBIAG charter
                             •  CBI Primer                  • CEP Overview           • DSP Intro
                             •  Initial equity metrics      • CBI Development        • CBI Development
                                discussion
                             •  Low Income Rate

63
FOR MORE INFORMATION
Oregon Clean Energy Plan Updated Engagement Strategy
um2225hah161643.pdf (state.or.us)
JOIN US FOR THE NEXT MEETINGS
Oregon Community Benefits and Impacts Advisory Group
(pacificorp.com)
64Stakeholder Feedback 65
Stakeholder Feedback Form Update
 • 27 stakeholder feedback forms submitted to date
 • Stakeholder feedback forms and responses can be located at:
     pacificorp.com/energy/integrated-resource-plan/comments
 • Depending on the type and complexity of the stakeholder feedback, responses may
   be provided in a variety of ways including, but not limited to, a written response, a
   follow-up conversation, or incorporation into subsequent public-input meeting
   material
      • Generally, written responses are provided with the form and posted online at
        the link mentioned above
 • Stakeholder feedback following the previous public input meetings is summarized on
   the following slides for reference

66
Summary – Recent Stakeholder Feedback Forms
Stakeholder Date Topic Brief Summary* Response*
Powder River October 5, 2022 Natrium nuclear facility Natrium project risk Posted
Basin Resource considerations, fuel
Council availability and waste
disposal
Sierra Club October 16, 2022 Multiple Topics Reliability resources, coal Posted
capacity factors, CCUS, load
forecast adjustments,
supply side resource
adjustments, IRA, Jim
Bridger fuel contract
Western Energy October 27, 2022 2023 Supply-Side Resources Recommends specified Posted
Storage Task Force forecast for utility-scale
battery storage resources
and proposed revising price
modifications.
Sierra Club November 18, 2022 Inflation Reduction Act Relationship between IRA Pending Review
and load forecast
assumptions
Utah Clean Energy November 23, 2022 Lila Canyon Coal Mine fire Risk and Ratepayer Pending Review
Assumptions resulting from
damage to Lila Canyon
*Full comments and PacifiCorp’s responses can be found online at https://www.pacificorp.com/energy/integrated-resource-plan/comments.html
67Additional Stakeholder Updates
• On November 21, Western Resource Advocates submitted an inquiry on the
impact of the Puget Sound Energy transfer of Colstrip units 3 & 4 to Talen
Energy*.
o Specifically, this request seeks to understand the implications
for PacifiCorp and its ratepayers prior to 2025 and beyond.
o Current PacifiCorp resource assumptions for Colstrip forecast a
retirement date for units 3 & 4 no later than 2025.
o PacifiCorp continues to monitor remediation risks and will follow rules
consistent with State and Federal regulatory requirements.
* Submitted on behalf of Western Resource Advocates, Utah Clean Energy, Powder River Basin
Resource Council, Renewable Northwest, and the Sierra Club.
68Wrap-Up/Additional Information 69
Additional Information
     • 2023 IRP Upcoming Public Input Meetings:
         • January 13-14, 2023 (Thursday-Friday)
         • February 23-24, 2023 (Thursday-Friday)
     • Public Input Meeting and Workshop Presentation and Materials:
         • pacificorp.com/energy/integrated-resource-plan/public-input-process

     • 2023 IRP Stakeholder Feedback Forms:
         • pacificorp.com/energy/integrated-resource-plan/comments

     • IRP Email / Distribution List Contact Information:
         • IRP@PacifiCorp.com

     • IRP Support and Studies:
         • pacificorp.com/energy/integrated-resource-plan/support

70
You can also read