30th June 2021 - Fincantieri
←
→
Page content transcription
If your browser does not render page correctly, please read the page content below

FINCANTIERI
I TA L I A N S U S TA I N A B I L I T Y W E E K 2 0 2 1
B O R S A I TA L I A N A
30th June 2021
www.fincantieri.com

Safe Harbor Statement

This Presentation contains certain forward-looking statements. Forward-looking statements concern future circumstances and results and other statements that are not historical facts,
sometimes identified by the words "believes," "expects," "predicts," "intends," "projects," "plans," "estimates," "aims," "foresees," "anticipates," "targets," and similar expressions. The
forward-looking statements contained in this Presentation, including assumptions, opinions and views of the Company or cited from third party sources, are solely opinions and forecasts
reflecting current views with respect to future events and plans, estimates, projections and expectations which are uncertain and subject to risks. Market data used in this Presentation not
attributed to a specific source are estimates of the Company and have not been independently verified. These statements are based on certain assumptions that, although reasonable at
this time, may prove to be erroneous. By their nature, forward-looking statements involve a number of risks, uncertainties and assumptions that could cause actual results or events to
differ materially from those expressed or implied by the forward-looking statements. If certain risks and uncertainties materialize, or if certain underlying assumptions prove incorrect,
Fincantieri may not be able to achieve its financial targets and strategic objectives. A multitude of factors which are in some cases beyond the Company’s control can cause actual events
to differ significantly from any anticipated development. Forward-looking statements contained in this Presentation regarding past trends or activities should not be taken as a
representation that such trends or activities will continue in the future. No one undertakes any obligation to update or revise any forward-looking statements, whether as a result of new
information, future events or otherwise. Market data used in this Presentation not attributed to a specific source are estimates of the Company and have not been independently verified.
Forward-looking statements speak only as of the date of this Presentation and are subject to change without notice. No representations or warranties, express or implied, are given as to
the achievement or reasonableness of, and no reliance should be placed on, any forward-looking statements, including (but not limited to) any projections, estimates, forecasts or targets
contained herein.
Fincantieri does not undertake to provide any additional information or to remedy any omissions in or from this Presentation. Fincantieri does not intend, and does not assume any
obligation, to update industry information or forward-looking statements set forth in this Presentation. This presentation does not constitute a recommendation regarding the securities of
the Company.

Declaration of the Manager responsible for preparing financial reports
The executive in charge of preparing the corporate accounting documents at Fincantieri, Felice Bonavolontà, declares that the accounting information contained herein correspond to
document results, books and accounting records.

                                                                                                                                                                                                2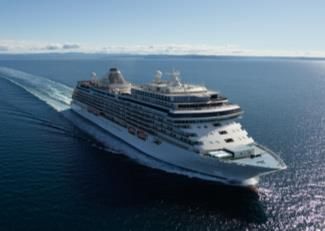
Table of Contents

  SECTION 1          SECTION 2          SECTION 3                    SECTION 4

DESCRIPTION         FINANCIAL                                      S T R AT E G Y
OF THE GROUP        OVERVIEW          S U S TA I N A B I L I T Y   & OUTLOOK

                                 APPENDIX
SECTION 1

DESCRIPTION
OF THE GROUP
Fincantieri at a glance
 We are an Italian Group with a global footprint

           49% of our employees are based in Italy and 87% of revenues come from international clients(1)

                                                                                                                                                                                                                             • ~ € 5.9 bn Revenues in FY2020,
                                                                                                                                                                                                         OUR                   87% of which come from
                                                                                                                                                                                                         FIGURES               international clients

                                                                                                                                                                                                                             • € 34.4 bn Total Backlog(2,3)

                                                                                                                                                                                                                             • 18 shipyards in 4 continents
                                                                                                                                                                                                         OUR
                                                                                                                                                                                                                             • >20,000 employees, 49% of
                                                                                                                                                                                                         GLOBAL
                                                                                                                                                                                                         REACH                 which are based in Italy
                                                                                                                                                                                                                             • ~ 90,000 including subcontractors

                                                                                                                                                                                                         OUR                 • 4.5x Economic multiplier(4)
                                                                                                                                                                                                         IMPACT
                                                                                                                                                                                                                             • 5.9x Employment multiplier(5)

                                         Shipyard - Shipbuilding       Shipyard - Offshore & Specialized Vessels

                     #1 Western designer & shipbuilder(6) with 230 years of history and over 7,000 ships built
(1)   At December 31, 2020
(2)   At March 31, 2021
(3)   Sum of backlog and soft backlog; soft backlog represents the value of existing contract options and letters of intent as well as contracts in advanced negotiation, none of which yet reflected in the order backlog
(4)   Value generated for each euro invested in shipbuilding according to the CENSIS "5th Report on the Economy of the Sea" (2015)
(5)   Fincantieri valuation according to Censis methodology based on Italian operations
(6)   By revenues, excluding naval contractors in the captive military segment. Based on Fincantieri estimates of shipbuilders’ revenues in 2016                                                                                                                   5
Products, clients and backlog
One of the most diversified product portfolio in the world combined with a wide client base and a strong backlog
Main products Key clients Revenues 2020(1) Backlog(2)
(4) (5)
Cruise • All cruise ships:
Luxury/Niche(3) €3,281 m
Upper Premium
Premium 50.1%
Contemporary
Naval € 24,695 m
Shipbuilding Italian Navy and Qatar Emiri
Coast Guard
US Navy
Naval Forces (75 ships)
• All surface vessels (also stealth) €1,938 m
• Support & Special vessels
• Submarines United Arab Algerian Indian 29.6%
Emirates Navy Navy Navy
• Similar businesses to our core ones where we operate opportunistically (e.g. Mega
Other Yachts, Ferries…) €7 m 0.1%
• OSV
Offshore & • Fishery
• Ferries €389 m € 970 m
Specialized • Offshore wind
Vessels • OPV 5.9% (23 ships)
• Special vessels
• Marine systems, components & turnkey Italian Navy and
Coast Guard
Equipment, solutions
• Ship interiors €937 m
Systems • Naval services United Arab US Navy € 1,822 m
& Services • Ship repairs & conversion
Emirates Navy 14.3%
• Infrastructures Qatar Emiri
Naval Forces
(1) At December 31, 2020, before eliminations and consolidation adjustments
(2) At March 31, 2021
(3) Terminology used in the cruise sector to indicate smaller, more intimate cruises with fewer guests dedicated to more exploratory destinations (e.g. Alaska or polar regions)
(4) Parent company of several brands, among which our clients are: Carnival Cruise Lines, Costa Crociere, Cunard, Holland America Line, P&O Cruises, Princess Cruise Lines and Seabourn Cruise Lines
(5) Parent company of several brands: Norwegian Cruise Line, Oceania Cruises, Regent Seven Seas Cruises
6Markets and positioning
Leadership in high-potential reference markets and solid track record
End markets Market Trend Main Drivers Track Record
Cruise
• A successful rollout of vaccination campaigns
will be key to industry recovery • World leader in the design and construction of
• Significant impact of COVID-19, affecting • Expected pent-up demand when operations vessels for all segments of the cruise industry
Cruise operators’ liquidity and operations are resumed • 102 ships delivered from 1990 to 2020
• Disposal of older vessels
• Environmental regulations
Shipbuilding
Naval • Stable high margin business in the low
double-digit range
• Focus on accessible markets • Defence budgets for accessible markets • 128(2) ships delivered from 1990 to 2020
• Large programs under development (Italian • Global geopolitical situation
Navy fleet renewal program, LCS program, • Naval fleet renewals • 1 vessel delivered in Q1 2021
Qatari Navy program, US Navy FFG-62(1)
program)
• O&G sector crisis and postponements • Oil price and E&P investments
Offshore & of E&P projects caused a slowdown in related •
equipment industry (PSV, AHTS)
Demand of special purpose vessels for marine • 422(3) ships delivered from 1990 to 2020
Specialized infrastructure and exploitation of marine
• Segment diversification strategy (Wind resources
Vessels Offshore, Fishery, Aquaculture, OPV, Special • 1 vessel delivered in Q1 2021
• Demand for renewable energies
vessels, Renewable energies)
• High potential and high margin business • Shipbuilding programs ongoing
Equipment, • Result of the insourcing of strategic • Fleet ageing and development of new
technologies • Strong revenue growth to € 937 m
Systems activities • Development of national critical infrastructure
• A minor, but growing, share of the total in 2020
& Services company’s turnover
programs
(1) Former FFG(X) program
(2) Includes other products delivered by Naval business unit. Includes US subsidiaries pre Fincantieri acquisition, excluding 174 RB-M delivered since 2002
(3) Includes other products delivered by Offshore & Specialized Vessels business unit. Includes VARD and predecessor companies
7Key competitive strengths
Consolidated leadership, high diversification and flexible global production network
1. 2.
Consolidated leadership in diversified High diversification in terms of end
markets and sizeable backlog market, geography and client portfolio
• Leader in cruise market and in naval segment • Focus on high complexity and high value-added
segments
• Cruise visibility influenced by Covid-19 impacts
• Most diversified shipbuilder with a broad range
• Sizable order book and total backlog(1)
of clients with both long-term relationships and
amounting to approximatively 6.6 years of work
strategy of extending its customer base
if compared to 2020 revenues
4. 3.
Technological leadership Flexible and global production network
• High innovation capacity and system integrator • Integrated production model to control entire
capabilities (coordination of whole product production process and aftermarket
lifecycle as prime contractor), with ~ 100
• Flexible and global integrated network of 18
prototypes delivered in the last 15 years
shipyards and more than 20,000 employees
• Strong commitment to R&D and proven track located in both emerging and Western countries
record of on-time and on-budget deliveries, with
expenditure ~ € 700 m for the period 2015-2020
(1) At March 31, 2021
8Ownership and Group structure
A listed company with strong reference shareholders
Simplified ownership and Group structure
Italian Ministry Italian Banking
Treasury Shares
of Economy and Finance Foundations
• Fincantieri shares are listed on the Milan Stock Exchange since July 3, 2014
82.77% 15.93% 1.30%
• Fincantieri’s reference shareholder is CDP Industria S.p.A., a holding company fully
owned by CDP, owning 71.32% stake Cassa Depositi e Prestiti
S.p.A. (“CDP”)
• CDP is an Italian state-owned National Development Institution holding major
stakes in several listed / non listed strategic Italian companies like ENI, Snam, 100.00%
Terna, Sace, Saipem and Poste Italiane
Free float CDP Industria S.p.A. Treasury shares
• Fincantieri S.p.A. is the Holding company of the Group
28.41% 71.32% 0.27%
• Fincantieri Marine Group (“FMG”) is the US subsidiary controlling the three American
yards (among them, Marinette Marine participated by Lockheed Martin with a minority
Fincantieri S.p.A.
stake) (Italy)
• Vard Holdings Limited is the holding company for the VARD Group, delisted from the
100.00% 98.33%(1)
Singapore Stock Exchange in 2018
Fincantieri Marine Group Vard Holdings Limited
(USA) (Singapore)
(1) Ownership as of February 2021
9SECTION 2 FINANCIAL OVERVIEW
Executive summary
Year-end guidance confirmed, increased revenues and profitability in 1Q 2021
Year-end targets confirmed
Guidance for 2021 confirmed: revenues excluding pass-through activities +25%-30%, EBITDA margin at 7%, and net financial position flat YoY. First
quarter performance confirms the targets outlined for year-end
Total backlog at € 34.4 bn including order intake at €0.3 bn: backlog at €26.5 bn (98 units) and soft backlog at €7.9 bn
Two units delivered during the quarter: LSS «Vulcano» to the Italian Navy and expedition cruise vessel «Coral Geographer» to Coral Expeditions
Strong top-line and solid profitability
Revenues excluding pass-through activities up 9.1% YoY
Revenues (€ mln) EBITDA (€ mln) Net debt (€ mln) confirming the growth trend outlined in the previous quarter
1.648 1.617 EBITDA margin at 7.0% improving consistently with year-end
1.307 1.426(1)
5.5% 6.1% 7.0%
(1)
1.062 target thanks to higher production volumes and sound execution
Net debt increase owing to a delivery schedule concentrated in
101 101
3Q - expected to reverse from 3Q
72
COVID-19 related extraordinary costs at €14 mln
1Q 2020 1Q 2021 1Q 2021 1Q 2020 1Q 2021 1Q 2021 FY 2020 1Q 2021
(1) Excluding pass-through activities
11Business update
Leveraging our core competencies, while expanding our strategic capabilities…
Delivery schedule carried on as expected
CRUISE Viking Venus, the first out of five cruise ships to be delivered from Italian shipyards this year, was successfully
handed over to Viking on April 15th in Ancona
Fincantieri to officially partake in the Sea Defence Project, aimed at providing technologies to be included in the next
generation of naval platforms and pursued in further European development programmes
DEFENCE
A Memorandum of Understanding was signed between JV Naviris and Navantia for an international industrial cooperation
to develop the European Patrol Corvette, and falling within the PESCO European Program(1)
VARD to design a cable repair vessel for Orange Marine, specifically developed for the maintenance of submarine cables
OFFSHORE & with special attention to sea-keeping capabilities, maneuverability and low fuel consumption
S PECIALIZED
VESSELS VARD to design and construct 3 Service Operation Vessels for North Star Renewables: the units will be delivered in 2023
from VARD Vung Tau and will be deployed in the Dogger Bank Wind Farm
(1) Permanent Structured Cooperation
12Business update
…and gearing up to become a key player within the missions set by the Recovery Plan
D I G I TAL Cloud computing: A cooperation agreement was signed with Amazon Web Services to accelerate digital innovation and
T R A N S F O R M AT I O N technological development at national level, with special focus on cloud computing to provide technological and infrastructural
A N D I N N O VAT I O N solutions to institutions, large companies, SMEs, and startups
Connected vehicles and smart roads: an agreement was signed with Almaviva to support and enhance the digitalisation
process in the transportation and logistics sector
G REEN Innovative projects for reducing emissions: a Memorandum of Understanding was signed with Arcelor Mittal and Paul
REVOLUTION AND Wurth to consider drawing up a reconversion plan for the existing integrated cycle of the AMI steel-making plant in Taranto,
ECOLOGICAL using eco-friendly technologies
TRANSITION Hydrogen. The first Zero Emission Ultimate Ship will be completed in 2021: it is an experimental fuel cell powered marine
vessel testifying our commitment to developing alternative sustainable propulsion systems
I NFRASTRUCTURES
Cold ironing: a letter of intent was signed with Enel X to collaborate on building and running next-generation port
F O R A S U S TAI N AB L E
infrastructure with a low environmental impact and developing electricity-powered solutions for ground logistics services
MOBILITY
13Backlog deployment
Fully preserved order backlog with visibility stretching up to 2029 in Naval
Shipbuilding Offshore & Specialized Vessels
# ship deliveries # ship deliveries
CRUISE 2021 7 NAVAL 2021 1 7 8 2021 1 3 4
2022 8 2022 9 2022 11
2023 9 2023 5 2023 5 3 8
2024 5 2024 6 2024 1
2025 5 2025 5
2026 3 2026 2
After 1 After 3
Cruise: 38 vessels in backlog Delivered in 1Q 2021 Naval: 37 vessels in backlog(1) Delivered in 1Q 2021(2) New orders in 1Q 2021
Offshore & Specialized Vessels: 23 vessels in backlog (3)
Visibility up to 2027 Visibility up to 2029 Wind offshore gaining traction
2 units delivered, 3 new orders, and 98 ships in backlog
(1) Articulated Tug Barge (ATB) is an articulated unit consisting of a barge and a tug, thus being counted as two vessels in one unit
(2) For reasons connected to the organizational responsibility of VARD yards split between Cruise and Offshore, one cruise vessel (for Coral Expeditions) delivered in Q1 2021 is included in the Offshore & Specialized Vessels deliveries
(3) Offshore & Specialized Vessels business generally has shorter production times and, as a consequence, shorter backlog and quicker order turnaround than Cruise and Naval
14Order intake and backlog
Order intake is still limited but long-term visibility is confirmed
Order intake breakdown by segment Total backlog breakdown by segment(1)
€ mln € mln 5.5x 6.1x 6.6x
0.2x 0.2x 4.7x 4.7x 5.1x
35.681
34.436 Limited order intake in
31.878 Shipbuilding with a wait-and-see
7.900 7.900 attitude on the restart of cruise
4.200 operations
2.008 1.839
1.822
813 874 3 Service Operation Vessels
970
acquired in the Wind Offshore
segment
Backlog Backlog Backlog
27,781 Total backlog at €34.4,
339 27,678 25.857 26.088 26,536 24.695
294 approximately 6.6x 2020 revenues
157 148
116 145
83 101
(62) (55) (1.000) (1.020) (951)
1Q 2020 1Q 2021 1Q 2020 FY 2020 1Q 2021
Total backlog /
Book-to-bill(2) Revenues(3)
Backlog / Revenues(3)
Shipbuilding Offshore & Specialized Vessels Equipment, Systems & Services Eliminations Soft backlog(4)
(1) Total backlog is the sum of backlog and soft backlog
(2) Order intake/revenues excluding pass-through activities
(3) Excluding pass-through activities
(4) Soft backlog represents the value of existing contract options and letters of intent as well as contracts in advanced negotiation, none of which yet reflected in the order backlog
15Revenues
Top-line growth on the right track: full swing of production programmes driving revenues up 9.1% YoY
Revenues breakdown by segment(1)
€ mln
1.648
232 1.426
1.307 Revenues excluding pass-through activities up
96 232
205 96 9.1% YoY thanks to resumption of operations
126 574 and full swing of production programmes
352
303
1.500 Shipbuilding up 12.8% YoY excluding
1.133 1.278
830 926 926 pass-through activities
(157) (180) (180) Offshore & Specialized Vessels down
23.5% due to (i) disposal of Brevik shipyard
1Q 2020 1Q 2021 1Q 2021 –
ex pass-through activities (ii) effects of market repositioning on
higher-value added segments still to
unwind
% of Total revenues 14,0% 12,7% 14,4%
8,6% 5,2% 6,0% Equipment, Systems & Services: up
13.4%
20,7% 56,7% 50,7% 21,9% 57,7%
31,4%
Shipbuilding Offshore & Specialized Vessels Equipment, Systems & Services Other activities and Eliminations
Cruise Naval
(1) Breakdown calculated before eliminations
16EBITDA
Operating profitability at 7.0% is in line with 4Q 2020 performance and 2021 guidance
EBITDA breakdown by segment(1)
€ mln
Significantly improved profitability on
track with previous quarter positive
5.5% 6.1% 7.0% performance and guidance for 2021
Shipbuilding up 39% YoY with
101 101 margin at 7.8% confirming good
4.5% 10 4.5% 10 backlog profitability
72 1.6% 2 1.6% 2
6.0% 12 Offshore & Specialized Vessels up
6.7% 100 7.8% 100 to € 2 mln from negative €1 mln as a
6.3% 72 result of the successful turnaround
strategy implemented in 2019 and
-0.8% (1) market repositioning
(11) (11) (11)
Equipment, Systems & Services
1Q 2020 1Q 2021 1Q 2021 –
ex pass-through activities down 16.7% YoY due to lower
profitability in Ship Repair and
Conversion
EBITDA Margin as % of total revenues
Shipbuilding Offshore & Specialized Vessels Equipment, Systems & Services Other activities and Eliminations
(1) EBITDA is a Non-GAAP Financial Measure. The Company defines EBITDA as profit/(loss) for the period before (i) income taxes, (ii) share of profit/(loss) from equity investments, (iii) income/expense from investments, (iv) finance
costs, (v) finance income, (vi) depreciation and amortization (vii) expenses for corporate restructuring, (viii) accruals to provision and cost of legal services for asbestos claims, (ix) other non recurring items
17Net working capital and net financial position
NWC and net debt increase are consistent with the delivery schedule: deleveraging expected by year-end
Net Working Capital breakdown by component Net Financial Position
€ mln € mln
904
881
2.775
1.963
602 580
111 51 Net debt mirrors net working capital
(1.325) (1.506) (1.062) dynamics driven by a concentrated
(1.617) delivery schedule
(2.361) Deleveraging starting from 3Q
(2.403)
(73)
(73)
FY 2020 1Q 2021 FY 2020 1Q 2021
NWC(1) (202) 328 NFP(1) (1,062) (1,617)
Inventories and advances Work in progress net NFP
to suppliers of advances from customers
Trade receivables Other current assets and liabilities
Construction loans Trade payables
Provisions for risks & charges
(1) Construction loans are committed working capital financing facilities, treated as part of Net working capital, not in Net debt, as they are not general purpose loans and can be a source of financing only in connection with ship contracts
18SECTION 3 SUSTAINABILITY
Cruising to sustainability: a long term commitment that is driving our business
Our attention to sustainability is rooted at the very core of our business – however, in the last 5 years we formalized our commitment
with a fast-paced governance evolution
2016 • Fincantieri's Board of Directors establishes the Sustainability Committee
2017 • Fincantieri's Risk Officer integrates the Company risk model with additional risks concerning ESG topics
• Fincantieri's Board of Directors approves:
the Charter of Sustainability Commitments with the aim of contributing to a healthy, resilient, and sustainable community
2018 the first Sustainability Report
the 2019-2021 Performance Share Plan, that includes a new specific sustainability target
the first Sustainability Plan, highlighting and bolstering the will of the Group to be responsible towards all stakeholders
2019 • Fincantieri has joined the United Nations Global Compact, the world's largest corporate sustainability initiative
• In July, as the Group was particularly affected by the global health emergency caused by COVID-19 outbreak, the 2018-2022
Sustainability Plan was updated
2020 • A Sustainability survey was carried out, involving over 7,000 internal and external stakeholders. Such a large engagement allowed the
Group to update its materiality matrix
20Plan ahead: in 2018 the BoD approved the first Group Sustainability Plan
45 Objectives
Environmental
24 Commitments
Social
15 Material topics
Governance
4 Pillars of the Business Plan
21Focus on our Environmental strategy and main commitments
COMMITMENTS TO REDUCE COMMITMENTS TO REDUCE
TARGET TARGET
IMPACT ON THE ENVIRONMENT IMPACT ON OUR PROUCTS
• Tackling climate change through the 50% reduction of Scope 2 GHG • Development of ecologically Develop technologies to
reduction of carbon dioxide (CO2) emissions by 2022 (versus 2017) sustainable products and services increase energy savings in
and other pollutant emissions Increase the percentage of contributing to a circular and low ships with equal features
• Projects to improve energy electricity from renewable sources carbon economy (green ships), along with:
Environmental efficiency and preserve natural (100% in Italy and Romania by
- 30% increase in ship efficiency by
2030
resources, protect biodiversity and 2020) - Eliminate ship emissions in ports
reduce environmental impact to Consolidation of the share of waste
and halve navigation emissions by
prevent soil, air, and water pollution 2030
to be recycled between 80% and
• Conservation of natural resources, 90% in Italy by 2020 Definition of an eco-design
biodiversity, and reduction of system to promote the
ISO 50001 – Energy Management development of
environmental impact System certification for the Italian environmentally sustainable
• Support research to improve shipyards by 2021 ships by 2020
Social analysis and management of risks Conduct a climate change scenario
associated with climate change analysis by 2021
• Promotion of 5 research projects to
develop new solutions for energy
savings or reduction of emissions in
collaboration with research institutes
/ universities on issues associated
with climate risks by 2030
Governance • Promote studies and initiatives on
the circular economy by 2025
Target achieved
Target in progress 22Environmental KPIs
GHG emissions Renewable electricity
Scope 1 Scope 2 Scope 3
96,610 tCO2e
from non-renewable sources
2019 665,098 tCO2e 16%
72,925 tCO2e
79,875 tCO2e
2020 494,571 tCO2e
84% from renewable sources
19,995 tCO2e Total electricity 2020
100% in Italian, Romanian
Total GHG emissions 2020 1,208,086 GJ and Norwegian sites
594,441 tCO2e -6% vs 2019
-17% -73% -26%
-29% vs 2019
Scope 1: Direct emissions from sources owned by or under the control of the Group
Scope 2: Indirect emissions from electricity consumption
Scope 3: Other indirect emissions from: raw materials, raw material procurement chain, employee mobility, water consumption and waste
production
Waste Eco-design initiatives
8 new environmentally friendly initiatives for the Merchant Shipping Division
86%
79%
Recovery
Recovery
in 2020
+9% 10 new initiatives for the Naval Shipping Division
in 2019
23Focus on our main social commitments
COMMITMENTS TO OUR COMMITMENTS TO OUR
TARGET TARGET
EMPLOYEES CLIENTS
• Promotion of growth, training, and Keep the percentage of hires of under-35s • Listen to needs and Develop a Customer
enhancement of human capital above 40% of all new hires per year in Italy expectations to maximize Satisfaction Index (CSI)
• Promotion of programs offering equal by 2022 customer satisfaction plan by 2020
opportunities to all employees in Conduct a gender pay equality survey for • Continuous improvement of Increase product health
Environmental order to promote diversity and Fincantieri S.p.A. by 2021 quality and safety of products and safety with the
inclusion within the Group Structure the remote working tool in and services in compliance with definition of a list of actions
• Increase the wellbeing of our people general and as a support to special needs technical standards, in all to be carried out to reduce
through innovative solutions by 2021 phases of the production health risk on board ships
process to meet the high by 2021
• Continuous improvement of workers’ ISO 45001 Health and Safety at Work standards required by the
health and safety conditions Management System certification in the business
Italian sites by 2020
Improvement of health and safety at work
Social with 15% reduction of severity index1 and
5% reduction of frequency rate2 compared
to 2017 in Italy by 2022
Define an action plan to increase employee
awareness of diversity and inclusion for
Fincantieri S.p.A. by 2021
COMMITMENTS TO THE
TARGET
COMMUNITIES
Governance Collaboration with governments, Enter into agreements with food associations, on the basis of the local requests, redirecting food surplus from
national and international Fincantieri canteens by 2020
associations to adopt policies and
strategies to contribute to a healthy,
inclusive, resilient and sustainable
society for everyone
Target achieved
(1) no. of days lost due to injury / hours worked x 1,000
Target in progress (2) no. of injuries / hours worked x 1,000,000
24Social KPIs
Diversity and equal opportunity Health & safety
Total employees % employee - women Severity index Injury rate/frequency rate
2019 19,823 2019 13% 2019 0,21 2019 10.9
+2% +10% -18%
2020 20,150 2020 14% 2020 0,23 2020 9.0
no. of days lost due to injury / hours worked x 1,000 no. of injuries / hours worked x 1,000,000
Health & safety costs
685
employees € 14.1 mln
hired of which in 2020
€ 5.9 mln
in Italy 59% in 2019
under35s
Community Investments In 2020, all the Italian sites completed the migration process to
the new ISO 45001 standard, which defines the requirements
for certifying the Health and Safety at Work
Management System
€ 4.8 mln
€ 2.4 mln in 2020
in 2019
25Focus on the COVID-19 emergency
CLIENTS
EMPLOYEES
Fully preserved backlog
Extraordinary safety measures including an
Emergency steering committee, prompt No order cancellations and redefinition of delivery schedule
suspension of operations and social thanks to constant dialogue with shipowners
distancing
Innovative Air sanitation system. MSC Seashore will be the first
Rapid tests carried out in Italian yards on cruise ship equipped with such innovative system, preventing the
employees, network of suppliers and communities MANAGING THE circulation of atmospheric pollutants on board
Internal vaccination campaign aimed at
COVID-19
employees and suppliers EMERGENCY
Less than 4% infection rate in Italian yards COMMUNITIES
Over 1,600 employees working remotely Donations to the Civil Protection and to health facilities in the territories
where the Company is present
Over 70,000 PPE distributed daily
Donations to the Caritas Italiana and to the Genoa Archdiocese to
support people and families with no economic support
91% satisfaction rate on the management of
the emergency Reverse factoring agreements to facilitate access to credit for suppliers
26Focus on our main Governance topics
OUR COMMITMENTS TO
OUR COMMITMENTS TO
GOVERNANCE AND BUSINESS TARGET TARGET
SUSTAINABLE SUPPLY CHAIN
ETHICS
• Promotion of a sustainability • Over 15% of the addressable • Promotion and support of a • Organize workshops
culture in line with the Group’s workforce has sustainability targets in responsible supply chain that involving a panel of at least
Values, encouraging managers to its variable remuneration shares our values and is based 40 suppliers out of 200
Environmental think sustainably within their sphere • ISO 37001 Anti-Corruption on long-lasting relationships considered strategic to share
of action Management System certification for founded on integrity, a path of sustainability,
• Adoption of pre-emptive measures Fincantieri S.p.A. by 2020 transparency and respect training and discussion on
and policies geared towards the • Commitment to creating the ESG issues by 2020
• Definition of the Group’s tax strategy
prevention of corruption in all by 2021 socio-economic conditions to • Launch of the Sustainable
spheres of influence ensure respect for human rights Supply Chain project for
throughout the value chain Fincantieri S.p.A. by 2021
• Conduct annual audits to
assess and monitor the most
Social critical suppliers in terms of
human rights, health and
safety and environment by
2023
OUR COMMITMENTS TO
TARGET
INNOVATION
Investments in research and Keep a spending budget in R&D (costs and investments) for Fincantieri S.p.A. above € 90 mln/year (of which
innovation to develop sustainable, 60% in clean technologies) by 2020
Governance efficient, safe and competitive products Development of intelligent ships and platforms (smart ships / smart offshore infrastructure) and autonomous
and processes with particular reference ships. Development of innovative solutions for yards (smart yards) by 2030
to the technologies needed to reduce
their environmental impact and increase
their digitalization
Target achieved
Target in progress 27Governance KPIs
Variable remuneration Research & Innovation
of MBO Plan recipients
23.2% received at least one
sustainability target
5 PILLARS
Anticorruption OF
RESEARCH
AND
In 2020 Fincantieri S.p.A. obtained ISO 37001 certification for
its anticorruption management systems INNOVATION
Sustainable supply chain
Workshop on sustainability issues Sustainability audits
€ 144 MLN RESEARCH AND OVER 100 RESEARCH AND
DEVELOPMENT COSTS INNOVATION PROJECTS
54 6 OVER 65% OF R&D BUDGET IN 34% OF REVENUES GENERATED
strategic suppliers sustainability
involved audits ON HUMAN RIGHTS, CLEAN TECHNOLOGIES FOR BY CRUISE SHIPS EQUIPPED WITH
ENVIRONMENT, HEALTH FINCANTIERI S.P.A. GREEN TECHNOLOGIES
AND SAFETY ASPECTS*
*The decrease in audits compared to the previous year (35 audits in 2019) is due to the COVID-19 pandemic and the resulting travel restrictions, preventing staff from going to supplier premises.
28Our commitment to sustainability is internationally recognized
RATINGS
2016: Fincantieri joined the CDP, addressing the challenges of climate change and limiting its impact through eco-sustainable behaviour.
CDP provides investors with information on environmental strategies and performances of companies in which they invest or intend to invest.
In 2020 Fincantieri achieved an A- score (B in 2019) and also achieved a Leader score (A) in the Supplier Engagement Rating survey(1).
V.E. is a leading agency in assessing the integration of Social, Environmental and Governance factors into business strategies, with a focus
on performance and sustainable value creation.
In 2020, Fincantieri achieved a score of 68/100, holding its position in the "Advanced" range and it was ranked first among its peers in the
Mechanical Components & Equipment sector.
Gaïa Rating, a French sustainability rating agency, part of EthiFinance, assigned to Fincantieri the overall score of 85 points out of 100,
ranking it 2nd out of the 512 companies evaluated.
AWARDS
2020 EDITION OF THE OSCAR DI NATIONAL AND GLOBAL SECTION OF GREEN STAR 2021 AWARD by the
BILANCIO, the award organised by Ferpi(2) THE MIKE AWARD (Most Innovative German Institute of Quality in collaboration
and promoted together with Borsa Italiana and Knowledge Enterprise), singling out the best with the Institute of Management and
Bocconi University practices that allow for the transformation of Economic Research of Hamburg. Fincantieri is
corporate knowledge into innovation now one of Italy's 200 Green Stars, ranked
first in the "Engineering, Construction and
Infrastructure" sector
(1) Rating related to the engagement of the supply chain on sustainability and climate change topics
(2) Federazione Relazioni Pubbliche Italiana (Italian Public Relations Federation)
29SECTION 4 STRATEGY & OUTLOOK
2021 Company outlook
In the US, the CDC may reportedly be open to lift or modify the Conditional Sailing Order - in Europe cruise operations are about to be resumed
starting from late spring/early summer
Strong 2022 booking volumes for cruises are ahead of pre COVID-19 levels and are driven by pent-up demand
Operations to run at full swing with a production ramp-up expected to bridge the gap experienced in 2020
Long-term growth and profitability are ensured by a fully preserved order portfolio in Cruise and a highly diversified backlog
Sound revenue growth expected to accelerate in the remaining part of the year
Increase in net financial position (owing to a delivery schedule concentrated in 3Q) expected to rapidly reverse in the second half of 2021
Confirmed guidance on year-end:
Revenues excluding pass-through activities will be up 25%-30% and EBITDA margin is expected at ~7.0%
Net financial position is expected to come in broadly in line with 2020
31APPENDIX
Overview of financial performance indicators(1)

  € mln                                                                                                                                                    FY 2017(2)                                 FY 2018(2)                                 FY 2019(2)            FY 2020
Order intake                                                                                                                                                        8,554                                      8,617                                       8,692          4,526
Total backlog                                                                                                                                                      26,153                                     33,824                                      32,690         35,681
     Of which backlog                                                                                                                                              22,053                                     25,524                                      28,590         27,781
     Of which soft backlog                                                                                                                                          4,100                                      8,300                                       4,100          7,900

Revenues                                                                                                                                                             5,020                                      5,416                                         5,849       5,879
EBITDA                                                                                                                                                                 341                                        421                                           320         314
     As a % of revenues                                                                                                                                              6.8%                                       7.8%                                          5.5%        5.3%
EBIT                                                                                                                                                                   221                                        285                                           153         148
     As a % of revenues                                                                                                                                              4.4%                                       5.3%                                          2.6%        2.5%
Adjusted profit/loss(3)                                                                                                                                                 91                                        114                                           (71)        (42)
     Attributable to Group                                                                                                                                              95                                        117                                           (64)        (37)
Net result for the period                                                                                                                                               53                                         69                                         (148)       (245)
     Attributable to Group                                                                                                                                              57                                         72                                         (141)       (240)

Net fixed assets                                                                                                                                                     1,743                                      1,703                                         1,905        2,035
Net working        capital(4)                                                                                                                                        (120)                                         44                                         (125)        (202)
     Of which construction loans                                                                                                                                     (624)                                      (632)                                         (811)      (1,325)
Equity                                                                                                                                                               1,309                                      1,253                                         1,050          777
Net financial position Net cash/ (Net debt)                                                                                                                          (314)                                      (494)                                         (736)      (1,062)

Employees                                                                                                                                                          19,545                                     19,274                                      19,823         20,150
(1) With the aim to provide a meaningful index to measure the Group financial results, the Group adopts an EBITDA definition which normalizes the trend of results over time, and increases the level of comparability of the same results by excluding the
    impact of non recurring and extraordinary operating items; for the same reason, the Group also monitors Net Income before non recurring and extraordinary items (both operating and financials)
(2) Comparative figures in 2017, 2018, and 2019 are shown restated
(3) Excluding extraordinary and Non Recurring Items net of tax effect
(4) Construction loans are accounted for in Net working capital, not Net financial position, as they are not general purpose loans and can be a source of financing only in connection with ship contracts

                                                                                                                                                                                                                                                                                   33
Financial performance: Historical revenues
Revenues breakdown by segment(1)
€ mln 5.879
5.849
5.416
937
5.020 899
651
327 389
558 11 7
623
676 18
22 1.503
1.938
1.434
1.212
5.145 5.226
4.678
4.267
3.631
3.033 3.226 3.281
(481) (536) (522) (673)
FY 2017(2) FY 2018(2) FY 2019(2) FY 2020
Shipbuilding Offshore & Specialized vessels Equipment, Systems & Services Eliminations Cruise Naval Other Shipbuilding
(1) Breakdown calculated gross of consolidation effects
(2) Comparative numbers of 2017, 2018, and 2019 are shown restated
34Financial performance: EBITDA
EBITDA breakdown by segment(1)/margin(2)
€ mln
6.8% 7.8% 5.5% 5.3%
421 320
11.2% 73
341 10.0% 90
314
11.5% 64
8.1% 76
6.1% 41
8.5% 395 7.2% 368
6.3% 5.4% 285
270
(34) -2.1% (13) -1.3% (5)
(34) -30.4% (42)
(99)
(39)
FY 2017(3) FY 2018(3) FY 2019(3) FY 2020
Shipbuilding Offshore & Specialized vessels Equipment, Systems & Services Eliminations
(1) Breakdown calculated gross of consolidation effects
(2) EBITDA is a Non-GAAP Financial Measure. The Company defines EBITDA as profit/(loss) for the period before (i) income taxes, (ii) share of profit/(loss) from equity investments, (iii) income/expense from investments, (iv) finance costs, (v) finance
income, (vi) depreciation and amortization, (vii) extraordinary wages guarantee fund – Cassa Integrazione Guadagni Straordinaria, (viii) expenses for corporate restructuring and other non-recurring personnel costs, (ix) accruals to provision and cost of
legal services for asbestos claims, (x) other non recurring items. EBITDA breakdown are referred only to operating segments
(3) Comparative numbers of 2017, 2018, and 2019 are shown restated
35Financial performance: historical EBIT and Net result
EBIT / margin Net result before extraordinary and non recurring items(1)
€ mln € mln 114
91
4.4% 5.3% 2.6% 2.5% 117
95
(4) (3) (37)
(64) (5)
(7) (42)
(71)
FY 2017 FY 2018 FY 2019 FY 2020
of which Group of which minority interests
Net result
€ mln
285
221 53 69
153 148 57 72
(4) (3)
(141)
(240)
(7)
(148)
FY 2017 FY 2018 FY 2019 FY 2020 (5)
(245)
FY 2017 FY 2018 FY 2019 FY 2020
of which Group of which minority interests
(1) Extraordinary and non recurring costs net of tax effect amounted to € 37 mln in 2015, € 46 mln in FY 2016, € 38 mln in 2017, €39 mln in 2018, €53 mln in 2019, and €203 mln in 2020
36Capex: historical trend
Capex evolution Capex by segment
€ mln € mln
3.2% 2.9% 4.8% 5.3%
309
309 279 24
279 21 32
30 3
77
61 6
163 161
163 161 13
27 18
55 37 9 7 6 250
232 222
218
124 120 124
108
FY 2017 FY 2018 FY 2019 FY 2020 FY 2017 FY 2018 FY 2019 FY 2020
Property, plant and equipment Intangible assets % of Revenues Shipbuilding Offshore and Specialized Vessels Equipment, Systems & Services Other activities
37You can also read