Large-scale Analysis of Infrastructure-leaking DNS Servers
←
→
Page content transcription
If your browser does not render page correctly, please read the page content below
Large-scale Analysis of
           Infrastructure-leaking DNS Servers

              Dennis Tatang, Carl Schneider, and Thorsten Holz

                        Ruhr University Bochum, Germany
                          firstname.lastname@rub.de

      Abstract. The Domain Name System (DNS) is a fundamental back-
      bone service of the Internet. In practice, this infrastructure often shows
      flaws, which indicate that measuring the DNS is important to under-
      stand potential (security) issues. Several works deal with the DNS and
      present such problems, mitigations, and attack vectors. A so far over-
      looked issue is the fact that DNS servers might answer with information
      about internal network information (e.g., hostnames) to external queries.
      This behavior results in a capability to perform an active network re-
      connaissance without the need for individual vulnerabilities or exploits.
      Analyzing how public DNS services might involuntarily disclose sensitive
      information ties in with the trust we have on Internet services.
      To investigate this phenomenon, we conducted a systematic measure-
      ment study on this topic. We crawl all public reachable DNS servers in
      15 scans over a period of almost six months and analyze up to 574,000
      DNS servers per run that are configured in a way that might lead to this
      kind of information leakage. With this large-scale evaluation, we show
      that the amount of this possible infrastructure leaking DNS servers is on
      average almost 4 percent over all of our scans on every reachable DNS
      servers on the Internet. Based on our newest scan, the countries with
      most of these servers are Romania, China, and the US. In these coun-
      tries, the share of such servers among of all reachable servers is about
      15 % in Romania, 9 % in China, and 2.9 % in the US. A detailed analysis
      of the responses reveals that not all answers provide useful information
      for an adversary. However, we found that up to 158,000 DNS servers
      provide potentially exploitable information in the wild. Hence, this mea-
      surement study demonstrates that the configuration of a DNS server
      should be executed carefully; otherwise, it may be possible to disclose
      too much information.

      Keywords: DNS · Measurement · Information leakage.

1   Introduction

The ubiquitous use of the Domain Name System (DNS) leads to the consequence
that it is in daily use on the Internet by every user to primarily translate domain
names to the corresponding IP addresses. For this reason, it is considered one of
the core Internet protocols, and thus it is worth measuring usage and behavior
2 Tatang et al.
for a better understanding of the DNS ecosystem. Various studies deal with the
DNS, whether attacks targeting the protocol itself, like DNS rebinding or cache
poisoning attacks [23], or abusing it for attacking someone else such as DDoS
attacks [14]. Moreover, several works measuring different aspects of the DNS are
using the DNS data to correlate it to gain new insights into related topics [8].
Further measurement studies, such as censorship activities, on a global scale, are
already covered in recent publications [16].
We noticed an aspect that has not been further investigated so far: DNS
servers that leak information in responses to external queries with internal net-
work information, e.g., active hosts. More precisely, if a request to a hostname
is sent to a wrongly configured server, this DNS server might reply with the
appropriate IP address, and the external client knows that an internal host is
active. For example, a DNS request for local-hostname.lan to such a DNS server
might result in the IP address 192.168.0.1. This behavior can also be abused
to request IP addresses via this DNS server through a reverse DNS request to
obtain the hostname information, e.g., reverse DNS request 192.168.0.2 results
in hostname iPhoneUsername.lan. This issue can occur when a DNS server or-
ganizes domain names for internal IP addresses and public IP addresses at the
same time. This then might lead to unwanted information leaks that might also
reveal sensitive information.
For a potential attacker, this information leakage can be part of an active
infrastructure reconnaissance. The goal of such a reconnaissance attack is to
acquire as much information as possible about a target network, including which
hosts are active in it, which systems are used, and what kind of network it is (e.g.,
company or private). This information can then be used in further, more targeted
steps of an attack. By taking advantage of DNS servers that leak information,
an attacker can learn infrastructure details without the need for any type of
exploit. This raises the question of the widespread nature of this problem on a
global landscape. It is already discussed in some blog posts [2,5], however, it has
not yet been studied in a systematic way.
In this paper, we perform a measurement study on this topic and measure in
a first step how widespread the problem is on an Internet-wide scale with open
DNS resolvers. To this end, we implemented a measuring system that enables
us to request internal IP addresses via reverse DNS (record type PTR). All
answers are then coming from DNS servers which might leak internal network
information. In the next step, we scaled this system so that it uses a list of active
DNS servers of Censys [9] and queried them for the potential information leak.
Lastly, we clustered the answers and enriched them with additional information
such as AS numbers, geolocations, and daemon information.
Our results indicate that up to 574,000 probed DNS servers responded to
external requests to internal IP addresses, which make on average almost 4 per-
cent of all reachable DNS servers in the wild. Most of these servers are located
in Romania, China, and the United States. These servers represent about 15 %
of all servers in Romania, 9 % of all servers in China, and 2.9 % of all servers
based in the US on our most recent scan. Fortunately, a closer analysis showsLarge-scale Analysis of Infrastructure-leaking DNS Servers 3
that a large share of these servers does not reveal useful information that an
attacker can exploit. However, there are still up to 158,000 DNS servers among
all reachable DNS servers that can be used for network reconnaissance and we
study this aspect in more detail. To this end, we use data mining techniques
such as affinity propagation and Levhenstein distance as a metric for group-
ing the collected responses into clusters. We find clusters with patterns such as
.iPhone, .iPad, android-, and
amazon-, which indicate that various types of smartphones, tablets,
and other kinds of consumer devices can be identified. Furthermore, we identify
clusters with patterns that refer to firewalls (firewall.) and
demilitarized zones (.dmz.). This information is useful for at-
tackers because it allows them to identify the location of the firewall in the
network and learn about the fact that a firewall is used in this network at all.
We also discuss potential mitigation options and implemented a web service
that can be used to check if a given network is affected by this problem. A user
only has to open this website in a browser and we then check if the used DNS
server leaks information.
To summarize, we make the following contributions:
– We introduce a measurement approach to find information leaking DNS
servers on an Internet-wide scale.
– We present a systematic study on DNS servers that might expose internal
network information to external requests over a period of almost half a year.
– We introduce a self-check for identifying information-leaking DNS servers
and discuss possible mitigations.
Our scan and analysis scripts, together with the gathered datasets, are avail-
able at https://github.com/RUB-SysSec/InfraLeakingDNS.
In the remainder of the paper, we first introduce some background informa-
tion on DNS, private IP address ranges, and reconnaissance attacks in Section 2.
Afterwards, we present our approach for discovering leaking DNS servers in Sec-
tion 3, followed by a measurement study in Section 4. In Section 5, we present
a self-check for users to test if they are affected by a misconfigured DNS server
and discuss possible mitigations. In Section 6, we discuss our results, point out
our limitations, and reflect on ethical considerations. Section 7 presents related
work and we conclude our work in Section 8.
2 Background
Before we begin to explain our measurement study, we provide some basic knowl-
edge needed to understand the rest of the paper. First, we describe the concepts
of DNS and private IP ranges. Afterwards, we discuss reconnaissance attacks.
2.1 Domain Name System
The Domain Name System (DNS) is a distributed, hierarchy-based service that is
primarily responsible for the translation of domain names into IP addresses. It is4 Tatang et al. one of the fundamental services in IP-based networks. Without DNS, comfortable use of the Internet is not practical. DNS offers two different resource record types for resolving names to IP addresses type A for IPv4 and type AAAA for IPv6 IP addresses, but also other resource record types exist, such as referring a name to another name (CNAME ) or referring a name to a mail server (MX ). Resolving a request (A, AAAA). If a client wants to resolve a domain name, the first step is to check whether the client has already stored the appropriate IP address in its host file (record type A for IPv4, record type AAAA for IPv6). If this is not the case, the client asks its DNS resolver. If it has saved the IP address for the requested name, it will reply immediately. Otherwise, it asks one of the root name servers. The root name server then answers with the corresponding next lower DNS server (top-level domain). Now the DNS resolver asks the top- level domain server for the next level in the DNS hierarchy (second-level domain). This procedure is iterated until the appropriate answer to the requested domain is retrieved. Reverse lookup (PTR). For a reverse lookup (rDNS request), i.e., finding a name for an IP address, the first step is to convert the IP address into a name formally. The PTR Resource Record is then requested for this name. Since the hierarchy of IP addresses becomes more specific from left to right, but for DNS from right to left, the order of the numbers is rotated at the beginning to make, e.g., ”1.0.0.192.in-addr.arpa” from the IPv4 address ”192.0.0.1”. Daemon information (CHAOS/TXT ). Responses to TXT resource record queries in class CHAOS for the domain names version.bind and version.server can provide an identifier defined by the administrator of the domain name that often includes the version information of the DNS server [25]. 2.2 Private IP Ranges Private IP ranges are excluded from the public address space for private use, thereby allowing them to be used without additional administrative effort in local networks. Private IP addresses should only be visible within the private network. The Internet Assigned Numbers Authority (IANA) defined three different IP ranges as private IP ranges. The private IP ranges were documented in RFC 1597 in 1994 [20]. In 1996, RFC 1597 was replaced by RFC 1918 [21] that is still valid today, but the IP ranges did not change. Table 1 summarizes the private IP ranges and shows the number of possible addresses per range and the network class. 2.3 Reconnaissance Attacks In the military, the term “reconnaissance” is typically used to mean gathering as much information about the enemy as possible before an actual attack is
Large-scale Analysis of Infrastructure-leaking DNS Servers       5

Table 1. Private IP ranges defined by Internet Assigned Numbers Authority (IANA)

      Address range                CIDR           CIDR (short) # addresses class
      10.0.0.0 - 10.255.255.255     10.0.0.0/8     10/8          16.777.216     A
      172.16.0.0 - 172.31.255.255 172.16.0.0/12 172.16/12         1.048.576     B
      192.168.0.0 - 192.168.255.255 192.168.0.0/16 192.168/16        65.536     C

launched. Similarly, we interpret the term in computer security. During a network
reconnaissance attack, intruders try to obtain as much information as possible
about a targeted network. Information of interest includes where active hosts
are located (host detection), what kind of applications are running on the hosts
(vulnerability assessment), and which ports are open (port enumeration) [22].
With this information, an attacker can focus her attack activities and try to
exploit known vulnerabilities.

2.4    Exemplary Attack Scenarios
The infrastructure information gained from internal networks through wrongly
configured DNS servers can help attackers learn more about their attacked net-
works. This behavior makes different scenarios more feasible for attackers. Dur-
ing a DNS rebinding attack, for example, it is advantageous to know the active
hosts in a local network, as this allows targeted attacks on hosts. In addition,
hostnames can also contain additional information about the attack targets, e.g.,
it is advantageous for attackers to know if they have a printer or a particular
router in front of them.
    A second scenario is the creation of an IoT botnet. Thereby, it is beneficial
to know the addresses of the IoT devices in the attacked local network to set
up the botnet faster and leave fewer traces. It is even advantageous to be able
to detect the actual existence of a specific device in a network in advance, as in
this way only networks of interest to attackers are targeted.

3     Discovering Leaking DNS Servers
In the following, we present our approach to discover infrastructure leaking DNS
servers. First, we describe the basic idea, then how we adapted the idea to
Internet-wide scans, and finally, our procedure of the conducted large-scale mea-
surements.

3.1    Approach
To find DNS servers that are improperly configured and thus might reveal in-
formation to the public, we first have to find DNS servers that are publicly
reachable and responsible for an internal network such as company networks
or home networks. In some cases, it is also intended that a server is used for
6 Tatang et al.
internal and external requests. Thus, on the one hand, servers responsible for
reachable public domains and on the other hand also servers responsible for lo-
cal IP addresses for internal domains. If we already knew an internal domain
name, we can learn the internal IP address of these hosts with the help of this
kind of DNS server. However, it is not easy to identify other active hosts in the
internal network from the outside because trying out all possible domain names
is unfeasible.
Nevertheless, we can learn the domain names of the internal hosts with the
help of rDNS (record type PTR) queries on internal IP addresses. Thus, if we
want to learn the internal network structures through a DNS server, we can use
a brute-force approach to request different internal IP addresses, and if we get
a non-empty response, we might get back the hostnames of the internal systems
in some cases. Sometimes it is also possible to derive the underlying system from
the hostname. This strategy is an active approach to scanning internal networks
from an external view.
In addition, for each answer, we collected further information such as the
geolocation and AS number to make a following more in-depth analysis possible.
3.2 Internet-wide scans
Several ways exist to scale our approach across the Internet. We could search
the entire IPv4 range for DNS servers to get a list of publicly reachable DNS
servers in a first step, which we then test in a second step. Alternatively, we
can make use of projects that already perform Internet-wide lookup scans for
DNS to directly obtain a list of available active open DNS servers. We decided
to utilize the second option and use Censys [9], also because we do not want to
generate more scan traffic on the Internet than necessary.
Figure 1 shows a high-level overview of our measurement system we used for
the following large-scale study. We use Censys, which searches the entire IPv4
address space for DNS servers in the 0th step. In the first step, we download
a current dump, in the second step we send 11 requests (nine times private IP
addresses and two times type CHAOS queries) to each server in the list. We
restrict ourselves to the first three IP addresses per private IP range in order
to send as few requests as possible and not cause any problems. The CHAOS
queries are used to obtain DNS server information. BIND nameservers (and
many others) often respond to CHAOS requests with their version and further
information. Finally, if we get answers in the third step, we save them for later
analysis.
3.3 Measurements
We perform our active measurements fifteen times over a period of about six
months (from 08-Sept-18 until 30-Jan-19). During this period, we sent a total
of about 1.3 billion requests to about 121 million servers. In the scope of our
analysis, we investigated 4,695,048 responses.Large-scale Analysis of Infrastructure-leaking DNS Servers 7
DNS server
IPv4
Censys database Scan server DNS server
Private networks
... ...
Fig. 1. High-level overview of our approach to discover information leaking DNS
servers. First, we download the current Censys list with reachable open DNS servers
(which has performed an IPv4 DNS lookup [0.]) to our scan server [1.]. Then we send
our requests to every server in the Censys list [2.]. In some cases we do not receive
an answer, these servers do not leak any information while in other cases we receive a
response [3.] which may contain interesting data.
Moreover, we enriched the data with the country and AS number information
for a more in-depth insight into the potential leaking DNS servers in the wild.
For this purpose, we used the Maxmind geolite 2 database [1]. We expect only
neglectable changes in the country mapping, therefore we used the database from
2019-01-23 for all country information. For the ASN information, we used the
archive.routeviews.org data corresponding to each scan [4]. The responses are
stored in JSON format per server for further analysis. In total, about 3.1 GB
of raw data were generated by actively probing DNS servers. An example of a
saved response is showed in Listing 1.1.
The parameter ns specifies the requested DNS server, some meta informa-
tion like the timestamp of the first or last request is stored. In addition, the
Censys dump from which the IP of the DNS server originates is stored. The host
field contains the response information. In the example, we see that we receive
responses for all private IP ranges. It looks like the DNS server is a server of
Alipay, the payment service of Alibaba [3].
4 Measurement Study
In the following, we analyze the collected data and present the results of the
conducted network measurement study. We start with simple statistics and then
present deeper insights.
4.1 General statistics
Key figures. Figure 2 visualizes the number of requested DNS servers. Note
that the possible amount of reachable open DNS servers is lower than the regard-
ing Censys dumps because of possible IP address changes related to churn [18].8 Tatang et al.
Listing 1.1. Exemplary saved json response (excerpt)
1 {
2 ” i ” : 1108550 ,
3 ” ns ” : ” 1 0 4 . 1 6 6 . 2 1 4 . 1 7 2 ” ,
4 ” meta ” : {
5 ” param queries ”: 3 ,
6 ” s t a r t t i m e ”: 1536337754.069967 ,
7 ” stop time ”: 1536337760.79974 ,
8 ” c e n s y s i d ” : ” 2 0 1 8 0 9 0 6 T2339 ”
9 },
10 ” hosts ”: {
11 ”10.0.0.2”: [
12 ” debug010000000002 . l o c a l . a l i p a y . net . ”
13 ] ,
14 ”10.0.0.3”: [
15 ” 6 8 5 b35a113b7−l . l o c a l . a l i p a y . n e t . ” ,
16 ”6 c 9 6 c f d e 8 e 4 3 −l . l o c a l . a l i p a y . n e t . ” ,
17 ...
18 },
19 ” daemon ” : ”Daemon identification failed ”
20 }
During the scan of September 20th, 2018 a measurement error occurred which
leads to a significantly lower amount of probed servers in comparison to the
other scans. However, the total number of servers requested stabilized at around
8.1 million probed ones. Note that we only include active and reachable DNS
servers in the further course of this study.
10.000.000
8.000.000
6.000.000
4.000.000
2.000.000
0
2018-09-08 2018-10-08 2018-11-08 2018-12-08 2019-01-08
Fig. 2. Number of requested DNS servers during our conducted measurement study
Figure 3 presents the number of responses per conducted scan. Overall, there
is a decrease in the number of responses, which in the course of the study stabi-
lized at around 300,000. Figure 4 shows the proportion of all requested servers
corresponding to the number of responses.
Table 2 summarizes the statistical key figures over all conducted scans. On
average, we queried about 8.1 million servers and stored about 313,000 respond-
ing servers each. The average proportion of responding servers is 3.9 %. The
median values provide 8,252,732 requested servers, 275,424 stored responses and
a share of 3.3 % of responding servers. The medians are similar to the mean val-
ues and thus we conclude that no particular outliers were noticed in our data set.
In total, we requested a maximum of 8,860,391 servers to perform the measure-
ments, a maximum of 574,427 responders and the largest measured proportion
of responding servers at 6.5 %. In comparison, the minimum values are 5,281,251
requested servers, 170,369 responses, and a share of 2.1 %.Large-scale Analysis of Infrastructure-leaking DNS Servers 9
800.000
600.000
400.000
200.000
0
2018-09-08 2018-10-08 2018-11-08 2018-12-08 2019-01-08
Fig. 3. Number of saved responses during our conducted measurement study
8%
6%
4%
2%
0%
2018-09-08 2018-10-08 2018-11-08 2018-12-08 2019-01-08
Fig. 4. Share of responding servers related to all requested servers
Response groups. In order to interpret and further analyze our responses,
we group them into nine self-defined groups because some of the answers are
similar or at least strongly correlated. Our categorizes are single, localhost, bogon,
emptyresponse, constant, arpa, ip, enduser, and other. The first group single
represents all responses with only one host; thus active hosts or the subnets
in use may be identified by this. The groups localhost and bogon include all
responses with hostnames “localhost.” or “bogon.” for all requested private IP
addresses, and the group emptyresponse includes only empty hostnames (“.”)
for all requests. The group constant contains only one unique hostname for all
hosts and the groups arpa and ip include IP addresses and reverse DNS requests
as their names for the hosts for all sent requests.
The most interesting groups are other and enduser, because this is where
potentially information leakage is the largest. In enduser are the answers that
we would classify as a home network. At first, we realized the classification by
searching case-insensitive for the terms “apple”, “iphone”, “ipad”, “samsung”,
“galaxy”, and “home”. This solution was intended to allow a quick grouping.
Later, we systematically evaluate the creation of the list of keywords via affinity
Table 2. Statistical key figures of performed active probing
∅ median max min
Servers 8,104,454.27 8,252,732 8,860,391 5,281,251
Responses 313,003.2 275,424 574,427 170,369
Shares 3.9 % 3.3 % 6.5 % 2.1 %10 Tatang et al.
propagation (see Section 4.2 for details). For now, we assume that this list covers
a wide range of used end-user devices and we think that these words indicate
end-user devices within the regarding networks. Furthermore, it is unlikely that
these are ISP infrastructure networks, but rather corporate or home networks.
Lastly, in others we include all responses which do not fit into one of the so far
introduced categories.
Figure 5 illustrates the number of requests per category and scan as stacked
area diagram. It is noticeable that especially the group bogon rapidly decreases in
the number of responses between the scans 14-Sept-18 and 27-Sept-18 (difference
of -238,718). A small drop between the scans is also visible in the single group
(difference of -40,708). This drop mainly includes China and the USA, which
together have almost 200,000 responses less between the two scans. All in all,
each country loses a few, with a few exceptions. For AS numbers, the case is
somewhat more widespread. The top ten AS numbers with the highest loss of
answers are responsible for about 150,000 entries and are also mostly from China.
Probably there was an update at a large ISP in China, which led to a drastic
reduction of the answers. All other groups remain somewhat stable in their sizes.
600.000
500.000
400.000
300.000
200.000
100.000
0
2018-09-08 2018-10-08 2018-11-08 2018-12-08 2019-01-08
localhost single ip emptyresponse constant other enduser arpa bogon
Fig. 5. Count of requests per category and per scan (black vertical lines)
Daemon information. With CHAOS requests [25] (version.bind and ver-
sion.server), we learn what implementations are actually used among the
servers that responded to our internal IP range requests. The information is
stored for each scan from October 2018. We collected information about dae-
mons with up to 32 % of all respondents. The remaining servers, unfortunately,
did not reveal any information. Next, we take a closer look at the daemon infor-
mation and focus only on the answers with that information.
Figure 6 presents the number of daemons among our answers over time. At
the beginning until the scan from November 12, 2018 we have about 70 % BIND
implementations, about 20 % dnsmasq, about 3 % PowerDNS, and about 1 % MSLarge-scale Analysis of Infrastructure-leaking DNS Servers 11
DNS. Interestingly, the results are comparable to the work of Kührer et al. [15],
where all open DNS resolvers were fingerprinted. From the scan of November
18, 2018, the ratio for dnsmasq and BIND changes. From that point it is exactly
the other way round, we have more dnsmasq (up to 85 %) and less BIND (up
to 19 %). During our measurements, the distribution changed such that BIND
does not reveal daemon information most often, but dnsmasq.
80.000 100%
70.000 90%
80%
60.000
70%
50.000 60%
40.000 50%
40%
30.000
30%
20.000
20%
10.000 10%
0 0%
2018-10-01 2018-11-01 2018-12-01 2019-01-01 2018-10-01 2018-11-01 2018-12-01 2019-01-01
dnsmasq BIND MS DNS PowerDNS dnsmasq BIND MS DNS PowerDNS
(a) Count of daemons per category (b) Share of daemons per category
Fig. 6. Daemons distributions
This demonstrates that there are no individual implementations that are
particularly affected by the behavior of the issue of an unintentional data leak.
Therefore, it indicates that it is not an implementation problem, but rather a
configuration mistake. The fact that the distribution of the daemons changes con-
siderably, but the group distribution remains stable, makes it an even stronger
indicator.
4.2 In-depth insights
In the following, we provide more profound insights into the servers that reveal
potential information. First, we present the results regarding the origin of our
seen responses (countries and AS numbers). After that, we illustrate statistics
about the utilization of private IP ranges. Lastly, we analyze our response groups
in more detail.
AS numbers and countries. The AS number distributions and the country
distributions show that only a few are responsible for a large part of the re-
sponses. Figure 7 (a) and (b) present cumulative distribution functions (CDF)
over all scans. With 13 AS numbers, half of the answers are covered. The curves
for the countries are even steeper so that already two countries are responsible
for half of all the responses (China and the United States). A comparison of each
CDF per scan reveals that the behavior remains stable across all scans.
Figure 8 is a world map diagram showing the number of responding servers
per country. China, the United States, Romania, and Russia are among the top12 Tatang et al.
100% 100%
90% 90%
80% 80%
70% 70%
60% 60%
50% 50%
40% 40%
30% 30%
20% 20%
10% 10%
0% 0%
100
100
0
4
8
12
16
20
24
28
32
36
40
44
48
52
56
60
64
68
72
76
80
84
88
92
96
0
4
8
12
16
20
24
28
32
36
40
44
48
52
56
60
64
68
72
76
80
84
88
92
96
# ASNs # Countries
(a) Cumulative distribution function of (b) Cumulative distribution function of
seen AS numbers seen countries
Fig. 7. Cumulative distribution functions
countries with potentially leaking DNS servers. Overall, however, almost every
country has a few responding servers.
Fig. 8. Worldwide distribution of responding DNS servers (31-Jan-19)
Table 3 presents the top ten countries and AS numbers with the most re-
sponding servers among all scans. Notice that six out of ten of the top AS
numbers belong to China. In addition, it is significant that China responded
almost twice as much as the second-placed (USA) and ten times as much as
Romania and Russia in third and fourth place.
The number of answers per country and AS number also appears in Figures 9
(a) and (b). Here we see that the values are comparatively stable. However, after
the second scan, there is a drop in three AS numbers especially in AS number
9808. Although AS 9808 provided by far the most answers at the beginning of
our study, since October we see only very few answers from this AS number. In
return, AS 4837 increased considerably from mid-November 2018, as did ASNLarge-scale Analysis of Infrastructure-leaking DNS Servers 13
Table 3. Total responses among all scans
(a) per Country (b) per AS number
Country #Count ASN AS Name #Count
China 1,839,099 4837 CHINA UNICOM China169 Backbone 592,908
USA 970,727 4134 No.31,Jin-rong Street 341,578
Romania 186,677 9808 Guangdong Mobile Communication Co.Ltd. 244,475
Russia 178,678 4847 China Networks Inter-Exchange 235,165
Korea 117,091 8708 RCS & RDS 161,954
Taiwan 111,418 209 Qwest Communications Company, LLC 150,003
Germany 90,319 5650 Frontier Communications of America 120,251
Canada 83,352 4808 China Unicom Beijing Province Network 110,620
France 74,729 3462 Data Communications Business Group 99,650
Italy 70,729 9394 China TieTong Telecommunications Corporation 88,032
4847 responses. All of the conspicuous AS numbers are located in China thus
speculating whether either an update was distributed by major ISPs or perhaps
there was a corporate takeover. Comparable behavior is also observed in the
countries responses in (b). China loses a large number and rises again in the
course of the study, whereas the USA continues to respond lesser and the other
top countries remain stable.
90.000 250.000
80.000
200.000
70.000
60.000
150.000
50.000
40.000 100.000
30.000
20.000 50.000
10.000
0 0
AS4837 AS4134 AS9808 AS4847 AS8708 USA Romania Russia Korea China
(a) Responses per AS numbers (Top 5) (b) Responses per Country (Top 5)
Fig. 9. Counts of responses per AS numbers and countries
Previously we considered the absolute values. However, the question now is
how to interpret them in relation to all DNS servers. To quantify the impact,
we normalized the values according to the number of reachable servers. The
countries with the highest share of possibly misconfigured servers are the British
Virgin Islands with 80 %, Macao with 41 %, and Comoros with 28.5 %. However,
these countries only have a couple of servers (British Virgin Islands 2,533, Macao
898, and Comoros 14). The country with the most responding servers is China14 Tatang et al.
100%
80%
60%
40%
20%
0%
192.168.0.0/16 10.0.0.0/8 172.16.0.0/12
Fig. 10. Shares of used private IP ranges
and it has a share of about 9 %. The USA has just under 3 %, Romania about
15 % and Russia about 3.4 %.
Private IP ranges. The utilization of private IP ranges by the groups others
and enduser in our responses is visualized in Figure 10. 192.168/16 is the most
frequently in use private IP range, at on average 45.3 %. This is followed by 10/8
with 29.8 % and then 172.16/12 with 24.9 %. This distribution remains stable
over the entire measurement period.
Response groups. While some responses do not provide an information ben-
efit, there are some that might be useful. In particular, the responses of the
groups bogon and localhost provide no information advantage for an adversary.
The groups emptyresponse, constant, arpa, and ip also do not provide an infor-
mation gain. With the group single (∅ responses 71,761), one often learns little
to nothing about the hostnames, but active hosts thus may become identifiable
and of course the used subnet.
Nevertheless, as already remarked earlier, the two groups other (∅ responses
26,636) and enduser (∅ responses 7,126) are the most relevant because we may
get more network information through them. As well as the active hosts, we
gather the hostnames also. In some cases, this even helps to determine the de-
vices in use and in certain circumstances the services and hosts deployed. Thus
particularly worthwhile targets, e.g., databases, web servers, or specific end-user
devices, can be detected in the reconnaissance phase.
Interestingly, most answers originate in these groups from servers in the USA
and only second most often from China. From a global point of view, the situation
is exactly the other way around for all groups, as described previously. A large
number of hostnames have information on end-user devices, such as iPhones,
Samsung devices, etc. Table 4 presents the top ten hostnames per group enduser
(a) and other (b) over all scans summed. Many Broadcom routers are configured
in such a way that information is disclosed to external parties. Some matchesLarge-scale Analysis of Infrastructure-leaking DNS Servers 15
refer to Cisco routers, Qwest modem routers, and Comtrend routers as well.
More information is available about Apple devices or devices that derive their
hostnames from their user names, including in some cases the real names of their
owners, e.g., ”iPhone of Owner.”. Note that routers are over-represented in this
list. As most routers use the first IP of the subnet they control, we are more
likely to detect one if we probe only the first three IPs of each subnet.
Table 4. Top ten hostnames per group enduser and other over all scans summed
(a) Group: enduser (b) Group: other
Hostname #count Hostname #count
Broadcom.Home. 64,698 bogon. 335,676
. 37,545 localhost. 115,470
iPhone. 8,127 ospd-gw.ospd.net. 50,354
192.168.0.2 5,895 tatina.ospd.net. 50,077
Cisco.Home. 5,183 red.ospd.net. 48,997
Comtrend.Home. 4,437 T2.primorye.net.ru. 42,763
192.168.0.3 4,316 www.routerlogin.com. 37,786
qwestmodem.domain. 3,958 AdtranTA924ATA 34,653
modem.domain. 2,842 . 14,551
192.168.0.4 2,455 ntweb1.megawebservers.com. 13,927
Hostname Pattern Analysis. In the next step, we analyze the assigned host-
names in the groups enduser and other in order to identify patterns that are
used more often. We use data mining techniques such as affinity propagation [12]
to generate clusters and Levhenstein distance as a metric for grouping. In the
enduser group, we have on average 45 clusters per scan and in the other group
73 clusters. Overall it shows that the enduser group is fairly well pre-sorted, as
the clusters work fine here.
Clusters with, for example, the patterns .iPhone (24,186),
or .iPad (9,086) are interesting clusters in the group enduser.
These networks are most likely home networks with Apple devices. Frequently,
the user name can also be recognized for these hostnames. Other notable pat-
terns are hostnames in form of android- (16,495) but also
amazon- (6,659) each with and without hyphen. The devices
with these patterns are usually also in home networks and represent various
Android devices, such as smartphones and tablets, and Amazon devices, such
as the FireTV stick and Kindle devices. A last pattern worth mentioning we
identified in the format -PC (9,921) or desktop
(4,403) in all variations. Devices with these hostnames are most likely comput-
ers, e.g., Windows devices, in-home networks that have hostnames specified by
the user.
In the group other, we observed more different patterns in the clusters. Never-
theless, we were able to identify interesting clusters as well. Again there are host-16 Tatang et al.
name patterns like android (8,231) or desktop
(2,989) in different variants. Here, as well, they are home networks with end-user
devices. More patterns that refer to home networks are kindle
(340), roomba (99), or laptop (1,792) (in all
variations). Further interesting are hostnames with patterns that refer to fire-
walls and demilitarized zones, e.g. such as firewall. (2,377)
or .dmz. (891). This information is useful for attackers because
it allows them to identify the location of the firewall in the network and also
to learn the fact that a firewall is used in this network at all. Additionally,
we have patterns of the type .infra.cdn.att.net., which are
probably AT&T CDN networks. Also interesting are the patterns of the kind
..net., these devices or networks are prob-
ably purchased IT solutions of the companies mentioned in the company name.
Systematization of enduser grouping. As mentioned before, we used a
keyword search to create the group enduser. This first list of keywords was
intended as a first attempt. Since we did the pattern analysis for the other
group, we noticed that our first list of keywords was quite good, but some words
are missing. The complete list of keywords for the identification of the enduser
group is as follows: apple, iphone, ipad, samsung, galaxy, home, android, desktop,
laptop, amazon, kindle, roomba. The number of answers increases accordingly in
the enduser group on average by about 993.8 answers. On the other hand, the
number of answers in other also decreases by 993.8. The difference is measurable,
but does not change any previous analysis, since we usually examined the groups
enduser and other together, as these are most interesting concerning data leaks.
5 Self-Check and Mitigation
We found that infrastructure leaking DNS servers occur in the wild. The prob-
lem, however, is easy to solve and there are several alternatives possible. Gen-
erally speaking, one always should check the server configurations and adjust
them accordingly. For example, a solution for BIND servers is explained in
the RedHat manual [2]. To further simplify the checking process, even for non-
technicians, we have implemented a self-test. This test can be used to find out
if one’s network is affected by an information leak. More information about
where the test is currently hosted is available in our git repository (https:
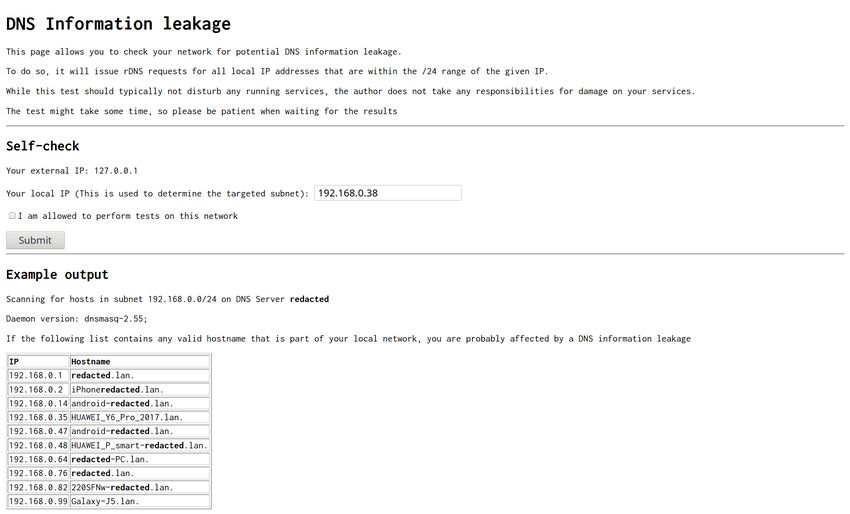
//github.com/RUB-SysSec/InfraLeakingDNS). A user only has to open the
website in a browser and it is then checked if the used DNS server leaks infor-
mation (see Figure 11 for an example).
Another variation to solve the issue is to contact the DNS server vendors
and encourage them to change the default behaviors of their daemons. Thus
the problem becomes more limited because many maintain the default settings.
Additionally, with the help of updates, misconfigured servers can be fixed auto-
matically during the update process.Large-scale Analysis of Infrastructure-leaking DNS Servers 17
A last way to mitigate the issue, in general, is a rapid switch to IPv6, i.e.,
no use of NATs. This eliminates the need to use the misconfigured servers.
Fig. 11. Screen shot of our self-check
6 Discussion and Threats to Validity
The share of potentially leaking DNS servers is about 3.9 percent, but the abso-
lute numbers with up to 574,000 servers potentially leaking DNS servers are not
negligible. However, it remains to be mentioned that not all servers are suitable
to gather internal network information. Proper information leakage is present
with up to 158,000 servers. Note that these figures must be seen as a lower
bound since in our study we actively requested only three subnets and only the
first three IPs per subnet. We demonstrate that it is not an implementation
problem but rather a configuration problem and that the number of potentially
usable leaking DNS servers is highest in the USA.
As part of our study, we attempted to generate as little network load as
possible. We further assume that 11 requests per DNS server every few days did
not cause any problems. Another interesting result of the study is to obtain a
distribution for the utilization of private IP addresses. As far as we know, it has
not been previously disclosed which private ranges are most frequently used. To
be ethical, we have not carried out any further scans of private networks.
The first limitation of our approach is the fact that due to IP changes, not
all possible reachable DNS servers may be checked. We use a list of DNS servers18 Tatang et al.
from Censys as input for our test server. The older this list, the more unreachable
DNS servers may occur. However, we downloaded the latest available scan before
each scan and tried to achieve the highest possible coverage of servers. Apart
from one single measurement, this was also successful.
A second limitation is that our measurements were made from three different
locations. In the beginning, the scans were performed from a home network and
after the eleventh measurement, we started all scans from inside our university
network. However, we have not been able to determine any outliers and think
that this procedure seems acceptable.
Further, the third limitation of our study is the fact that the potential in-
formation gain is comparatively small and it is not possible to launch targeted
attacks, but rather to find suitable targets. As a result, the security impact is
not high. Nevertheless, it is a concern that should not be lost sight of, especially
since the absolute amounts are considerable.
7 Related Work
Many papers measure various aspects of the DNS. Whether it is a classification
of Open DNS resolver [15] or DNS manipulations during resolution [16, 19].
There are also works that use DNS to collect datasets [10] and analyze service
dependencies [8]. A work discussing active measurement challenges is conducted
by van Rijswijk-Deij et al. [24]. Thus, there is work measuring, in particular,
the infrastructure and general aspects of the DNS and work related to network
security and data privacy. Kührer et al. categorized in their work open DNS
resolver [15]. On empirical data, they examined the DNS server landscape. In
a second step, they analyzed the responses from the servers and demonstrated
that many are manipulating the responses. Another work on the manipulation
of DNS responses was conducted by Pearce et al. [19]. The authors studied and
examined manipulation, especially in the context of global censorship through
DNS. Liu et al. also studied DNS manipulations [16]. They focused on the illegal
intercepting of DNS resolutions at the ISP level.
In our work, we are not interested in which DNS servers are reachable as a
whole, but we focus on the DNS servers that provide us with potential internal
network information. We did not look at any manipulations of the DNS requests.
A work examining DNS resolver in more detail was done by Al-Dalky et al. [6].
The authors analyze pool structures of DNS resolvers.
A work of Fiebig et al. shows that rDNS is suitable for measurement stud-
ies [11]. We use rDNS queries to identify potentially interesting DNS servers for
us. Another work by Fiebig et al. uses DNS to collect data sets for IPv6 [10].
This shows that DNS may be used to gather information for so far overlooked as-
pects. Dell et al. also uses DNS to collect information for a different purpose [8].
The authors analyzed dependencies between services using DNS. We use DNS
to perform a reconnaissance effort. More recent work in the field of DNS mea-
surements are for example conducted by Liu et al., Fukuda et al. and Chung et
al. [7, 13, 17]. Liu et al. examined misconfigured DNS records [17] and FukudaLarge-scale Analysis of Infrastructure-leaking DNS Servers 19
et al. utilizes DNS to identify malicious activity [13]. Chung et al. performed a
first large-scale measurement study on the management of DNSSEC’s PKI [7].
As far as we know, we found no work that considers DNS servers concerning
possible information leakage to internal networks.
8 Conclusion
In this paper, we focussed on the observation that misconfigured DNS servers
might leak internal information to external intruders without the need for an
individual exploit or vulnerability. We performed an Internet-wide measurement
study and found that about 4 % of all reachable DNS servers might leak inter-
nal information. We learned that these servers do not reflect an implementation
problem, but rather a configuration issue. In most cases, this is not a serious
problem since they answer with no useful responses (e.g., bogon., localhost., etc.).
However, there are cases which leak useful internal network information such as
internal IP addresses of active hosts and hostnames. This information is then
available for further targeted attacks. Our measurement study shows that up
to 158,000 DNS servers leak such internal network information in the wild. The
share of these servers is not huge; thus, it is not a major Internet security prob-
lem. Nevertheless, there are instances in the wild, and for that reason in order
to further reduce the amount of these servers, we implemented a self-check to
quickly verify if a network is affected and briefly discussed mitigation actions.
For future work, we plan to widen the study over a more extended period and
more internal subnets.
Acknowledgment
This work was partially supported by the German Federal Ministry of Education
and Research (BMBF grant 16KIS0395 “secUnity”). We would like to thank the
anonymous reviewers for their valuable feedback.
References
1. GeoLite2 Free Downloadable Databases. https://dev.maxmind.com/geoip/
geoip2/geolite2/. Accessed: 2019-02-22.
2. How to prevent bind server resolving private ip addresess and leaking them to ex-
ternal network? https://access.redhat.com/solutions/46558. Accessed: 2019-
02-22.
3. Trust makes it simple. https://intl.alipay.com/. Accessed: 2019-02-22.
4. University of Oregon Route Views Archive Project. http://archive.routeviews.
org. Accessed: 2019-02-22.
5. When your dns leaks your infrastructure. https://www.codemetrix.net/
when-your-dns-leaks-your-infrastructure/. Accessed: 2019-02-22.
6. R. Al-Dalky and K. Schomp. Characterization of collaborative resolution in re-
cursive dns resolvers. In International Conference on Passive and Active Network
Measurement (PAM), 2018.20 Tatang et al.
7. T. Chung, R. van Rijswijk-Deij, B. Chandrasekaran, D. Choffnes, D. Levin, B. M.
Maggs, A. Mislove, and C. Wilson. A longitudinal, end-to-end view of the dnssec
ecosystem. In USENIX Security Symposium, 2017.
8. M. Dell’Amico, L. Bilge, A. Kayyoor, P. Efstathopoulos, and P.-A. Vervier. Lean
on me: Mining internet service dependencies from large-scale dns data. In Annual
Computer Security Applications Conference (ACSAC), 2017.
9. Z. Durumeric, D. Adrian, A. Mirian, M. Bailey, and J. A. Halderman. A search
engine backed by Internet-wide scanning. In 22nd ACM Conference on Computer
and Communications Security, 2015.
10. T. Fiebig, K. Borgolte, S. Hao, C. Kruegel, and G. Vigna. Something from nothing
(there): collecting global ipv6 datasets from dns. In International Conference on
Passive and Active Network Measurement (PAM), 2017.
11. T. Fiebig, K. Borgolte, S. Hao, C. Kruegel, G. Vigna, and A. Feldmann. In rdns we
trust: Revisiting a common data-sources reliability. In International Conference
on Passive and Active Network Measurement (PAM), 2018.
12. B. J. Frey and D. Dueck. Clustering by passing messages between data points.
science, 2007.
13. K. Fukuda and J. Heidemann. Detecting malicious activity with dns backscatter.
In ACM SIGCOMM Internet Measurement Conference (IMC), 2015.
14. G. Kambourakis, T. Moschos, D. Geneiatakis, and S. Gritzalis. Detecting DNS
amplification attacks. In International Workshop on Critical Information Infras-
tructures Security, 2007.
15. M. Kührer, T. Hupperich, J. Bushart, C. Rossow, and T. Holz. Going wild: Large-
scale classification of open dns resolvers. In ACM SIGCOMM Internet Measure-
ment Conference (IMC). ACM, 2015.
16. B. Liu, C. Lu, H. Duan, Y. Liu, Z. Li, S. Hao, and M. Yang. Who is answering my
queries: understanding and characterizing interception of the dns resolution path.
In USENIX Security Symposium, 2018.
17. D. Liu, S. Hao, and H. Wang. All your dns records point to us: Understanding the
security threats of dangling dns records. In Proceedings of the 2016 ACM SIGSAC
Conference on Computer and Communications Security, 2016.
18. R. Padmanabhan, A. Dhamdhere, E. Aben, N. Spring, et al. Reasons dynamic
addresses change. In ACM SIGCOMM Internet Measurement Conference (IMC),
2016.
19. P. Pearce, B. Jones, F. Li, R. Ensafi, N. Feamster, N. Weaver, and V. Paxson.
Global measurement of dns manipulation. In USENIX Security Symposium, 2017.
20. Y. Rekhter, B. Moskowitz, D. Karrenberg, and G. de Groot. Address Allocation
for Private Internets. RFC 1597, RFC Editor, March 1994.
21. Y. Rekhter, B. Moskowitz, D. Karrenberg, G. de Groot, and E. Lear. Address
Allocation for Private Internets. RFC 1918, RFC Editor, February 1996.
22. S. A. Shaikh, H. Chivers, P. Nobles, J. A. Clark, and H. Chen. Network reconnais-
sance. Network Security, 2008, 2008.
23. S. Son and V. Shmatikov. The hitchhikers guide to DNS cache poisoning. In In-
ternational Conference on Security and Privacy in Communication Systems, 2010.
24. R. van Rijswijk-Deij, M. Jonker, A. Sperotto, and A. Pras. A high-performance,
scalable infrastructure for large-scale active dns measurements. IEEE Journal on
Selected Areas in Communications, 2016.
25. S. Woolf and D. Conrad. Requirements for a Mechanism Identifying a Name Server
Instance. RFC 4892, RFC Editor, June 2007.You can also read