3rd Quarter Commentary - October 2021 - MARKET COMMENTARY - Horizon Kinetics
←
→
Page content transcription
If your browser does not render page correctly, please read the page content below
MARKET COMMENTARY

3rd Quarter Commentary
October 2021
MARKET COMMENTARY
3rd Quarter 2021                                                                         October 2021

 What Clients Have Been Asking About

 A recent tally of our relationship managers for     Page 1:   What Clients Have Been Asking About
 feedback from clients revealed these more           Page 1:   Absence of New Ideas?
 common questions and comments:
                                                     Page 3:    Cheniere Energy
     We don’t seem to have any new ideas.
                                                     Page 4:    Not ‘Pushing Back’ About Inflation
     Clients are no longer ‘pushing back’ about                  Anymore
     the prospect of inflation, but wonder about     Page 5: Why Can the Coming Inflation be Severe?
     the possible severity, and about the best
     way to either hedge against or participate.     Page 7: Why Will the Energy Price Reaction be
                                                              Severe?
     Many ask about the longer-term Texas
                                                     Page 12: Something to Come to Terms With
     Pacific Land Corp. (TPL) outlook, as in how
                                                               (Energy Demand)
     long-lived the assets are, how much of the
     resources have been explored, and when          Page 13: And Other Commodities & ‘Inflation
     production and other activities will develop              Investing’
     further.                                        Page 17: The TPL Questions
                                                     Page 22: What About the GBTC Discount to NAV,
     Related to that, why TPL is better than other
                                                               and the New ProShares Bitcoin ETF?
     Permian Basin companies, including the
     likes of Chevron, and how the various           Page 25: The HK Crypto-mining Partnerships and
     energy companies in the region are reallo-                Other Publicly Traded Cryptocurrency
     cating assets or positioning themselves?                  Miners

     What about the GBTC (Grayscale Bitcoin Trust) discount to NAV vis-à-vis the new Pro-Shares Bitcoin
     ETF?

     In connection with the two cryptocurrency mining partnerships that are going to be publicly listed
     soon, can we touch on other publicly trade mining companies and how they’re valued, and why or how
     our mining operations are different?

 Absence of New Ideas?

 This one had me flummoxed for a while. I came to think that there could only be two reasons for thinking
 that there haven’t been many new investments in our portfolios.

 One reason might be that some of the holdings in older-vintage accounts have become so dominant, and
 so much the subject of questions and response in prior quarterly reviews, that it might seem that little
 else is going on. TPL and Wheaton Precious Metals, as well as Grayscale Bitcoin Trust and Brookfield Asset
 Management, for instance. Been hearing about them for years and years. But there has actually been
 significant refinement of portfolio holdings in the past few years as we pre-position for the contingency
 of a chronic and possibly serious period of inflation – which would mean severe purchasing power erosion
 for people’s savings and capital.

© 2021 Horizon Kinetics LLC ®                                                                        Page | 1 of 28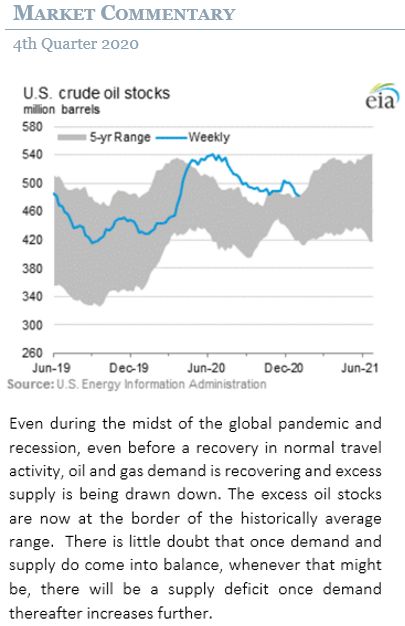
MARKET COMMENTARY
 3rd Quarter 2021                                                                                                   October 2021

 Here is a selection of some of these new holdings, though hardly a complete one. For instance, one stock
 is not on this list because we’re in the process of purchasing it in a number of small-cap strategies. It’s a
 different inflation return vector: raw land, but ready for development. By our standards, we’ve actually
 been pretty active.

 These businesses predominantly share the characteristic of being ‘asset-light’ or ‘hard asset’ – they don’t
 require an asset-heavy balance sheet in order to operate and, so, are less exposed to the ravages of cost
 inflation upon their operations. Would I rather be a manufacturer, or just a fee collector?

 As in, would I want to be a car manufacturer during an extended inflation, burdened with rising replacement
 costs for my enormous plant and equipment base, and with compensation increases for my large employee
 base? Or would I rather be a car dealer: basically, an upgraded parking lot with short-term inventory and a
 certain pass-through margin on sales? That margin generates proportionally more dollars of profit as car
 prices rise, but without much increase in operating costs. Would I want to own a fleet of container ships or
 oil tankers, subject to constant physical depreciation and replacement spending, with little control over my
 primary operating cost – fuel? Or would I rather be a shipping broker, which sells information, and whose
 fees are ad valorem, meaning they’re based on – and rise with – the lease prices of the charters I broker?

                            Initial                                      Initial
Larger-Cap Strategies     Purchases   Smaller-Cap Strategies           Purchases   Inflation participation vector
Archer Daniels Midland     Aug '20    Seabord Corp.                     Apr '20    Earns a processor margin on rising food commodity prices
Autonation                 May '20    Penske Auto Group                 May '20    Earns a reseller margin on rising new/used auto sales

Cheniere Energy            Dec '18    Altius Minerals Corp.             May '21    Processor margin on LNG exports (cleaner replacement
                                                                                   fuel); renewable energy commodities royalties

Clarkson PLC               Feb '19    Braemar Shipping Svcs             Jul '17    Ad valorem brokerage fees on higher global marine
                                                                                   shipping prices
Deterra Royalties          Apr '21    Mesabi Trust                      Nov '18    Iron ore royalties
Franco Nevada              Mar '19    Maverix Metals                    May '21    Gold royalties

Galaxy Digital Holdings    Dec '20    Galaxy Digital Holdings           Dec '20    Diversified crypto/blockchain service fees and spreads
                                                                                   (brokerage, advisory/mgmt, investment banking)

Intercontinental Exch      Apr '20    TMX Group (Toronto Stock Exch)    Apr '20    Transaction fee and spread collector of commodity and
                                                                                   financial asset (e.g., bonds, currencies) inflation
Rayonier Inc.              Sep '20    Acadian Timber Corp.              Oct '20    Timber harvesting fees

Source: Horizon Kinetics Research. Companies listed are for illustrative purposes only. They may not be actual portfolio holdings.

 Each of these 18 new holdings is aligned with different inflation vectors. The oldest three are Cheniere,
 Clarkson, and Braemar Shipping Services. All the rest were initially purchased in 2020 and earlier this year.
 Which raises the possible second reason for thinking we might be devoid of new ideas. What does “new” or
 “recent” mean? It’s a subjective term.
 Even among the 2020 purchases, some of those were a year and a half ago. For many people, that’s old
 news. Nevertheless, we’ve been fully disclosed for over 25 years about what our investing time frame is.
 You can hardly have a conversation with us without hearing about it: that Wall Street cares about this year
 and next year and doesn’t give much thought beyond that; and that Horizon Kinetics cares about 3 to 5
 years from now (or longer), and doesn’t give much thought to this year or next. That’s not just an empty

 © 2021 Horizon Kinetics LLC ®                                                                                                Page | 2 of 28
MARKET COMMENTARY
3rd Quarter 2021                                                                                      October 2021

stylistic difference – we believe it’s our advantage, if you believe that investing is about future change.
That’s because – care of the magic formula of supply and demand – if there’s insufficient interest in
developments or earnings 3 years from now, then it means they’re of little value to other investors today,
which means the price for those outcomes will be too low. The incentive system and business structure of
the investment industry is, with few exceptions, built around these three time horizons: this year’s quarter
vs. last year’s quarter, the balance of this year, and next year.

Cheniere Energy, from this list, shows our time frame approach in action. The share price is up very
substantially from when we initially bought it 2 ½ years ago, and it reaches new all-time highs almost
monthly 1. The stock dropped by 50% early last year, and the entire return occurred this year. You might
think, ‘Ok, 3 years, excellent performance, that’s it.’ That’s not why we bought it. We bought a certain
business model, a value development pattern on a massive dormant asset, and a valuation discount.

We bought Cheniere because it was exceedingly
cheap as it transitioned from a development            Much of What You Need to Know about Cheniere
stage operating company stage, having just             SINGAPORE, Oct 11 (Reuters) - Chinese natural gas distribution
turned profitable a year after completing its basic    company ENN Natural Gas Co Ltd (600803.SS) said on Monday
plant construction and selling its first shipload of   it signed a 13-year deal to buy liquefied natural gas (LNG) from
liquified natural gas (LNG): 2017 loss of $(390)       U.S. LNG company Cheniere Energy Inc beginning in July 2022.
million vs. 2018 earnings of $470 million.             This is the first major binding deal for natural gas between the
                                                       two nations since a long-standing trade war which brought gas
It was very debt leveraged, but already had a          trade between both countries to a temporary standstill.
uniquely large, reliable stream of cash flow, with     The deal is for 0.9 million tonnes per annum (MTPA) of LNG…
20-year supply contracts for over 85% of its ca-       ENN said Monday. [ = 2%+ of current Cheniere total capacity]
pacity. It could be foreseen with confidence that,
                                                       Cheniere said the purchase price will be indexed to gas at the
year by year, its interest coverage and credit rat-    U.S. Henry Hub benchmark in Louisiana, plus a fixed
ings would improve (they have) even as it contin-      liquefaction fee…
ued building out its remaining liquefaction            Cheniere is already the biggest buyer of gas in the United
plants. Its capital expenditures would decline,        States and the biggest U.S. exporter of LNG…
and eventually it would have the free cash flow
                                                       China's natural gas consumption is expected to reach 550
to establish a dividend and begin to repay its         billion to 600 billion cubic metres by 2030, growing at an
debt. This was, on its face, a multi-year time hori-   average annual growth rate of about 11% in 2020 and this year.
zon, as most of our investments are.                   Reporting by Chen Aizhu and Jessica Jaganathan in Singapore,
                                                       additional reporting by Scott DiSavino in New York, Editing by Louise
The reason for the stock’s sudden appreciation         Heavens and Emelia Sithole-Matarise
after 2 ½ years of nothing is that Cheniere has
finally reached this eventuality: after having completed $30 billion of plant & equipment expenditures, it
now has less than $500 million remaining. That means that free cash flow is about to rise sharply. Several
weeks ago, the company stated that it now intends to repurchase, each year, $1 billion of stock and, until it
obtains an investment grade rating, $1 billion of debt. It also initiated its first dividend. The yield is about
1.3%, and it intends to continue raising it. Those figures alone – the $2 billion of debt and stock repurchases,

  1
      Source: Bloomberg

© 2021 Horizon Kinetics LLC ®                                                                                     Page | 3 of 28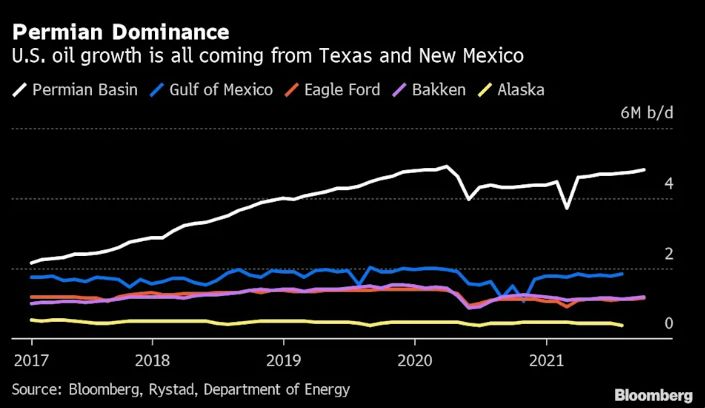
MARKET COMMENTARY
3rd Quarter 2021                                                                            October 2021

plus the dividend yield – amount to about 9% of the market value of the company per year. That’s the
expected base financial return going forward, even without any growth. Not many companies can say that.

But there will be growth. Two expansion projects, one to
be completed by mid-2022, are expected to increase
capacity by over 25%. LNG is a preferred replacement for
dirtier fuels – not only coal and oil, but wood and refuse –
and is a necessary transition fuel for industries and
countries pursuing lower carbon-intensity energy. Almost
50% of U.S. LNG exports go to Asia, including India. The
U.S. Energy Information Administration (EIA) presumes a
large and growing export market for domestic LNG.

Also to be expected are valuation increases, which not
many other companies can say either: Cheniere estimates
its distributable cash flow in 2021 at about $2 billion, while
its market cap is $26.3 billion, so it trades at only 13x
current free cash flow, despite being up 75% this year.

By investing on the basis of anticipatable developments
well beyond the standard one-year time horizon, we could
purchase an unusually reliable future cash flow stream at an extreme discount. That discount was available
to us only because we were willing to take on time risk (which is to say short-term relative-return shortfalls
versus the S&P 500). It also provided a portfolio with a return vector that isn’t in the S&P 500. And, even
three years in, Cheniere is still a ‘new idea’.

Not ‘Pushing Back’ about Inflation, Anymore. Now Interested in How Much Inflation and How to Hedge.

This question has some resonance with the previous ‘new ideas’ question: as to investing time frame,
foreseeable results, and investing in advance of generally recognized change. I’ll discuss a couple of new
holdings in that context, too.

One reason some people no longer resist the idea of inflation is because they’re hearing about it in the
news. Others have begun to notice it in their daily lives. You, this audience, are well aware that we’ve been
writing for some years about observable conditions that were creating serious inflation risk. The most recent
extended discussions were in the March 2020 and June 2020 Quarterly Reviews. But the media made no
such mention of inflation at the time; in fact, their concern was deflation.

Suddenly, though, inflation news is everywhere. When I was a kid and I’d eagerly bring home some new
wisdom a friend gave me, my mother would sometimes ask, with that pointing-out-a-lesson tone, why that
friend’s advice seemed so compelling, whereas she had told me the very same thing many times before. In
part, it was because my friend passed on this wisdom – which wasn’t new at all, only to him – in a breathless,
excited tone, or maybe in an intriguing conspiratorial whisper. It just seemed more revelatory.

© 2021 Horizon Kinetics LLC ®                                                                        Page | 4 of 28
MARKET COMMENTARY
3rd Quarter 2021                                                                                 October 2021

The thing about financial news is that it’s not investment research. It’s so important a point that it can’t be
overstated. It’s not to knock them; they’re simply in a different business – with different goals and skill sets.
Just understand, that however it sounds, there is no analysis. There is some excellent breadth of content.

It often contains a fact or quote about an issue
I hadn’t thought about and which instigates me
to actually research the topic. But the content
is of the moment, it’s about what’s happening
now, how prices changed overnight or during
the day, it’s about what is being said and by
whom.

What did two different Fed governors say
about interest rates, what does the head of the
European Central Bank say, what does the Chief
Economist at Bank of America say? What are
some recent statistics about gasoline prices, and      Conditions Before the Pandemic: Already Poised for Monetary
how long are the lines at European gas stations?       Debasement and Inflation
What does Putin say?
                                                       Following the Credit Crisis of 2008/2009, the Federal Reserve
                                                       never let go of the easy money policy it properly engaged in to
The pointed question is, how does that help you        support the financial system.
implement an investment decision in an
informed, forward-positioning way?                     As to inflation, it has been heading down for over 3 decades.
                                                       There were reasons.
Financial news is impressionistic, emotive and
                                                       First, was the exporting of Inflation. In the mid-1990s, U.S.
suasive, like my knowing childhood friend. So, its     companies began to make use of a global cost arbitrage by
perspective also changes, by the day and by the        shifting production and employment to lower-wage nations
price and by the latest interview, even though         around the world, initially and especially to China. Ergo, Apple
fundamental conditions build and change slowly.        Computer’s renowned global supply chain management
                                                       network. It reduced domestic price pressure, counteracting the
So, I’m going to try to make my responses sort of      Fed’s inflationary monetary policy.
impressionistic, too. With lots of exhibits.
                                                       Other inflationary risks besides money creation were building,
                                                       too. There was the half-decade-plus of reduced exploration
Why can the coming inflation be severe?                expenditures by the world’s energy and mining companies. Oil
One critical reason, among three of them, is           had been $100/barrel for several years through 2014, and gold
energy prices: for oil and gas, and coal as well.      and silver prices had been falling since about 2012. What such
(The other two inflation factors are: other critical   companies do when they don’t anticipate receiving an adequate
                                                       return on new capital investments at prevailing prices, is they
commodities and, of course, what is now
                                                       reduce or eliminate new development. They continue to
runaway monetary policy.)                              produce from existing wells and mines, but they are actually
                                                       depleting their reserves. As a consequence, eventual supply
To be clear about the importance of energy             shortages, with the attendant price pressures, could be
prices, those are the key commodities in every         anticipated. That’s the way it works in the commodities
nation, and they are in everything. Not just           markets.

© 2021 Horizon Kinetics LLC ®                                                                               Page | 5 of 28
MARKET COMMENTARY
3rd Quarter 2021                                                                           October 2021

electric power and home heating. Without them as raw materials, catalysts or heat sources, there is no
steel, no plastic, no aluminum, no copper, no cement or lithium. No semi-conductor wafers, whether for
solar panels or for microchips for automobiles.

It’s important to understand why there will be structural shortages of oil and gas. Two mutually potentiating
trends, like tributaries merging to make a river,
plus one intervening event, ensure that very
shortly oil and gas prices might spike high
enough to disrupt discretionary income, impact
GDP statistics and economic policies, and even
be a little scary.

The first trend, which we’ve written about for
years, now, is the 2014 to 2019 decline in
exploration and development expenditures by
the major energy companies. This discretionary
asset allocation decision began when oil
dropped from its then-normal $100+ per barrel
to the $50 to $60 range. The companies just
didn’t like the expected return on investment at
those prices. Which means that they stopped
fully replacing the reserves that they pumped
out every year. In 2014, there was excess
production capacity, but by 2019, Chevron and
Royal Dutch Shell were replacing only roughly
half of their output. By 2019, there was
insufficient capacity, but no one knew it yet.
They still don’t, really, because although the
demand and supply curves have been
approaching one another, they haven’t yet
intersected decisively.

The intervening, potentiating event was
demand shock from the Covid-19 pandemic.
The cessation of a good portion of travel activity
led to a 25% drop in oil consumption. Many
energy companies failed, and even the
financially able ones slashed their capital
expenditure plans yet further. Chevron’s 2021
capital spending will be 60% lower than in 2014.

© 2021 Horizon Kinetics LLC ®                                                                       Page | 6 of 28
MARKET COMMENTARY
3rd Quarter 2021                                                                               October 2021

That Chevron figure is a measure of future supply insufficiency. A measure of current insufficiency is the
Baker Hughes Worldwide Rig Count. It averaged 3,578 in 2014. This year, through September, the count is
1,302, 64% lower. Concurrently, demand today is 5% higher than in 2014, and the U.S. EIA estimates that it
will be above the 2019 level next year. You can see the several-year disconnect, as excess supply reverted
toward a deficit while global demand inexorably increased. You can see where this is going.

Trend 2 is the decarbonization trend, which in the                            Supply         Demand           Price
investment world is represented by the Go Fossil Free                          Baker                           Avg.
divestment organization 2. Go Fossil Free has persuaded                     Hughes Avg.      Global Oil       Brent
over 1,300 institutions, ranging from financial companies to                Worldwide      Consumption        Crude
                                                                             Rig Count     (mill bbl/day)    ($/bbl)
investment managers to pension funds, to divest fossil fuel                                     92.7           $99
                                                                 2014          3,578
holdings, whether held directly or by selling funds that hold    2015          2,337            94.9            52
them, or by withdrawing financing services. These
                                                                 2019            2,177           99.7          64
commitments, which can be multi-year in nature, well
                                                                 2020            1,352           91.0          42
exceed $10 trillion. Energy companies that might wish to,                                        97.5          78
                                                                 9/30/21         1,302
can no longer raise equity or debt capital to fund additional    Est. 2022         ??            101           ??
reserve replacement.                                             Source: https://rigcount.bakerhughes.com

Meanwhile, global energy consumption is largely a function
of population growth and rising standards of living in less-developed nations (more of which below). The
supply and demand lines will intersect soon, if they haven’t already.

Why will the energy price reaction be severe?
Two reasons. One, is that supply can’t just be increased in the short term on any sustainable basis; it’s not
like turning on a water tap. As just mentioned, there are hardly any sources of financing for those energy
companies that would require it.

And for those companies that do have sufficient cash flow to expand their operations – assuming,
argumentatively, that they would even wish to do so and would even be issued the necessary leases and
permits – there isn’t even the development infrastructure to support it. The industry requires specialized
equipment and services. Those suppliers have also drastically reduced their size, just to survive. A ready
reference point is Schlumberger (SLB), the world’s largest oil service company. Its tangible balance sheet
assets are 45% lower than in 2014.

Nor is it to be assumed that the energy companies wish to expand. They are under great political and
regulatory pressure to reduce the scope of their activities. Frankly, I think they have no intention of spending
more, even without that pressure. To be realistic, what do you think the CEO of an oil company really thinks
about when considering the profit impact of an impending supply shortage? Anxious? Or delighted? Higher
prices bring incremental revenue without any incremental cost, which means pure pre-tax profit.

  2
      https://gofossilfree.org/divestment/commitments/

© 2021 Horizon Kinetics LLC ®                                                                               Page | 7 of 28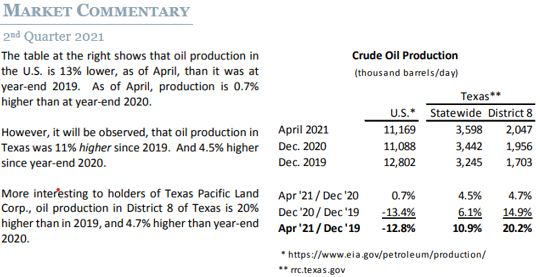
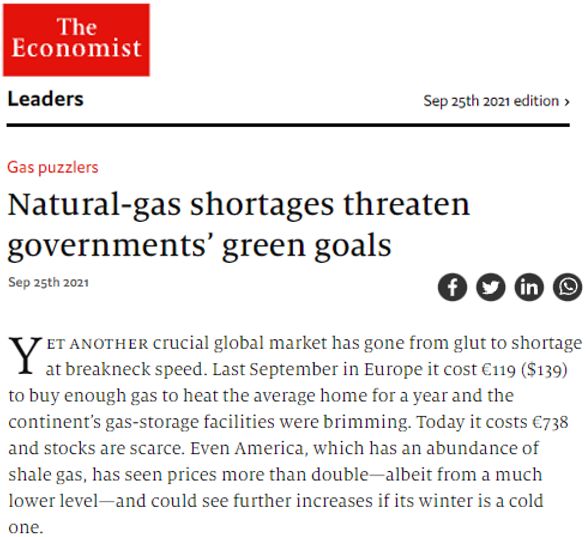
MARKET COMMENTARY
3rd Quarter 2021                                                                          October 2021

The same rejoinder applies to questions about whether Saudi Arabia might ‘step up’, which we’ve heard.
They’ve suffered huge budget deficits in recent years, with attendant severe cuts in municipal services and
infrastructure spending. Governments don’t like that. The recent oil price rise has been a boon for them.

The second reason the price reaction could be severe: demand-inelasticity. That’s what oil and gas are:
when you need to fill your gas tank to get to work, you need it not just that day, but that hour. Cooking
dinner? You need the power then, not the next morning. Air conditioning and heating are discretionary, to
a degree (so to speak). The moment when the price of gasoline or natural gas or heating oil is suddenly up
100%, is when there will be no more ambiguity about how price is what determines is what sets a new
supply-demand equilibrium if there isn’t any extra supply. That can happen very suddenly.

It’s already happened with natural gas, which has
been front and center in the news lately. In the U.S., the price is up 113% this year. That’s the thing with
the current-moment aspect of financial news: first a topic is nowhere to be found, right? Then it’s
everywhere.

In Europe, the price of natural gas is up 270% since March. There are innumerable articles with many
different attributed causes, and each of them surely had some impact. But primarily the news commentary
is about current and transitory events: supply chain issues; oil truck driver shortages because of the
pandemic or because of Brexit; Putin.

© 2021 Horizon Kinetics LLC ®                                                                      Page | 8 of 28
MARKET COMMENTARY
3rd Quarter 2021                                                                          October 2021

The major causal element, though, has been almost a decade in the making. Almost all natural gas is what
is termed ‘associated’ gas, meaning it is a byproduct of oil production. A consequence of the capital
allocation decision by energy companies to do less drilling is that less natural gas is available.

That supply shortage is exacerbated by another problem, which is that there is nowhere near as much
natural gas storage capacity as oil storage. Gas occupies a lot of space. The standard reference unit, which
is 1,000 cubic feet, would occupy a cube that is 10 feet on each side. That 1,000 cubic feet of gas contains
about 1 million BTUs. For comparison, a barrel of oil contains more than 5 million BTUs.

To store gas, it must be liquefied.
That has an electric power cost. You
also have to build storage facilities,
but none have been built in the U.S.
for many years. We’re below the 5-
year average for storage going into
winter. That can have dangerous
repercussions, as Central Europe,
where the cold season begins a few
weeks earlier than in the U.S., is
experiencing now. The price of
natural gas futures in Europe is now
equivalent, it seems, to $200 per
barrel of oil.

Be aware that in the U.S., where gas prices are up 47%
since August, people have yet to experience the price
impact. That’s because consumers receive their natural
gas through a distribution company. The utility buys
the gas, but can’t pass through the price change until it
receives a rate increase from the local utility
commission. Consumers who use gas for cooking or
heating will see those rate increases in the coming
weeks and months. It will no doubt be shocking, and
many won’t be able to afford to heat their homes.

© 2021 Horizon Kinetics LLC ®                                                                      Page | 9 of 28
MARKET COMMENTARY
3rd Quarter 2021                                                                          October 2021

As to oil, the same thing can happen. Updating the crude oil
inventory chart from the 4th Quarter Commentary, which
we’ve reprised here, is an accompanying chart as of October
8th. We’ve gone from inventories being above the 5-year
range in December 2020, to now being at the bottom of the
5-year range, as we suggested at the time would occur. That
means no more inventory overhang. It wasn’t current
enough at that time, though, to be ‘news’.

What this means is that increases in demand are shortly
going to meet the supply limitations. It could be weeks,
months, it could be a year, but for any reasonable purpose
other than day trading, it’s soon. And then, what’s
happening now with natural gas is likely to happen with oil.
It will be an oil crisis, which was and continues to be readily foreseeable.

There are many who believe that oil and gas usage will decline meaningfully, if not drastically, in the next
decade or two. This is probably the belief of most investors. How can one tell?

There are only about 10 substantial U.S. energy producers. Based on the consensus earnings estimates by
Wall Street investment firms, 7 of these companies trade at P/E ratios of 12x or less next year’s estimated
earnings. Four of them are below 10x earnings. There does not seem to be a prevailing belief that energy
prices will continue to increase in 2022.

The earnings estimates are essentially an
extrapolation of the September 2021 rates
of production and energy prices into 2022.
For the companies with higher earnings in
2022, that is due to expected increases in
production, not oil or gas prices.

Yet we saw, earlier, the announcement of
the massive LNG purchase contract
between a Chinese natural gas distribution
company and Cheniere Energy. And a
Bloomberg News article dated September 9, Source: Bloomberg
2021, reports that Chinese demand already
exceeds the pre-coronavirus level. In August, Europe experienced its highest gasoline consumption in 10
years. They are just momentary observations, of course.

Unfortunately, the more fundamental evidence doesn’t support that hope that global energy use will
decline meaningfully in the foreseeable future. The global population increases by about 1.1% each year.
Each of those 80+ million people uses energy. The standard of living differential between economically less
developed countries and the more advanced economies is stark, and standards of living do rise, which
entails more energy consumption.

© 2021 Horizon Kinetics LLC ®                                                                     Page | 10 of 28
MARKET COMMENTARY
3rd Quarter 2021                                                                                          October 2021

Here are a couple of ways to understand that. One is more categorical, the other is more specific.

From among the 190-odd nations in                                   GDP per Population    % of             % of per-capita GDP of
the world, this table is a sampling of         Nation                Capita     (mill.) World Pop         U.S. Canada S. Korea
the more populous poorer nations. It           South Africa        $ 12,032        60
                                               Iraq                  10,003        41
is obviously only a small proportion.
                                               Uzbekistan             7,449        34
This sample of only 19 countries               Angola                 6,932        34
contains 35% of the world’s                    India                  6,461     1,393
population, yet has only 9% of the per-        Ghana                  5,693        32
                                               Bangladesh             5,307       166
capita GDP of the U.S., and 15% of
                                               Myanmar                5,242        55
South Korea’s. Add in China, and over          Nigeria                5,187       211
50% of the world, on a population-             Pakistan               5,150       225
weighted basis, has only 16% of the            Kenya                  4,926        55
                                               Sudan                  4,098        45
U.S. per-capita GDP and only 25% of
                                               Nepal                  4,061        30
South Korea’s. Those populations,              Ethiopia               2,908       118
even if they weren’t to expand (but            Tanzania               2,821        61
they are expanding), spell increasing          Afghanistan            2,390        40
                                               Yemen                  1,927        30
energy consumption for the globe as
                                               Mozambique             1,277        32
their standards of living rise.                DR Congo               1,106        92
                                                Weighted avg.            5,670         2,754       35%    9%      12%      15%
These next few figures are a way of
translating those generalized standard         China                    17,192         1,444       18%    29%     37%      44%
of living numbers into the implications         Weighted avg. $          9,633         4,198       53%    16%    21%       25%
for energy consumption specifically.           Source: worldpopulationreview.com; fingers on calculator
According to the EIA 3:
       -   The U.S. used about 848,000 BTUs of energy per person per day in 2018. That’s equivalent to the
           energy in about 7 gallons of gasoline.
       -   In India, the figure is 63,000 BTUs per day, and there are poorer countries, still.

Similarly illuminating figures can be found for the proportion of the global population without access to
electricity, or that just 8% of the 2.8 billion people living in the hottest parts of the world have air
conditioning. 4

Those two demographic factors – population growth and standard of living improvements – are the primary
reason why global energy consumption projections by any institution qualified to make such assessments
are much higher in the decades to come. The question of the day, of course, is what sources will comprise
that energy, and with what net greenhouse gas emissions?

  3
      https://www.eia.gov/international/data/world/other-statistics/energy-intensity-by-gdp-and-population
  4
      Air conditioning use emerges as one of the key drivers of global electricity-demand growth - News - IEA

© 2021 Horizon Kinetics LLC ®                                                                                       Page | 11 of 28
MARKET COMMENTARY 3rd Quarter 2021 October 2021 Something to Come to Terms With This projection by the U.S. Energy Information Administration is only for the U.S., which has been making progress in reducing per-capita energy consumption. The EIA is not thought to be antagonistic to the policy goals of shifting away from fossil fuels and toward renewable energy sources. Their various scenarios for energy use going forward include factor models whose comprehensiveness can only be appreciated by reading them. Among the many factors, they include estimates for the pace of green energy technology improvements and cost declines, the change in the energy efficiency of commercial buildings due to improved technology and regulations, and plant-by-plant retirements of coal and nuclear facilities, and their replacement by more efficient gas turbines. Nevertheless, over the next 30 years, the only prediction for oil use is that it will range from flat to rising, depending on the scenario. Natural gas production is pro- jected to expand meaningfully over the next 30 years, in the EIA’s base, or reference, case, and trend only modestly lower in their low case. As a separate note for those with an interest in TPL, even in the low-produc- tion case, the EIA projection suggests little reduction of volume from “tight/shale gas” (the green infill in these two charts), which would include the Permian Basin, even as other sources of U.S. gas decline. © 2021 Horizon Kinetics LLC ® Page | 12 of 28
MARKET COMMENTARY
3rd Quarter 2021                                                                               October 2021

Of course, energy is not the only source of
commodities inflation. There are others, as
well, and the results have finally invaded the
Consumer Price Index, which has been making
the news lately. This, too, was readily
anticipated last year, but it was not news
because it hadn’t yet, well, impacted the CPI.

The purpose of being able to observe such
information in advance of its being widely
disseminated is so that one needn’t pay the
premium that develops when more people
become aware of and want the same thing at
the same time – like inflation protection.
Because, at some point, they will pay a premium
for it. We want to own those instruments first.

And Other Commodities
For example, accounts in some strategies hold
an iron ore royalty company called Mesabi
Trust. Iron ore prices are up quite a bit in the     Moderator: The next question is still on inflation vs. deflation.
past 2 and 3 years. Since Mesabi has no em-          The average American, or politician, or investor currently looks
ployees or operations in the formal sense, its       to the reported CPI number, that 2% figure, and those still do
distributions are close to a direct pass-through     not reflect meaningful inflation. At what point, when and what
of royalties received.                               catalyst do you think will lead to a consensus arising to our
                                                     point of view?
Therefore, whatever its dividend yield looked
                                                     Murray Stahl: Well, it’s impossible to know what the rate of
like when we bought it might have no
                                                     inflation is going to be. But I can tell you this, that the
resemblance to what it could be when ore
                                                     commodities we rely on for our standard of living, they’re just
prices or volumes rise. That is very different       not being produced in sufficient quantities. There’s another
than for a typical operating company, since          way to understand the low CPI phenomenon and inflation risk,
operating costs can rise, and management             which is to look at the last 10 years.
might have other uses for the cash flow than
                                                     Even with the global manufacturing outsourcing trend, the
just paying it out. For instance, if you looked at
                                                     global labor cost arbitrage, the enormous decline in interest
any financial website on October 11th, Mesabi’s
                                                     rates, and the massive declines in commodity prices, even with
dividend yield was shown as 4.0%. However,           all of those really significant factors that served to lower
that week, it raised its distribution for most       production costs, and even with the way the government
recent quarter by 500%.             The dividend     under-calculates it, we’ve had 2% inflation. So, what’s going to
payments are quite uneven from quarter to            happen if you get a surge, or just a recovery in commodity
quarter, but the trailing four quarters yield is     prices? What do you think the CPI numbers are going to be?
now 8%, not 4%.

© 2021 Horizon Kinetics LLC ®                                                                           Page | 13 of 28
MARKET COMMENTARY
3rd Quarter 2021 October 2021
One can readily see the Price Changes in Some Other Hard Commodities
participation mecha- As of October 15, 2021
nism that a royalty com- 1 Year 2 Years
pany provides in an in- Silver -5% 32%
flationary environment. Copper 54% 81%
Iron Ore -2% 26%
Mesabi has only a $470
Lithium Carbonate 324% 180%
million market value, so Platinum 23% 19%
is more suitable for Aluminum 71% 83%
smaller-cap strategies. Zinc 56% 57%
But an Australian iron Nickel 26% 16%
ore royalty company, Cobalt 69% 56%
Molybdenum 116% 65%
Deterra Royalties Ltd, is
Neodymium 84% 101%
intended to serve the
Source: TradingEconomics.com
same purpose for larger-
cap strategies.
And it’s not just the hard commodities. Large-scale price Prices, Weeks ending Sept. 10, 2021 vs. Sept. 11, 2020
increases have been showing up in consumer goods and 2021 2020 Change
foods. Here’s a selection of this year’s price changes in 3-lb. bag of Fuji apples $3.74 $2.52 48%
a variety of fruits and a few vegetables. I suppose if you 3-lb bag of Ginger Gold apples 3.23 3.09 5%
3-lb bag of Granny Smith apples 3.99 2.54 57%
just buy lemons, you haven’t noticed much. If you like
96-oz container of apple juice 6.99 2.40 191%
grapefruit, you have. 1 Hass avocado 1.06 0.98 8%
6-oz package of blueberries 3.07 2.49 23%
When thinking about making actual investments in what 1 Grapefruit 2.00 1.04 92%
are generally termed inflation beneficiary securities, 1 lb. white seedless grapes 1.83 1.56 17%
one should bear in mind that even as financial news fills 1 Honeydew melon 3.82 2.99 28%
1 lemon 0.57 0.53 8%
with talk of how to hedge against inflation, and use the
1 mango 1.00 0.97 3%
same terminology, they will not be speaking about the 1 lb. Bartlett pears 1.34 1.33 1%
same investments we are. Business models like Clarkson 1 lb. D'Anjou pears 1.63 1.14 43%
PLC or Mesabi Trust or TPL don’t even exist in the 6-oz package of raspberries 3.00 2.83 6%
indexation world (though TPL is beginning to). They are 1-lb package of strawberries 3.00 2.54 18%
referencing the business models and securities they 1 Cantaloupe 3.00 2.76 9%
4-lb. bag Valencia oranges 6.99 4.99 40%
know, and via the tools and mechanisms they know,
1 lb. red dry onions 1.07 0.98 9%
which are for the most part the standard capital- and
1 lb. beets 2.14 1.50 43%
employee-intensive business models in the standard 1lb. Brussels sprouts 2.65 2.33 14%
indexes. Source: U.S. Dept. of Agriculture, National Retail Report
I typed “inflation investing” into my web browser, and this is much of what came up in a half-dozen investing
magazines, financial news websites, and interviews with investment managers. I wrote down pretty much
the entirety of the substantive comments that were made about why each of these were chosen as inflation
hedges. You might make a tally of any mentions about valuation, balance sheet structure, cost structure,
© 2021 Horizon Kinetics LLC ® Page | 14 of 28MARKET COMMENTARY 3rd Quarter 2021 October 2021 free cash flow, reinvestment requirements or substantive competitive risk for any of these businesses. It has a bit of a stream-of-consciousness flow: Semiconductor companies, because there’s a chip shortage and there will be a lot of domestic construction of fabrication plants; PayPal, because business is booming and their fees are based on the payment volume on their network; Apple and Amazon, because people are still lining up to buy new iPhones and order items on Amazon Prime; the Basic Materials sector because they provide the world with what it needs, via manufacturing, mining, paper, chemicals or metals; the Consumer Staples sector, because these are items that consumers will continue buying during a recession, like food, beverages and household products; Costco, because with low customer costs, it maintains 90% loyalty among its 100 million membership customers, and is growing its online presence; Netflix and Chipotle, because sales are growing rapidly and they’ve been successful in raising prices to consumers; an apartment REIT, because rents can be raised; J&J Snack Foods which makes and distributes food to food service and supermarket companies, because its earnings forecast is up 6.8% over the past 60 days and this year’s earnings growth rate is 182%; GoldMining Inc, because its earnings are up 650% in the past 60 days and this year’s earnings will be up 466.7%; Citigroup, because it would earn more on its deposits if interest rates rise, and it sells below book value; ConocoPhillips, because it’s a beneficiary of higher oil prices, and the stock yields 2.7%; Coca-Cola, as an economy reopening play as travel, restaurants and sports venues reopen, plus it yields 3.2%; TIPS inflation-linked bond funds; the SPDR Gold Trust ETF; the iShares BBB Rated Corporate Bond ETF (LQDB), which just holds the BBB component of the bond market, so you're getting exposure to investment grade corporate bonds and at least getting a yield in the 2% range; and, yes, Bitcoin and Ethereum, too. You will note, as I hoped you might, no mention of Coca-Cola’s sugar or aluminum or fuel costs. Or what happens to Citigroup’s long-term loan values, like for mortgages, if interest rates rise. Let me not overstep the bounds of professional propriety and mutual courtesy. There are a great many ways to invest successfully, and there are very talented professionals doing it very well. The point here is that the above notions about investing in an inflationary environment were not drawn from such sources; they were effortlessly skimmed from ‘the financial news’, which is the motif running through this presentation. It cost very little to obtain, and took very little time, and likewise the information content cost very little to produce and took very little time. Before we move on to TPL, I feel compelled to address any misconception that this discussion is in any way antagonistic to or dismissive of the aims and exigent necessity of addressing climate change and all that it entails. Reasonable minds may, and do, differ on strategies and approaches and policies, but that is something else. I recently downloaded the 3,949-page IPCC Climate Change © 2021 Horizon Kinetics LLC ® Page | 15 of 28
MARKET COMMENTARY
3rd Quarter 2021                                                                                      October 2021

2021 Assessment Report. 5 This is the 6th such
report by the IPCC (Intergovernmental Panel
on Climate Change), which is a joint program
of the U.N. and the World Meteorological
Organization, created in 1988, to assess the
science related to climate change. IPCC
volunteer scientists review the thousands of
scientific papers published yearly in an
attempt to create a comprehensive
understanding of what is known about the
state of climate change, its detailed causes
and impacts, and how adaptation and
mitigation can reduce those risks. Adequate
and valid data is a pre-condition for making
effective policy. The report has 15
Coordinating Authors, 76 Drafting Authors
from roughly 22 countries, and 39
Contributing Authors.

I have only read the introductory 42-page
Summary for Policymakers, and I commend
that to anyone who might wonder if there is
sufficient     evidentiary    backing     for
understanding what is occurring globally. I
daresay there are uncountable environmental
crises unfolding, including rapid loss of
biodiversity, but which haven’t yet reached a
critical mass or disambiguated into chaotic
disruptions that become experienced crises of
and threats to daily life.

These developments must ultimately affect
national wealth and its distribution profile,
corporate earnings, and price levels. When we
discuss investments in these reviews, it isn’t
about believing or not believing. Our goal is to

  5
    https://www.ipcc.ch/report/ar6/wg1/downloads/report/IPCC_AR6_WGI_Full_Report.pdf
  IPCC, 2021: Summary for Policymakers. In: Climate Change 2021: The Physical Science Basis. Contribution of
  Working Group I to the Sixth Assessment Report of the Intergovernmental Panel on Climate Change [Masson-
  Delmotte, V., P. Zhai, A. Pirani, S. L. Connors, C. Péan, S. Berger, N. Caud, Y. Chen, L. Goldfarb, M. I. Gomis, M.
  Huang, K. Leitzell, E. Lonnoy, J.B.R. Matthews, T. K. Maycock, T. Waterfield, O. Yelekçi, R. Yu and B. Zhou (eds.)].
  Cambridge University Press. In Press.

© 2021 Horizon Kinetics LLC ®                                                                                  Page | 16 of 28
MARKET COMMENTARY
3rd Quarter 2021 October 2021
protect our and our clients’ capital – which ultimately is retirement capital and transgenerational savings –
from being harmed by such changes, which also means in purchasing power terms. That greatest historical
risk to portfolios – the loss of purchasing power from debasement due to inflation and currency devaluation
– is NOT discussed in the investment news media, because it is a problem of years and decades, not of today.
The true risk has never really been the daily or year-to-year price volatility of securities.
In that effort, we want to cover important contingencies – the essential purpose of proper diversification –
and we believe the types of business models increasingly populating our portfolios will serve that function.
The TPL Questions: How long-lived
are the assets; how much of the
resources have been explored; and
when will production and other
activities develop further?
A picture might be a good place to
start. This is a different representa-
tion, same results, of our own set of
tables used in the 2nd Quarter 2021
Commentary. It shows that in the
past 4 ½ years, pretty much all of the
increased oil production in the U.S.
has come from the Permian Basin, which is where the TPL royalty and surface acreage are located.
You can get the
same data yourself
if you were to go to
the Texas Railroad
Commission web-
site 6 and compare
the production fig-
ures for December
2019 to now, for
District 8, where the
TPL assets are lo-
cated. You would
compare the Dis-
trict 8 volumes with
the balance of
Texas and the U.S. You could then update those tables, which ended at April 2021:
6
https://www.rrc.texas.gov/media/damhcirs/own423_20210916_rrc180_jul2021.pdf
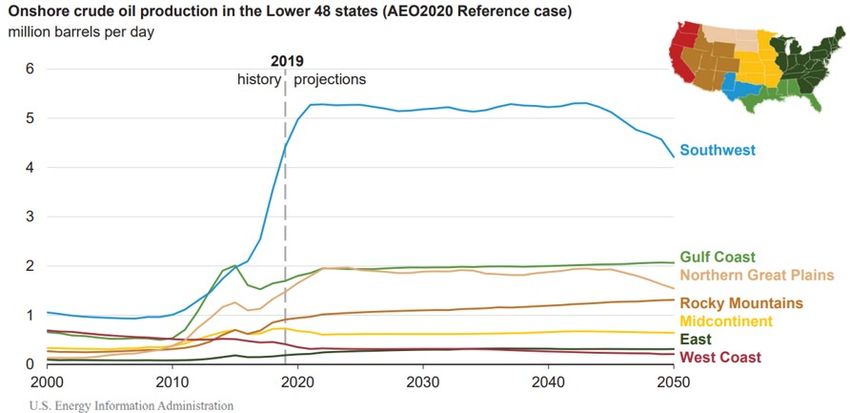
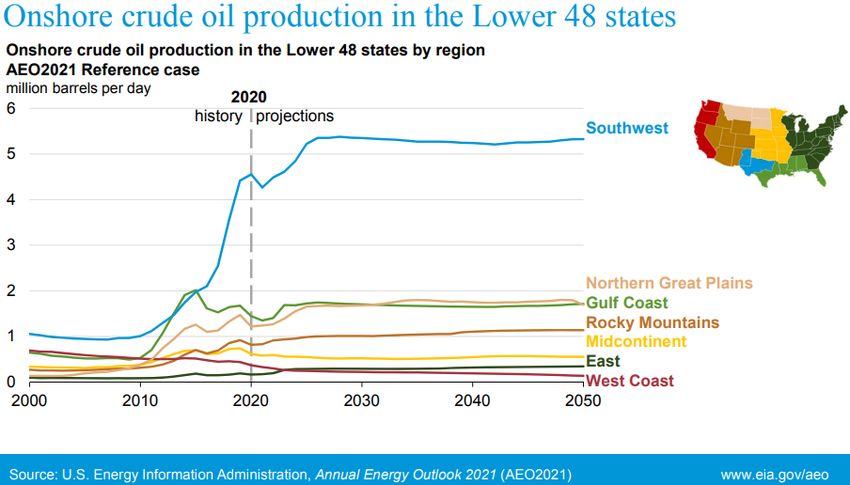
© 2021 Horizon Kinetics LLC ® Page | 17 of 28MARKET COMMENTARY 3rd Quarter 2021 October 2021 A related projection by the EIA through the year 2050, shows the sources of oil production in the U.S. The blue production volume line represents the blue Southwest region on the accompanying map. The Southwest region encompasses the Permian Basin, and is projected as the only source of additional oil supplies in the next 30 years. The volume rises for some period of time and then remains steady. The most interesting aspect of this chart is not on the chart itself, but is in its compari- son to the very same chart that we used 12 months ago in last year’s 3rd Quarter Commentary. In the 2019 version, oil pro- duction from the Per- mian Basin region was projected to begin to decline between 2040 and 2050. This year’s projection, despite the advances in renewable energy projects and technologies and expectations for their continued deployment, revises the tail end of last year’s long-term oil demand curve upward. And one more chart, on the next page, which is the same 30- year projection, ex- cept for natural gas rather than oil. In this case, the Southwest region accounts for substantially most, in- stead of all, of the in- crease in projection. On the other hand, to- tal production almost doubles from the current level. These charts are one way to infer how long-lived TPL’s resources are and what the direction of production will be. More specifically, TPL’s 2021 earnings will be generated based upon production from approximately 10% of its royalty portfolio. Approximately 90% of the company’s reserves are undeveloped, and the remaining reserve life is estimated at 40 to 60 years (at current production levels), which is 2 – 3x the reserve © 2021 Horizon Kinetics LLC ® Page | 18 of 28
MARKET COMMENTARY
3rd Quarter 2021                                                                            October 2021

lives of most of the production companies and other royalty companies in the region. It should be borne in
mind that is based upon the current knowledge of the entire region, only a portion of which has been
actively explored, and on current drilling technology, which constantly improves. It could be fairly suggested
that the current earnings of the company employ materially less than 10% of the potential for surface land
and water resource, given the nascent stages of infrastructure development in the region.

Another way to get a sense of what TPL’s development activity might
look like going forward is from the expectations of a highly informed
party in that region – an insider that also has substantial capital at risk.
In March, Chevron, one of the several major operators in the Permian
Basin, provided a revised view of its capital spending plans there for
the next 5 years, along with its expected free cash flow generation and
its expected production volumes.

Chevron unambiguously anticipates very large cash earnings,
recouping its capital investment costs within about a year, and almost
doubling production over the 5 years. These projections were based
on $50/barrel Brent oil. The equivalent West Texas Intermediate
Crude oil price at the time would have been about $47. This past
Friday, WTI was $82.

© 2021 Horizon Kinetics LLC ®                                                                       Page | 19 of 28
MARKET COMMENTARY
3rd Quarter 2021                                                                             October 2021

The Other TPL Questions:
Why is TPL is better than other Permian Basin companies, including the likes of Chevron? How are the various
energy companies in the region reallocating assets or positioning themselves?

Different energy companies are making different decisions in a rapidly changing political, regulatory and
energy environment. All now have to demonstrate some meaningful actions with respect to their carbon
footprint. Depending on each company’s orientation, they are engaging to greater or lesser degrees in green
energy projects, from solar and wind power to carbon capture and battery technology. They are engaged in
projects to detect and limit methane emissions and to reduce the flaring of natural gas; they’re electrifying
their vehicles and equipment. The same kinds of changes will be found among mining companies. It may
well be that some or much of this is ‘window dressing’ to satisfy criticism; it is quite easy for a company that
generates $10 billion of annual earnings to make much ado about $200 million of such investment. But
many of these investments are substantive.

Energy companies are also reassessing their resource portfolios. Some have been net sellers of reserves,
presumably the least productive or dirtiest, or those that are otherwise productive but are of less strategic
advantage, in order to reinvest in green energy initiatives to try to transform their overall profile. Others
have made significant asset sales from their portfolios simply in order to reinvest them in other energy
resources that they find more strategically valuable. Both Chevron and ConocoPhillips have taken this road,
making the Permian Basin a major strategic concentration. A few prominent examples:
-   In October 2020, at which time ConocoPhillips had about 150,000 net acres in the Permian Basin, it paid
    $13 billion for Concho Resources. Concho had 550,000 net acres there, and particularly in the Delaware
    Trend portion of the Permian. Concho itself had been an aggressive acquirer of other Permian based
    companies and properties in order to build that resource portfolio.
-   A year later, this past September, ConocoPhillips paid $9.5 billion for 225,000 net acres in the Permian
    from Royal Dutch Shell. That acreage had the very valuable additional character of being largely
    adjacent to or contiguous with ConocoPhillips acreage. From a return-on-investment perspective, this
    can provide extremely significant operating synergies and savings. Among the many is erasing the
    border between contiguous properties. Think of a horizontal well that is 5,000 feet in length, but must
    stop short at the property line of another operator; combine the two properties, and that well can be
    extended another 5,000 feet.
-   Similarly, in April, Pioneer Natural Resources paid $6.4 billion to buy DoublePoint Energy. DoublePoint
    owned over 1 million net acres in the Midland Basin portion of the Permian, also largely contiguous and
    geographically complementary to Pioneer’s properties.
-   Six months earlier, in October 2020, Pioneer paid $4.5 billion to acquire Parsley Energy. Parsley owned
    930,000 net acres in the Permian with, as the Pioneer announcement included: “no federal acreage”.

That speaks to how energy companies in the region are positioning themselves. As to why TPL is better,
which is a way of asking why we selected TPL over Chevron or ExxonMobil, let’s just summarize the essential
differences between a royalty company and an operating company. These are hardly the only ones – we’ve

© 2021 Horizon Kinetics LLC ®                                                                         Page | 20 of 28
MARKET COMMENTARY
3rd Quarter 2021 October 2021
already covered, for instance, the vulnerability of a large asset base and workforce to inflation. But these
are some of the very first differentiating business considerations:
- A royalty company receives a percentage of the revenue an operating company generates from a given
property. There is no associated capital expense or operating expense. It is simply a pass-through.
- Before a single barrel of oil can be produced, the operating company must raise and then expend a
large amount of capital in order to buy a property. Before doing that, it must secure a lease and the
relevant permits, which might require substantial time and expertise, which entails expense. And even
before doing that, it must spend sufficient money on exploration, or purchase that information from a
third party that did such exploration, to even determine that this is a property it wishes to acquire. The
energy company must then buy the equipment, establish the workforce and then drill and operate the
well.
- A glance at the Chevron slide seen earlier shows just how many billions of dollars of operating income
the company expects to make from its Delaware Trend investments, despite the enormous costs. But
those costs measure in the billions of dollars as well. The royalty company doesn’t have those costs.
The difference equals profits, and that differential is, well, enormous.
The question might also have been intended to include other energy royalty companies. Here, too, TPL
has an incomparable advantage.
TPL was granted its land position and mineral rights well over a century ago. Those will serve it for many
decades, even generations. Other royalty companies, which typically have reserve lives in the 10– to 15-
year range, must continue to make periodic mineral rights purchases in order to maintain their reserve life
as wells deplete. Indeed, if they do not, those companies will self-liquidate. Therefore, they can’t be
compared, in a simplistic fashion, on standard Wall Street metrics like current yield or price/cash flow
without accounting for that difference.
They also lack the surface acreage position that TPL has – mineral rights are purchased separate from
surface rights – and which is a sub-
stantial source of earnings for TPL.
TPL’s surface acreage and associ-
ated water rights throughout much
of the region ensure that it will par-
ticipate in future infrastructure
development of the Delaware Basin (roads, pipelines, wind and solar projects, real estate), separate from
its oil royalties. A modest example is an excerpt from a recent Chevron presentation speaking to one of its
efforts to reduce its CO2 emissions – buying and building both wind and solar generated power – the kinds
of projects that might require leasing acreage from TPL.
TPL really is a unique asset. That understanding can easily be lost when the analysis is reduced to the snap-
shot numerical comparisons that are typically used to evaluate companies.
© 2021 Horizon Kinetics LLC ® Page | 21 of 28MARKET COMMENTARY
3rd Quarter 2021 October 2021
Grayscale Bitcoin Trust: What about the GBTC discount? (Earlier this year, the Grayscale Bitcoin Trust
began to trade near its NAV, and then at a discount, first as competing bitcoin funds appeared, and then
as regulatory approval of a bitcoin ETF appeared to near.)
This question is much like the opposite one we would receive in prior years, when the question was about
the GBTC premium. When we began purchasing GBTC in 2017, the shares traded at premiums of 50% or
higher. We were asked, ‘Why buy a fund at such a high premium to NAV?’, when that was known to be a
common investment error?
The answer lay in the recognition that bitcoin was not a common investment that could be understood in
the framework of historical stock market experience:
- GBTC was the only publicly-traded, convenient way to hold bitcoin in managed investment accounts.
It was publicly traded, and custodied with the most rigorous protocols available. The premium was
the price for that ready access, security and transaction liquidity.
- Believe it or not, that premium was not large at all; it was actually de minimis. How can a 50%
premium be de minimis? Because the amount of GBTC purchased in a portfolio was itself de minimis
– say, 0.5%, or $500 in a $100,000 portfolio.
- Therefore, the risk/reward tradeoff was, for any practical purpose: near-zero risk vs. unlimited gain.
In the failure scenario, one would lose 50% of an almost meaningless amount of investment capital.
In the success scenario, which would be the rise of an entirely new asset class, the return could be
1,000:1. It could radically change one’s financial life.
- It was perhaps the ultimate inflation hedge, since the chances of its success would be positively
influenced by precisely the economic environment it was devised for: runaway monetary policy and
currency debasement.
Let’s see this in visual form. Oddly, this GBTC discount/premium question fits into As of Premium/
the through-line of this Review: differentiating between events of the moment, Month-End Discount
and the longer-term causal changes that ultimately manifest as current events Jun-17 69%
or news. Jun-18 45%
Jun-19 36%
Here is the premium/discount history, which is what we tend to pay close Jun-20 9%
attention to in ordinary investments like a closed-end bond fund. It starts in mid- 10/19/2021 -17%
2017, not long after we began our first purchases. The premium contracts
inexorably, year by year. All else equal, one lost 86%: going from a 69% premium As of GBTC
to a 17% discount. Month-End Share Px
Jun-17 $ 4.40
Now let’s look at GBTC’s price history for the same dates. The return was 11x Jun-18 8.53
whatever amount was invested in June 2017, despite losing 69% worth of Jun-19 15.13
premium. The tradeoff: trying to get a better price as opposed to getting the Jun-20 9.61
better value (like being penny-wise, pound foolish). But, to understand the value, 10/19/2021 48.81
you had to understand the investment. And the financial news certainly wasn’t
providing you that. It still isn’t.
© 2021 Horizon Kinetics LLC ® Page | 22 of 28You can also read