A bibliometric analysis of the Journal of Transport
←
→
Page content transcription
If your browser does not render page correctly, please read the page content below
Journal of Transport and Supply Chain Management
ISSN: (Online) 1995-5235, (Print) 2310-8789
                                                     Page 1 of 15       Original Research

        A bibliometric analysis of the Journal of Transport
                 and Supply Chain Management

 Author:                           Background: At the start of the 20th century a need was identified for a dedicated scholarly
 Hans W. Ittmann1
                                   journal that would publish research, case studies, new trends, et cetera covering transport,
 Affiliation:                      logistics and supply chain management. The Department of Transport and Supply Chain
 1
  Institute for Logistics and      Management of University of Johannesburg launched the Journal of Transport and Supply Chain
 Transport and Logistics           Management (JTSCM) in 2007.
 Studies (Africa), Department
 of Transport and Supply           Objectives: The purpose of this study is to determine, through bibliometric analysis, what the
 Chain Management, College         impact of the journal is, which is measured over a period of 13 years.
 of Business and Economics,
 University of Johannesburg,       Method: The impact of the journal was determined through a variety of quantitative methods.
 Johannesburg, South Africa
                                   A bibliographic database populated with journal data, was used to visualise co-authorship
 Corresponding author:             relationships using the tool, VOSviewer.
 Hans Ittmann,
 hittmann01@gmail.com              Results: Over the period 2007 to 2019, a total number of 197 articles were published in the
                                   journal. Using Google Scholar, a total of 1987 citations for all the articles published were found.
 Dates:                            The top 10 articles with the highest number of citations are listed with numbers ranging from
 Received: 21 Jan. 2021            27 to 160 respectively. Tables are presented with the most productive authors, the number of
 Accepted: 19 Mar. 2021
 Published: 27 May 2021            articles by authors from local academic institutions, the private and public sectors as well as
                                   the number of articles by international authors. A few co-authorship visualisation maps were
 How to cite this article:         produced which shows ‘clusters’ of research teams, networks or communities.
 Ittmann, H.W., 2021, ‘A
 bibliometric analysis of the      Conclusion: The Journal of Transport and Supply Chain Management has made a significant
 Journal of Transport and          impact over the period analysed as the number of citations and number of abstract and article
 Supply Chain Management’,
                                   views attest to.
 Journal of Transport and
 Supply Chain Management           Keywords: bibliometric analysis; transport; supply chain management; logistics; scholarly
 15(0), a577. https://doi.
 org/10.4102/jtscm.v15i0.577       journal.

 Copyright:
 © 2021. The Authors.
 Licensee: AOSIS. This work
                                  Introduction
 is licensed under the            At the start of the 20th century, several logistics and supply chain management initiatives were
 Creative Commons                 initiated in both government and the scientific environment in South Africa. It gave recognition
 Attribution License.
                                  to the growing importance of this critical field to the economy. A National Advanced
                                  Manufacturing Technology Strategy (AMTS) was developed under the auspices of the National
                                  Advisory Council of Innovation (NACI) for the Department of Science and Technology (Republic
                                  of South Africa 2005a). The strategy recognised the importance of logistics, and one of the
                                  recommendations of the strategy was the establishment of a logistics centre of innovation. During
                                  the same period, the National Department of Transport (NDoT) launched the National Freight
                                  Logistics Strategy (NFLS) (Republic of South Africa 2005b). This strategy was developed to
                                  address the key challenges in this environment as captured in the strategy’s problem statement:
                                     The freight system in South Africa is fraught with inefficiencies at system and firm level. There are
                                     infrastructure shortfalls and mismatches; the institutional structure of the freight sector is
                                     inappropriate, and there is a lack of integrated planning. Information gaps and asymmetries abound;
                                     the skills base is deficient, and the regulatory frameworks are incapable of resolving problems in the
                                     industry. (Republic of South Africa 2005b:4)

                                  Various academic institutions in the country had already established logistics and supply chain
                                  management departments or were in the process of getting these off the ground. During the same
 Read online:                     period, the Council for Scientific and Industrial Research (CSIR) held a workshop on global
                Scan this QR      logistics in cooperation with the Georgia Institute of Technology of the United States (GeorgiaTech)
                code with your
                smart phone or    (CSIR 2002). Local delegates from the South African private and public sectors as well as academics
                mobile device     from several local and international universities attended this workshop and gave presentations.
                to read online.
                                  Finally, the first State of Logistics Survey was published by the CSIR in 2005 (CSIR 2005). This

                                           http://www.jtscm.co.za       Open Access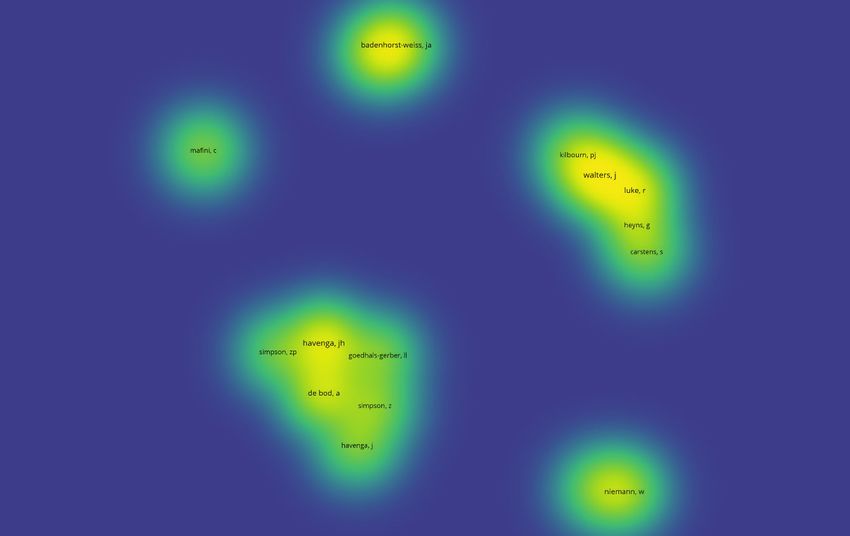
Page 2 of 15   Original Research

survey addressed important issues in the logistics sphere in          a discussion of the analysis in the fifth section and the
South Africa, whilst it contained data on freight in the              conclusion is provided in the sixth section.
country, both on road and on rail. Included as well was the
total cost of logistics for the country, which was presented as       Journal founding, mandate and
a percentage of the country’s gross domestic product (GDP).
After this first survey, it was published annually for 10 years
                                                                      funding
but unfortunately the publication was terminated in 2014.             As indicated earlier, the journal with the title, the JTSCM,
                                                                      was founded in 2007 by the Department of Transport and
The one gap that was still not addressed was a scholarly              Supply Chain Management of UJ. The first editor was
journal dedicated to the field of logistics and supply                Ms Beverly Kujawa from the same department at UJ. In her
chain management. In 2007, the Department of Transport                first editorial, she outlined the purpose of the journal as:
and Supply Chain Management at the University of                          The journal serves as an independent publication for scientific
Johannesburg (UJ) initiated and published the first edition               contributions in the field of transportation and supply
of the Journal of Transport and Supply Chain Management                   chain management, i.e. logistics, operations management,
                                                                          purchasing management, distribution management, warehousing
(JTSCM). This was a timely action by this department.
                                                                          management, transportation (all modes), production planning
Both scientists and practitioners now had a vehicle to                    and related fields. Theoretical, empirical, and applied articles are
publish their research and practical work in a local South                considered for publication. It is the challenge of the Journal to
African journal.                                                          present a diverse range of articles covering a variety of subject
                                                                          matter within the arena of transport and supply chain
This study endeavours to give a detailed bibliometric analysis            management. (Kujawa 2007:1)
of the material that has been published in JTSCM from
volume 1, published in 2007, up to volume 13, published in            An additional field of interest, ‘transport’, was included,
2019, a period of 13 years with 13 volumes. The most recent           broadening the scope and breadth of scientific areas that
volume, volume 20, published in 2020 is excluded from this            could be covered in this new journal.
analysis. The study addresses the following research issues:
(1) What are the number of articles published and the article         Researchers and practitioners, locally and internationally,
citations over the period? (2) Which are the top-cited articles       were invited to submit articles for publication in this new
of the journal? (3) Who are the most productive and influential       journal. The vision was that these would ‘contribute to
authors and from which institutions? (4) What are the                 expertise, growth and productivity in the fields of transport
publication patterns of the journal? (5) What are the main            and supply chain management’. Contributors would be able
topics published in the journal? The overriding objective of          to share the latest research, new trends, important noteworthy
this analysis is to obtain a sense of the impact this journal has     practices as well as case studies with those involved in
had over the 13-year period.                                          these two critical sectors enabling them to stay abreast of the
                                                                      needs, requirements and developments within these dynamic
A journal with a high impact is one that is highly influential        disciplines.
in its field. This is typically denoted by the journal’s impact
factor which is a measure of the frequency with which an              Initially an annual volume, in book form, containing all the
average article in a journal has been cited in a particular year.     articles for the volume of that calendar year was printed and
Citations are thus a critical indicator of impact. The journal        published. From 2012 this changed, and the journal became
will also have an impact if there are articles that influence         ‘open access’, with articles published on a continuous basis as
government policy in both the transport and supply chain              soon as the article was accepted for publication. All previous
management fields. Issues that would be of interest is to             articles were also made available in this manner (see https://
determine whether there are patterns related to South                 jtscm.co.za/index.php/jtscm). A limited number of printed
African-specific topics such as the road-to-rail debate,              copies of the book that includes all the articles for the past
e-tolling, transport infrastructure, public transport and             calendar year is still printed.
others. Furthermore, does the journal attract international
authors and articles? In addition, impact can also be measured        To enhance the stature of the JTSCM, it was necessary to
by journal accreditation and journal indexing on sites such           appoint an independent editor. This was done in 2012 when
as International Bibliography of the Social Sciences (IBSS),          emeritus Professor Stephen Kruger took responsibility for
Scopus, Scientific Electronic Library Online (SciELO), and            this task. At that time, it was also decided to outsource the
International Scientific Indexing (ISI).                              administrative activities associated with the publication of
                                                                      the JTSCM to African Online Scientific Information Systems
An outline of the rest of the article is as follows: In the second    (AOSIS), a professional management company that manages
section, the founding, mandate and funding of the journal             a range of academic journals. This arrangement commenced
are outlined. A short literature review is presented in the           in the beginning of 2013 (Kruger 2013). By 2020, Prof Kruger,
third section, and the bibliographic analysis is discussed            with the assistance of the co-editor Mr Tatenda Mbara, was
and presented in the fourth section. This is followed by              still managing the journal. An editorial board is in place,

                                             http://www.jtscm.co.za   Open Access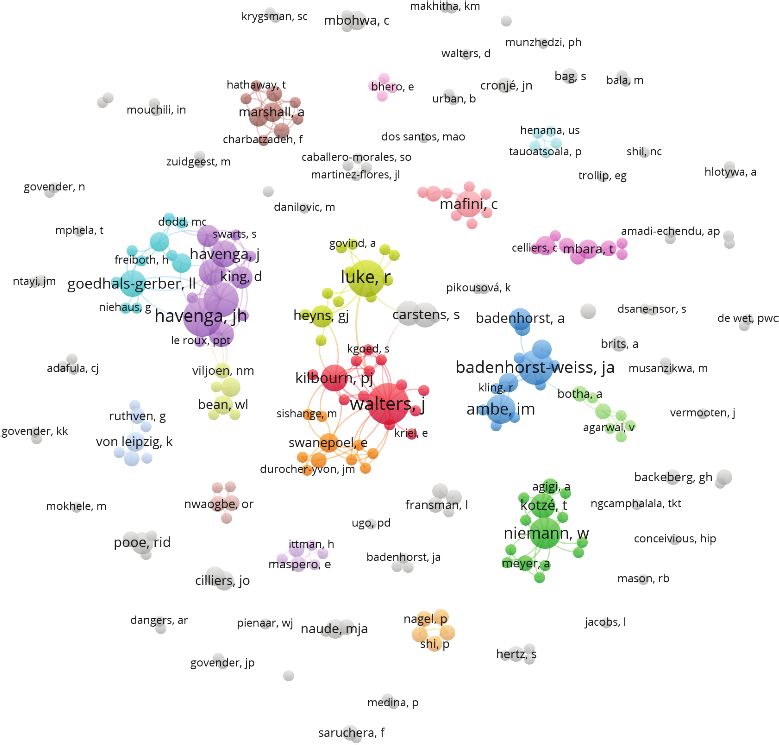
Page 3 of 15   Original Research

consisting of local and international academics as well as            book that covered the history of the society since its inception in
representatives from the private sector.                              1969 (eds. Kruger & Van Vuuren 2019). One chapter in the
                                                                      book is devoted to ORiON, the peer-reviewed, scholarly
Initially, the funding required for publishing the journal was        journal of ORSSA (eds. Kruger & Van Vuuren 2019). This
provided by the Department of Transport and Supply Chain              flagship journal of the society was launched in 1985 and the
Management of UJ. This, however, changed in January 2017              analysis covers 34 volumes published over the period 1985–
when page fees were introduced. This practice is in line with         2018. The founding and mandate of the journal is, inter alia,
many international and local journals (JTSCM editorial board          discussed; and a comprehensive analysis is then given of
meeting on 26 October 2017, Kingsway Campus, University               articles published over this period. In conclusion, there is a
of Johannesburg). Every year the page fees are increased with         reflection on the state of ORiON and the challenges faced by
the objective of getting to a point where the journal is fully        the editorial team.
self-funded. Initially, when the page fees were introduced,
these were relatively low, with the department still proving a        Bibliometric analysis has been performed in similar ways for
substantial portion of the funding required. Over time, by            specific supply chain–related journals or for specific Supply
slowly increasing the page fees, this contribution will reduce        Chain Management (SCM) topics. For a specific logistics or
and ultimately become relatively small or zero.                       SCM journal, see Wang et al. (2019), whilst such an analysis
                                                                      around a specific topic is presented in Ghalehkhondabi,
Obviously, the impact of page fees on article submissions             Ahmadi and Maihami (2020). Several additional examples,
                                                                      both transport and supply chain management related, are
will be monitored to ensure that it does not negatively impact
                                                                      given below:
such submissions.
                                                                      • Optimisation in supply chain management (Movahedipour
The journal is accredited by the Department of Higher                   et al. 2016) – Some 1610 articles published from 1994 to
Education (DHE) as well as Scopus. The Scopus accreditation             March 2016 were used in this bibliometric analysis to
only occurred in 2018, with the result that articles published          obtain a sense of the current state of research in
from 2019 onwards is available on Scopus.                               optimisation in SCM and to identify the potential areas of
                                                                        future research.
Literature review                                                     • City logistics (Hajduk 2017) – Here the aim was to identify
                                                                        any trends and the dynamics of changes in city logistics.
Bibliometric reviews are not uncommon. Formally                         Host databases, such as ISI Web of Science (WoS), Scopus,
bibliometrics is defined as the use of statistical methods to           Elsevier, Emerald and EBSCO, were used as sources of
analyse books, articles and other publications. The objective           the literature. The bibliometric analysis was conducted
is to determine through a quantitative assessment what the              using the software package, VOSviewer.
academic quality of a journal is, as well as authors, by              • Reverse logistics and closed loop supply chain management
statistical methods such as citation rates (Van Leeuwen 2004).          (Kazemi, Modak & Govindan 2019) – These two areas
                                                                        are universally recognised as environmentally friendly
Wang, Lim and Lyons (2019) give a general overview of the               practices that could help in greening supply chains. As
International Journal of Logistics Research and Applications            part of the 55th volume anniversary of the International
as part of the 20th anniversary of the journal. It covers the           Journal of Production of Research (IJPR), this review was
period 1998–2017 and endeavours to identify leading trends              aimed at investigating studies conducted on the topic of
that have affected the journal over this period. A whole range          reverse logistics and close loop SCM in IJPR over the
of bibliometric aspects are included in the analysis such as            period 2000 until July 2017.
the publication and citation evolution of the journal, the            • Reverse logistics research (Wang et al. 2016) – Reverse
most-cited articles, the most productive and influential                logistics is considered a critical component of SCM, and
authors, institutions, countries, etc.                                  this timely and comprehensive literature review was
                                                                        conducted to identify opportunities for future research in
Similar analysis has been conducted for other journals and the          the area.
analysis of two journals, namely, Review of Managerial Science        • Supply chain management (Yalcin, Shi & Rahman 2020) –
(RMS) (Mas‑Tur et al. 2020), an international journal, and a local      An up-to-date review of global contributions in SCM
journal, ORiON, journal of the Operations Research Society of           publications between 1998 and 2017, using scientometric
South Africa (ORSSA) (eds. Kruger & Van Vuuren 2019), both              analysis, was aimed at identifying prevailing and recent
dedicated towards other disciplines, are briefly mentioned. In          research trends and topics in the field. The analysis
the case of RMS, a bibliometric overview of the publication and         showed a general increase in the number of SCM articles
citation structure of the journal is presented from its inception       over the period. An attempt was also made to identify
in 2007 until 2020. The analysis cover topics of articles published     future research needs in SCM.
in the journal as well as the authors, their institutions and         • Green and sustainable logistics (Ren et al. 2019) – This
countries. It gives an up-to-date comprehensive overview of the         review presented a quantitative and qualitative
history of RMS. In contrast, ORSSA celebrated its 50th                  understanding of the evolutionary trends, knowledge
anniversary in 2019, and as part of the celebration published a         structures and literature gaps in this research field. A total

                                             http://www.jtscm.co.za   Open Access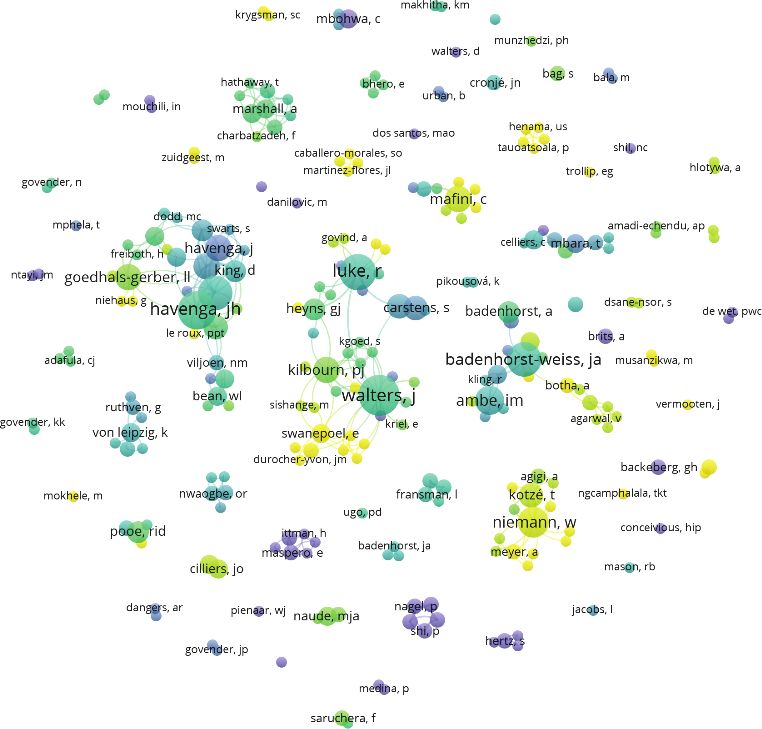
Page 4 of 15   Original Research

  of 306 studies published from 1999 to 2019 were retrieved,          data were extracted from the JTSCM website. The method, or
  elaborated on and synthesised. A whole range of aspects             process followed, to obtain the data used in this study is
  were analysed bibliographically.                                    summarised as follows (all the data used were obtained
• Air transport – A highly informative, and relevant,                 on 11 December 2020, whilst some similar numbers were
  retrospective bibliometric analysis was performed using             obtained in mid-April 2020):
  1438 articles published in the Journal of Air Transport             • The full set of articles was accessed from the official
  Management (JATM) (Tanrıverdi, Bakır & Merkert 2020).
                                                                        webpages of the JTSCM as administered by AOSIS
  These are all articles published in this journal up to the
                                                                        Publishing (https://jtscm.co.za/index.php/jtscm). For
  outbreak of COVID-19. The aim of the analysis was to
                                                                        each article, the title, author(s), affiliation(s) and key
  draw lessons from and evaluate whether past pandemics
                                                                        words, where listed, were extracted. Two further metrics
  and economic crises influenced JATM publications in
                                                                        for each article are also provided in the website, namely,
  terms of both frequency and impact. It was found that
                                                                        total abstract views and total article views. The numbers
  these were not dominant in their impact although it was
                                                                        are questionable as they seem to be the wrong way
  noticeable that the terms ‘recovery, crisis and disruption’
                                                                        around.
  were important key words after these events.
                                                                      • From the data provided on the website, the total number
• Transportation research – The journal Transportation Research
  (TR) was established in 1967 with the vision of promoting             of abstracts viewed for all articles over the period
  multidisciplinary research on transport systems. Over                 2007–2019 were 589 585, whilst the total number of
  the years, the journal has expanded into six separate                 articles viewed were 1 709 693. One would have thought
  journals, TR Parts A–F, addressing policy and practice,               that the abstracts viewed were much higher, whilst the
  methodological, emerging technologies, transport and                  articles viewed (downloaded) would be much less. On
  environment, logistics and transportation review and                  the contrary, the numbers presented in this article are
  traffic psychology and behaviour, within the transport                ‘correct’, that is, the number for abstracts viewed is used
  sector, respectively. A bibliometric analysis, which                  for articles viewed and vice versa. A number is also
  included all publications in the different TR journals, was           given for citations of articles, but a different source was
  part of the first half century celebrations of TR (Modak              used (see the next point) in this study, as it is not clear
  et al. 2019). It is a comprehensive analysis to identify              where and how the numbers given in the website are
  leading trends in all the TR journals over the period                 obtained.
  1967–2016. The analysis covers aspects such as                      • For the number of citations, a whole range of sources
  impact, topics, authors, universities and countries, whilst           can be used, namely, WoS, Scopus, Google Scholar (GS)
  bibliographic coupling, such as co-citation, citation, co-            and several others. The above mentioned are considered
  authorship and co-occurrence of key words, are analysed,              as the three main comprehensive citation databases
  and these relationships are visually presented.                       (Bar-Ilan 2010). For this study, GS was used. The reason
• Transportation Research Part B: Methodological –                      for this is based on Michigan State University (MSU)
  Transportation Research Part B: Methodological (TR-                   (2020) where a comparison is outlined between PubMed,
  Part B) became an independent journal in 1979 and                     WoS and GS. The overriding advice provided when
  its focus was on methodological development of                        deciding which of these databases to use is: ‘it depends
  transportation science. Jiang, Bhat and Lam (2020)                    on what you’re trying to do’. Google Scholar was
  performed a separate bibliometric analysis of the TR                  selected because it ‘is not a human-curated database but
  mentioned above, covering the entire lifetime of TR-Part              a search engine of the whole internet which narrows the
  B over the period 1979–2019. In total, 2697 articles were             results to “scholarly” ones based on machine automated
  included in the analysis. A similar comprehensive                     criteria’. Google Scholar searches for material based on
  analysis was conducted leading to very insightful
                                                                        the criteria for inclusion as ‘scholarly’ and these include
  bibliometric findings. For both TR and TR-Part B, the
                                                                        books, journal articles, reports, theses, preprints and
  data for the bibliometric analysis were collected from
                                                                        other types of sources. In addition, WoS (2019)
  the WoS Core Collection database.
                                                                        acknowledges that GS is more liberal in attributing
                                                                        citations than, for example, WoS. Using GS to extract
It is clear from the above that there is a strong drive to analyse
                                                                        citations for all articles in JTSCM ensures articles are
journals, and specifically their impact, as well as research
                                                                        equally treated.
areas in SCM. The latter is important as research gaps can be
                                                                      • An exhaustive process, using GS, was conducted for each
identified, trends within the research area can be determined,
                                                                        of the articles published in JTSCM to obtain the number
one can obtain a sense of the most productive authors as well
as those making the biggest impact through considering the              of citations for every specific article. The numbers
number of citations of their work.                                      reflected were obtained on 11 December 2020.
                                                                      • In order to draw some bibliographic graphs, a

Bibliometric analysis
                                                                        bibliographic database needed to be created which can
                                                                        then be used with special software. Although JTSCM is
Bibliometric methods use bibliographic data from a                      accredited with Scopus, only the articles published in
publication database. In the case of the JTSCM, most of the             2019 and 2020 are indexed in Scopus. Journal of Transport

                                             http://www.jtscm.co.za   Open Access
Page 5 of 15 Original Research
and Supply Chain Management articles are also not TABLE 1: Numbers of abstracts and articles viewed over a period of 9 months.
Date Abstracts viewed Articles viewed (or downloaded)
indexed in WoS but Dimensions,1 an alternative but to
Mid-December 2020 1 709 693 589 585
Scopus and WoS, does contain all the JTSCM articles, see
Mid-April 2020 1 598 430 527 102
https://app.dimensions.ai/discover/publication?
Difference 111 263 62 483
search_mode=content&or_facet_source_title=jour.
1150232. Dimensions allow one to create an account
with free access. After building the bibliographic 25
22
database, using all 197 articles obtained from 21
20 19 19 19
Number of arcles
Dimensions, the VOSviewer software tool was used to 18
17
graphically visualise some of the data. VOSviewer is a 15 15
15 14
software tool developed by researchers from the
10
University of Leiden in the Netherlands. It is used for 7
6
5
constructing and visualising bibliometric networks 5
(VOSviewer 2021). Networks may include journals,
0
researchers or individual publications, and networks
07
08
09
10
11
12
13
14
15
16
17
18
19
from these sources can be constructed based on citation,
20
20
20
20
20
20
20
20
20
20
20
20
20
bibliographic coupling, co-citation or co-authorship Year of publicaon
relations. In this article, the focus was on co-authorship.
FIGURE 1: Number of articles per volume over the period 2007–2019.
The reason for the latter is mainly data related.
VOSviewer support files created in WoS, Scopus, Initially the journal struggled to gain momentum but the
Dimensions and PubMed. This implies that VOSviewer
average number of articles per volume is now around 15 per
can read files from these four sources and perform
volume. One would, obviously, like to see a continuous
analysis with the data obtained in this way. A data file
increase in the number of articles published per volume. It is
created with Dimensions was used in VOSviewer.
difficult to pinpoint what the reasons are for this not being
the case, especially for the decrease in the number of articles
This section presents the results obtained from the
published from 2018 onwards. One can only speculate
bibliometric analysis. Various trends are presented as well as
around this. Maintaining a high standard with quality articles
a variety of issues of interest, giving a sense of the impact of
is, and remains, an overriding objective. Over time, the
the journal.
acceptance rate of articles decreased with the concomitant
increase in quality articles but typically resulting in a lower
In Table 1 some basic statistics are shown, comparing
number of published publications.
numbers extracted mid-April 2020 to those extracted in mid-
Dec 2020.
The impact of the 25% rule from the DHE is exceedingly
difficult to quantify.
This gives an indication of the interest in JTSCM articles over
a period of 8 months. About 111 263 researchers viewed
This rule requires that no more than 25% of articles published
abstracts of articles over this period, whilst 62 483 articles
in one volume can be from the same institution in South
were viewed (or downloaded) over the same period. One
Africa. This rule can have a few implications, namely, articles,
should point out that these numbers are not absolute
which have been accepted, need to be kept for the next
numbers, implying that the same researcher might have
volume. As authors are keen on publishing their work, they
viewed the same abstract or article more than once.
may decide to submit their articles to other journals, mainly
international journals, which are not affected by this policy of
Number of articles per volume the DHE. A further incentive for those in academic institutions
A total number of 197 articles were published in the journal to publish in international journals is that it ‘strengthens’
over the period 2007–2019. Of these, 133 covered supply chain their CVs, which could be of advantage when promotion
management issues; whilst the rest, 64, were devoted to is considered or when a researcher is considered, or
transport topics. Theoretical, empirical and applied articles reconsidered, for professional rating by the National Research
were going to be considered for publication when the journal Foundation.
was launched. In this regard, the breakdown for three types
of articles is 91, 64 and 42, respectively. There is some Citations
subjected judgement on designating the type of article. Figure 1
As stated above an exhaustive process was followed, using
shows the number of articles published per volume (or year).
GS, to obtain the citations for all 197 articles published over
1.Dimensions is a linked research knowledge system that re-imagines discovery and the period being reviewed. Figure 2 shows the number of
access to research. Developed by Digital Science in collaboration with over 100
leading research organisations around the world, Dimensions brings together citations for articles published in each of the 13 volumes. No
grants, publications, citations, alternative metrics, clinical trials, patents and policy
documents to deliver a platform that enables users to find and access the most apparent pattern can be observed from this figure. At the
relevant information faster, analyse the academic and broader outcomes of time of this study, the total number of citations was 1987.
research and gather insights to inform future strategy. For more information about
the product, visit https://dimensions.ai (Dimensions 2021). Self-citations are included in the number of citations but to
http://www.jtscm.co.za Open AccessPage 6 of 15 Original Research
350 330 180
295
300 160
250 233 231 224 140
195
Citaons
200 120
147
Citaons
150 127 100
96
100 80
50 22 34 25 28 60
0 40
1 2 3 4 5 6 7 8 9 10 11 12 13
20
Volume numbers 0
1
7
13
19
25
31
37
43
49
55
61
67
73
79
85
91
97
103
109
115
121
127
133
139
145
151
157
163
169
175
181
187
193
FIGURE 2: Number of citations per volume over the period 2007–2019.
Arcle numbers -1 to 197
determine the magnitude of this, is challenging. The citations FIGURE 3: Number of citations per article for all articles published over the
for 2018 and 2019 are low compared to the earlier 3 years and period 2007–2019.
can largely be attributed to the shorter time that elapsed since
the publication of the articles in those 2 years. citations for this specific article is 160, with the second highest
being 57 and then a number above 20; but for the rest of the
It is, however, interesting to note that the total number articles, the citations are low.
of citations increased from 1539 to 1987 over a period of
8 months (mid-April 2020 to 11 December 2020). The increase In Table 2, the top 10 articles with the highest number of
is 448 which signifies an increase of just less than 30%. Can citations are listed. The articles with the highest and third
this imply the start of bigger visibility of articles published in highest citations address issues around procurement in the
the journal? public sector in South Africa. The high number of citations is
not surprising because of the procurement system, called
As mentioned in the literature review, a similar analysis ‘supply chain management’ in the public sector, and it is one
was performed by the ORSSA in assessing its journal of the main challenges within this sector as well as one of the
ORiON (eds. Kruger & Van Vuuren 2019). In this case, the main contributors to corruption in the country. The SCM, or
analysis was for a period of 34 years, with two issues of the procurement, protocols of government are ignored, misused
journal published biannually. A total of 237 articles were or not applied properly. This has led to a lot of studies on the
published, and the total number of citations was 1381 as of topic. In total, 10 articles are devoted to procurement issues,
July 2019. Google Scholar was also used to determine the but there are few of these that build on each other to illustrate
number of citations. Although operations research is a that one research aspect leads to the next, especially in the
different discipline, the journal, ORiON, is also a South South African context. This implies lack of research
African journal, such as JTSCM, and this makes for collaboration in the country.
interesting comparison of two journals. Over a much shorter
time, with less than half the number of volumes published, The rest of the articles amongst these top 10 addresses a
and with less articles, the number of citations of the JTSCM, variety of topics in logistics, supply chain management
1987, is substantially higher. The average number of and transport. Transport, transportation and related policy
citations per article for ORiON is 5.8; whilst for JTSCM, it is issues (Walters 2014, Number 5 on the citation list) are
10.0. Both journals are South African based and both aim to covered in 24 articles addressing a wide range of transport
serve the local environment; however, transport and matters. This again shows that the research topic is
logistics cover a much broader area with more practitioners, addressed once but there is no ‘follow-up or continuation’
researchers and academics, all aspects that can explain the to extend, strenghten or deepen the research. As Rosenberg
difference in the number of citations. Furthermore, these (1976) stated ‘the generation of knowledge is based on
are two different disciplines. previous knowledge and affects future research’ and this is
not visible. The same pattern can be observed for the rest of
Figure 3 gives the number of citations for each of the articles the articles with high citations. What it does illustrate is the
published in the JTSCM over the 13-year period. diversity of topics covered in the journal which is typical
of this discipline in South Africa as is the case with most
There are 197 articles, and each article was numbered from 1 disciplines in the country. The number of researchers is
to 197. The first five articles in volume 1 is numbered 1–5; limited and the topics they work on vary considerably, with
seven articles in volume 2 is numbered 6–12; six articles in the result that there are not many researchers working on
volume 3 is numbered 12–18 and similarly for all subsequent the same topic or research area. In addition, many of the
articles. Figure 4 presents the same information but in this articles address and research local issues, and very few
case per volume. articles contribute to international issues or cutting-edge
research. A large portion of articles are thesis work published
From Figures 3 and 4, it is very noticeable that the citations by students; and in many cases, the articles are co-authored
for one article overshadow all the others. The number of by the study leader or promoter.
http://www.jtscm.co.za Open AccessPage 7 of 15 Original Research
180
160
140
Number of citaons
120
100
80
60
40
20
0
2007 2008 2009 2010 2011 2012 2013 2014 2015 2016 2017 2018 2019
Volume
FIGURE 4: Number of citations per article per volume published over the period 2007–2019.
TABLE 2: Top 10 articles with the highest number of citations.
Title of article Author(s) Affiliation Volume Article number Citations
Procurement challenges in the South African public sector Intaher M. Ambe, Johanna A. UNISA 6 67 160
Badenhorst-Weiss
The impact of big data and business analytics on supply chain management Hans W. Ittmann UJ 9 112 57
South African public sector procurement and corruption: Inseparable twins Pandelani Harry Munzhedzi UL 10 127 45
Skills requirements in the supply chain industry in South Africa Gert Heyns, Rose Luke UJ 6 59 42
Public transport policy implementation in South Africa: Quo vadis? Jackie Walters UJ 8 95 38
The impact of green supply chain management in small to medium Chengedzai Mafini, Asphat VUT 11 146 35
enterprises: cross-sectional evidence Muposhi
Supply chain performance attributes for the fast-moving consumer goods Madhu Bala, Dinesh Kumar India 5 35 28
industry
Supply chain integration: a qualitative exploration of perspectives from Yvonne Vermeulen, Wesley UP 10 131 28
plastic manufacturers in Gauteng Niemann, Theuns Kotzé
The influence of logistics integration on information sharing and business Richard Chinomona, R.I. David VUT 7 82 27
performance: the case of small and medium enterprises in South Africa Pooe
The influence of information sharing, supplier trust and supplier synergy David Pooe, Chengedzai Mafini, VUT, UJ 9 121 27
on supplier performance: the case of small and medium enterprises Vandrys W. Loury-Okoumba
UNISA, University of South Africa; UJ, University of Johannesburg; UL, University of Limpopo; VUT, Vaal University of Technology; UP, University of Pretoria.
From the analysis, it can be seen that about one-third of the the affiliations of authors, the number and countries of
articles have 0 (14 articles), 1 (15), 2 (15) or 3 (16) citations, international contributors as well as those from the
whilst in total, 128 articles have 10 or less citations. The latter private sector. Furthermore, co-authorship relationships are
represents almost two-thirds of the articles. In the Scimago presented.
Journal and Country Rank 1996–2019 bibliometric indicators
database (SJR 2020), where countries are ranked according Productive authors and authors achieving the
biggest impact
to the number of publications over the 20-year period, South
Africa is ranked 35 out of 240 countries, territories, etc. The In Table 3, the top 10 most productive authors are shown
average citations per article are also calculated; and for with their affiliations as well as the volume of the journal in
South Africa, this value is 14.59. The content of the Scimago which the articles were published. The authors are all from
database is sourced from Scopus. Scopus is the world’s different universities in South Africa. In addition, the
largest abstract and citation database (Scopus 2020), but centres of ‘excellence’ or the four universities, which have
citations are based on peer-reviewed research literature. dedicated logistics and supply chain management
Comparisons are, thus, not compatible with that of GS. departments, are all represented amongst these top 10.
Nevertheless, the average citation number of 10 per article These are the Department of Logistics from Stellenbosch
for JTSCM gives an indication that whilst the JTSCM is a University (US), the Department of Transport and Supply
great vehicle to publish articles, there is still a long way to go Chain Management of UJ, the Department of Business/
to make a real impact both locally and internationally. Applied Management of University of South Africa
(UNISA) and the Department of Business Management of
University of Pretoria (UP). Table 4 confirms this as these
Journal authorship four academic institutions are at the top of the list of
In total, 259 ‘unique’ authors contributed to the articles contributors to the JTSCM. From Table 3, it is also noticeable
published in JTSCM over the period 2007–2019. This section that collaborators from these four institutions feature
is devoted to an analysis of the most productive authors, strongly, namely, Havenga, Simpson, de Bod with
http://www.jtscm.co.za Open AccessPage 8 of 15 Original Research
TABLE 3: Top 10 productive authors with affiliation and volume numbers in TABLE 3 (Continues...): Top 10 productive authors with affiliation and volume
which articles appeared. numbers in which articles appeared.
Author Affiliation Articles Volume Number of articles Author Affiliation Articles Volume Number of articles
J.H. Havenga US 18 4 x3 Wesley Niemann UP 8 10 x2
5 x3 11 x2
6 x3 12 x2
7 x2 13 x2
8 x2 Intaher N. Ambe UNISA 7 5 -
9 - 6 x3
10 x2 7 x2
12 x2 11 -
Jackie Walters UJ 14 1 - UNISA, University of South Africa; UJ, University of Johannesburg.
4 -
5 - TABLE 4: South African academic affiliations of published articles and the
6 -
number of articles published by authors from these institutions.
Institution Number of articles Number of articles co-authored
7 -
UJ 62 12
8 -
UNISA 34 7
9 x3
US 31 4
10 x2
UP 13 12
12 -
VUT 11 6
13 x2
UKZN 9 4
J.A. Badenhorst-Weiss UNISA 12 4 -
CSIR 6 3
5 x3
NWU 4 2
6 x2
DUT 3 1
7 x2
CPUT 2 -
9 x2
TUT 2 -
12 -
WITS 1 -
13 -
UCT 1 -
Rose Luke UJ 11 4 -
UL 1 -
5 x2
UFH 1 -
6 -
Total 181 51
7 x2
UJ, University of Johannesburg; UNISA, University of South Africa; US, Stellenbosch
8 x2 University; UP, University of Pretoria; VUT, Vaal University of Technology; UKZN, KwaZulu-
9 - Natal University; CSIR, Council for Scientific and Industrial Research; NWU, North-West
University; DUT, Durban University of Technology; CPUT, Cape Peninsula University of
11 - Technology; TUT, Tshwane University of Technology; WITS, University of the
Witwatersrand; UCT, University of Cape Town; UL, University of Limpopo; UFH, University
12 - of Fort Hare.
Zane Simpson US 11 4 -
5 -
Goedhals-Gerber from US, Walters, Luke and Heyns from
6 x3
UJ, as well as Badenhorst-Weiss with Ambe from UNISA
7 -
8 x2
and finally Niemann and his network of co-researchers
9 - from UP.
10 -
12 - Breakdown according to affiliation and nationality
L.L. Goedhals-Gerber US 10 6 x3
The affiliations of all authors, from the various academic and
7 -
research intuitions in South Africa, who contributed articles,
9 x2
are presented in Table 4. These are presented in order of the
10 x2
11 -
number of articles published from the various institutions.
12 - As mentioned above, the four top contributors are also from
A. de Bod US 10 4 - the four universities with strong and dedicated logistics
5 - and supply chain management departments. One would
6 x2 have expected to see the CSIR higher up the list, whilst it is
7 - encouraging that articles from ‘previously disadvantaged’
8 x2 institutions are present.
9 -
10 x2
The employees of private sector companies in South Africa
Gert Heyns UJ 9 5 -
do not publish and are in general not encouraged to publish.
6 x3
The same applies for those in the public sector. Table 5
7 x2
8 -
shows this very clearly. Only a few articles were published
9 - by authors from both the private and public sectors over the
12 - period 2007–2019; and only one article from a national
Table 3 continues in the next column → government department and one from local government.
http://www.jtscm.co.za Open AccessPage 9 of 15 Original Research
TABLE 5: Private and public sector contributions to journal of transport and TABLE 6: Countries of International contributors and the number of articles.
supply chain management from 2007 to 2019. Country Number of articles Number of articles co-authored
Private and public sectors Number of Number of articles United Kingdom 5 5
articles co-authored
Sweden 4 1
SASOL 1 1
Australia 4 1
RCBM 1 -
Zimbabwe 4 2
Stewart Scott International engineers 1 1
Nigeria 3 1
National Department of Transport 1 1
Namibia 3 2
City of Tshwane 1 1
Mexico 2 1
Aveng 1 1
India 2 1
Exxaro coal 1 1
Ghana 2 -
Chesmans Trade International Co., 1 -
Cape Town, South Africa United Arab Emirates 2 2
Aramex South Africa 1 1 Ethiopia 2 1
Tega Industries South Africa (Pty) Ltd. 2 - France 1 1
Private consultants 1 1 Bangladesh 1 -
Total 12 8 Uganda 1 -
Korea 1 1
Botswana 1 -
What are the reasons for this? Again, one can only speculate.
China 1 1
For the majority of those involved in these two sectors, no Czech Republic 1 -
incentives are provided to publish their work. In addition, Norway 1 1
within the private sector, a strong sense of competitiveness is Total 41 21
felt, whilst confidentiality remains a high priority as well as
the protection of intellectual property.
journals are dedicated to the discipline that publishes
articles on this topic.
The effort and time spent on drafting a publication is not
considered to impact the brand, the image or the bottom
Collaboration amongst authors
line of organisations in these two sectors. A further
contributing factor, in the case of the private sector, is the Aspects of bibliographic analysis can be graphically
decline in the spending of business enterprise on R&D represented. A range of software tools can be used for this
(BERD) (see Molotja et al. 2019). The ratio of BERD to gross purpose. The software tool, VOSviewer, not only enables the
domestic expenditure on R&D (GERD) in South Africa has creation of maps based on network data but has the capability
declined to almost 40% since 2009–2010. With less spending, of visualising and exploring these maps (VOSviewer 2021).
there is bound to be less research outputs in terms of The functionality of VOSviewer enables one to construct
publications. Many of the articles published in the JTSCM networks of scientific publications, scientific journals,
are, however, related to both the private and public sectors researchers, research organisations, countries, key words or
and address a variety of issues in these two sectors. These terms; and items in these networks, in turn, can be connected
articles, however, were drafted by academics and by co-authorship, co-occurrence, citation, bibliographic
researchers. It is likewise difficult to determine whether coupling or co-citation links. For the bibliographic analysis,
articles were directly commissioned or funded. Some in this article, the network for co-authorship was constructed
articles are the result of funded projects, but it is not clear using VOSviewer. This gives a visual representation of
whether the drafting of an article was part of the project research networks, that is, authors who work together and
and, thus, funded in that manner. jointly publish articles.
International contributions represent involvement in about A bibliographic database was created of the JTSCM data,
20% of the articles contained in the JTSCM for the period of using Dimensions. As indicated in the introduction of
the analysis (see Table 6). The authors originate from 19 bibliometric analysis, Dimensions is similar to Scopus and
different countries. Many of the articles in the JTSCM, with WoS, and it does contain data of all 197 JTSCM articles. This
the involvement of international authors, are co-authored database then served as the input to VOSviewer and from
with other authors. Twenty articles were solely contributed this VOSviewer was used to create visualisations of the co-
by international authors. Of these, five are co-authored with authorship data as well as clusters of research networks.
international collaborators. Those 20 articles represent about VOSviewer uses different quantitative techniques as part of
10% of all the articles published. its functionality.
With logistics and supply chain management being such an In Waltman, Van Eck and Noyons (2010), the clustering
important and dynamic discipline, used and implemented technique used in the tool is outlined.
by organisations worldwide, 19 countries constitute only
10% of the 192 countries that are members of the United As part of the technique, an optimisation problem needs to
Nations. The 10% is, thus, not high. One, however, needs to be solved. Waltman and Van Eck (2013) introduced a smart
interpret this in the light of the fact that many international local moving algorithm for this purpose.
http://www.jtscm.co.za Open AccessPage 10 of 15 Original Research
Network visualisation of co-authorship indicate clusters of authors who are relatively strongly
Figure 5 shows the network of co-authorship links between connected by co-authorship links and, thus, represent
the authors of all the 197 JTSCM articles. VOSviewer has research networks or research communities (also referred
an option to select the minimum number of articles per to as ‘clusters’).
author. All authors and, thus, all articles are presented in
Figure 5. The ‘bubbles’, or circles, represent authors, also From Figure 5, one can see that around 10 research
called ‘items’, and the size of the ‘bubble’ indicates the networks or communities published articles in the JTSCM.
number of articles by a specific author. The lines (which The larger ones coloured in purple, blue, green and
are not that clear in Figure 5 as it is small), or links, show reddish represent the research communities from US,
the relationship between authors and here it represents UNISA, UP and UJ, respectively. These correlates with the
co-authorship links. Thus, where there is a line between most productive authors or groups as depicted in Table 3.
two authors, they have co-authored one or more articles. The big scattering of ‘bubbles’ in Figure 5 indicates that
Authors, who have co-authored, also tend to be located many authors are single authors whilst many have
close to each other on the map shown in Figure 5. Colours published only one article.
FIGURE 5: Network visualisation of co-authorship network.
http://www.jtscm.co.za Open AccessPage 11 of 15 Original Research
Overlay visualisation of co-authorship Figure 6 shows the overlay visualisation for the JTSCM
Overlay visualisation is identical to the network visualisation articles. The colour key, at the top right of the map, shows the
except that the authors, or items, are coloured differently. The colours for the different years. As each year represents a
size of a ‘bubble’ indicates the number of articles the author volume of the journal, the year can also be interpreted as a
has published exactly like that in the network visualisation. volume. The overlay map, thus, gives an indication of when
Each of the ‘bubbles’, or items, has a ‘score’; in this case, the a specific article was published by using different colours
score is the year, or volume, in which the article was depending on when an article was published.
published. VOSviewer uses the score to colour a ‘bubble’
using the default colours. These colours range from blue Density visualisation of co-authorship
(i.e. the lowest score in the first year 2007) to green to yellow Figure 7 presents a network of co-authorship where the
(i.e. the highest score in the year 2019). The user can also visualisation is shown by density. In this case, the most
define the colours, but this was not done in this case. If items connected groups of authors are highlighted in the form of
have neither scores nor user-defined colours, it is not possible ‘clusters’ or research communities. The attributes used to
to create an overlay visualisation. determine the clusters, or closeness, include the number of
2010 2012 2014 2016 2018
FIGURE 6: Overlay visualisation of co-authorship network.
http://www.jtscm.co.za Open AccessPage 12 of 15 Original Research
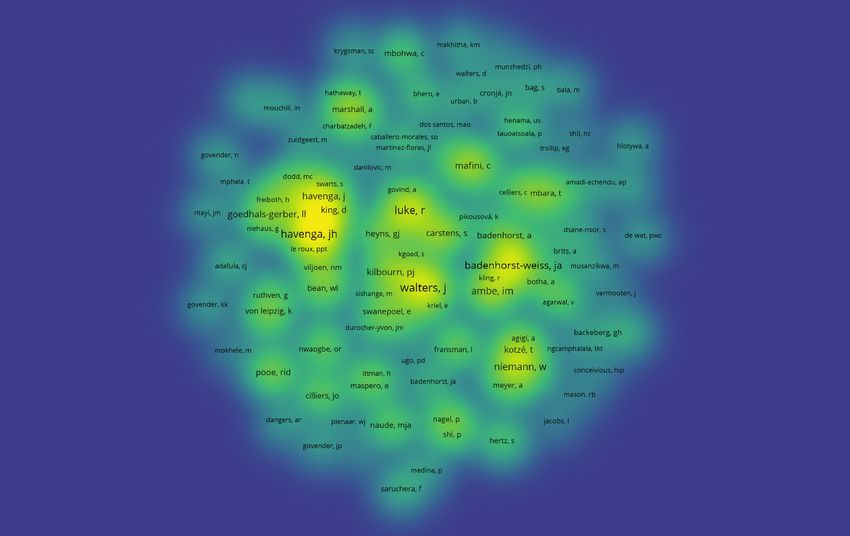
FIGURE 7: Density visualisation of co-authorship network.
articles an author has published, the number of articles an logistics and supply chain management departments
author has co-authored and the institution of the author as (see productive authors and authors achieving the biggest
well as that of the co-authors. This is represented as clusters impact section).
in the map where the size of the cluster is largely determined
by the number of articles published by the specific network Logistics topics
or research community. For Figure 7, all the authors were Ideally the key words, listed in each article, can be used to
considered; thus, everyone who published one or more determine the transport and supply chain management
articles. Five clear clusters can be identified (the bright topics addressed in the articles published over the period
yellow regions in Figure 7) with several smaller ones. The 2007–2019. However, for the first seven volumes, no key
author with the largest number of studies is Jan H. Havenga words are listed for any of the articles. Therefore, the article
with a total of 18 articles of which 15 are titles were used, and the following 20 main topical areas
co-authored. Of the 15 co-authored articles, the primary were determined:
co-authors are Zane Simpson and Anneke de Bod. The • Procurement
Havenga research community is shown within the largest • Supply chain management
cluster. The second largest cluster contains the author, Jackie • Green logistics including greening
Walters (14 articles of which 13 are co-authored), and the • Transportation
rest of his network. Rose Luke has a weak connection to • Airport and airline aspects
this cluster and almost represents a separate cluster. Johanna • Freight transport
A. Badenhorst-Weiss, and her research community are also • Infrastructure
clearly a strong cluster. • Outsourcing
• Reverse logistics
Figure 8 is a different density visualisation but here only • Costs (freight costs, transportation costs, etc.)
authors with five or more articles were considered. The five • Risk management
main clusters appear much more visible in this figure. • Policy issues
These are the ‘Havenga’ cluster, the ‘Walters’ one, • Maintenance
‘Badenhorst-Weiss’, ‘Niemann’ and ‘Mafini’. The four • Humanitarian logistics
biggest clusters, again, represent the groups US, UJ, UNISA • Sustainability
and UP. These are academics from the four dedicated • Supplier relationship
http://www.jtscm.co.za Open AccessPage 13 of 15 Original Research
FIGURE 8: Density visualisation of the co-authorship network when authors with five or more articles are considered.
•
•
Intermodal
Skills development
Discussion
• Resilience The bibliographic analysis conducted gives an interesting
• Collaboration view on a range of aspects concerning the journal. Over a
13-year period, 197 articles were published in volumes 1–13,
The above mentioned is not a one-to-one mapping of covering a wide spectrum of topics. As of December 2020,
articles to topical areas. Some articles are classified into the total citation count was 1987 which was obtained using
more than one area, whilst many articles do not fall in any GS. The mean number of citations per article published
was, thus, just over 10. The citations of the top 10 articles
of these areas. The range of articles published in the
add up to 487, reducing the mean for the rest to 8. Only
JTSCM, thus, covers many topics in transport and supply
14 articles that were not cited indicate interest in the articles
chain management. This is not surprising as there are only
published in the journal, although the mean citation count
a few research groups in the country; whilst they do focus
remains low. This mean will have to increase substantially
on specific expertise areas, the number of articles published
to contribute towards the perceived quality and impact of
by these groups is limited. In many cases, an author would
the journal.
publish only one article on a topic that is either very
specialised or it is the topic of a thesis or a case study. Academics were by far the main contributors of articles with
around 10% of these being from elsewhere in the world.
What is noticeable is the lack of articles on more cutting- A total of 53 single-author articles (26.9%) appeared in the
edge topics. Included amongst these are supply chain JTSCM, with four main pockets of collaboration. The latter
digital transformation, related aspects such as artificial are four main academic departments focusing on transport
intelligence, machine learning, etc., and how these could and supply chain management in the country whilst the rest
impact transport, logistics and supply chain management, of the collaborations is disjointed pockets of varying sizes.
behavioural aspects within supply chains, the Fourth Many of the single authors published only one article over
Industrial Revolution and its impact, big data, analytics, etc. the period.
With the current pandemic, COVID-19, one would expect
articles on this topic in the future. It is encouraging to note The lack of contributions from both the private and public
that the editorial of volume 20 is dedicated to this topic sectors is a concern. Practical case studies from the private
(Luke 2020). sector will enrich the content of the journal as well as interest
http://www.jtscm.co.za Open AccessPage 14 of 15 Original Research
in the journal. The public sector can stimulate research if 77 JTSCM articles fall into this category. The number of
policy-related articles are published. citations is affected by the fact that time needs to elapse
before an article is cited. As a result, 33 articles published in
The aim of the journal is also to share the latest research, the last 2 years of the analysis have low citations. When
new trends, important noteworthy practices as well as citations are analysed, self-citation needs to be considered
case studies. The question then is: has this been achieved? and the impact of this over the 13-year period is not clear.
Pockets of latest research have been published such as that Nevertheless, based on the number of citations, 1987 obtained
by Havenga and co-authors, Luke and Heyns and one or two via GS, one can conclude that for a relatively ‘young’ journal,
others; but in general, the material covered in the journal is a JTSCM has made some impact. It does, however, needs to go
conglomerate of a wide range of topics. As the research and a long way to be an influential journal.
academic pool in the country is small, this is what can be
expected. Academics have a specific research interest, and There is a one-third to two-third split between the transport-
they address aspects of it by publishing material on the topic, related and supply chain management–related articles
and this is the trend with almost all academics and researchers. published over the 13-year period. Of these, 91 are of a
Little, if any, has been published on new trends in the field. theoretical nature, 64 empirical articles and 42 applied. Other
The same applies for noteworthy practices and case studies. South African journals can publish both transport and supply
chain management articles, while the impact and attraction
With this analysis, access to data, and specifically comprehensive for transport-related articles by the annual South African
data in a useable form, was problematic. The only database Transport Conference possibly play a role in the fact that
that has the full index of the JTSCM articles is Dimensions. there are a lower number of transport-oriented studies.
However, the index does not include key words, since the Transport, transportation and related policy issues are
key words for the first seven volumes of the JTSCM are non- covered in 24 articles. A wide range of transport matters are
existent. In addition, the analysis and review were conducted addressed in these. One of the articles (Walters 2014), which
over a period of only 13 years, and an analysis over a longer address transport policy issues, is the fifth on the citation
period would be possible more informative and reliable. list. All of these must point to the fact that transport is an
important research area as well as critical for both public and
Conclusion private sectors.
When the JTSCM was launched in 2007, it gave those With his bibliographic analysis, the main objective was to
involved in transport and supply chain management an obtain a sense of the impact this journal has made and is
outlet to publish their work; and in this regard, the journal making. With the substantial number of citations, as well as
filled an important gap in the transport and supply chain the huge number of abstract and article views, there is no
management landscape in South Africa. The fact that over a doubt that the journal is making a significant impact.
period of 13 years, an average of 15 articles per volume was
published is an indication of the impact this journal has Acknowledgements
made, signifying the need for a journal addressing these
The author would like to express his appreciation towards
important disciplines. A downward trend has been observed
Dr Nees Jan van Eck from the University of Leiden for his
in terms of the articles published and that is a concern if this
advice and recommendation to use Dimensions.
continues. Although no value or goal was set at the outset,
the fact that over half a million downloads of JTSCM articles
speaks volumes. This is encouraging and is an indication of Competing interests
the value, but also the impact, JTSCM is making – researchers The author declares that he has no financial or personal
and others want to read the published articles. In addition, relationship that may have inappropriately influenced him in
the fact that JTSCM is an accredited journal with the writing this article.
Department of Higher Education and Training (DHET),
whilst it is indexed on Scopus, shows real progress towards
Author’s contributions
becoming an influential journal. Unfortunately, JTSCM does
not have an impact factor yet. H.W.I. is the sole author of this research article.
The number of citations of a journal article gives a good Ethical considerations
indication of its impact. Of the articles in the JTSCM, close to
This article followed all ethical standards for research
40% (77 articles) has 10 or more citations whilst 26 articles
without direct contact with human or animal subjects.
have 20 or more citations. Different views exist about what
constitutes a good citation number. According to Beaulieu
(2015), almost 44% of all published articles are never cited! To Funding information
be in the top 24% of the most cited work worldwide, Beaulieu The author received no financial support for the research,
indicates, an article must have 10 or more citations, and authorship and/or publication of this article.
http://www.jtscm.co.za Open AccessYou can also read