A Dynamic State Model of Migratory Behavior and Physiology to Assess the Consequences of Environmental Variation and Anthropogenic Disturbance on ...
←
→
Page content transcription
If your browser does not render page correctly, please read the page content below
vol. 191, no. 2       the american naturalist                 february 2018

E-Article

A Dynamic State Model of Migratory Behavior and Physiology to
  Assess the Consequences of Environmental Variation and
     Anthropogenic Disturbance on Marine Vertebrates

Enrico Pirotta,1,* Marc Mangel,2 Daniel P. Costa,3 Bruce Mate,4 Jeremy A. Goldbogen,5
Daniel M. Palacios,4 Luis A. Hückstädt,3 Elizabeth A. McHuron,3 Lisa Schwarz,6 and Leslie New1
1. School of Mathematics, Washington State University, Vancouver, Washington 98686; 2. Department of Applied Mathematics and
Statistics, University of California, Santa Cruz, California 95064; and Theoretical Ecology Group, Department of Biology, University of
Bergen, Bergen 9020, Norway; 3. Department of Ecology and Evolutionary Biology, University of California, Santa Cruz, California
95060; 4. Marine Mammal Institute and Department of Fisheries and Wildlife, Oregon State University, Newport, Oregon 97365;
5. Department of Biology, Hopkins Marine Station, Stanford University, Pacific Grove, California 93950; 6. Institute of Marine
Sciences, University of California, Santa Cruz, California 95064
Submitted January 11, 2017; Accepted July 24, 2017; Electronically published December 13, 2017
Online enhancements: appendix, supplementary material. Dryad data: http://dx.doi.org/10.5061/dryad.md416.

                                                                                  Keywords: bioenergetic modeling, environmental changes, marine mam-
abstract: Integrating behavior and physiology is critical to formu-
                                                                                  mal, population consequences of disturbance, stochastic dynamic pro-
lating new hypotheses on the evolution of animal life-history strat-
                                                                                  gramming, uncertainty.
egies. Migratory capital breeders acquire most of the energy they need
to sustain migration, gestation, and lactation before parturition.
Therefore, when predicting the impact of environmental variation
                                                                                                            Introduction
on such species, a mechanistic understanding of the physiology of
their migratory behavior is required. Using baleen whales as a model              Animals have to balance behavioral decisions against their
system, we developed a dynamic state variable model that captures the             body condition, their reproductive state, and the external
interplay among behavioral decisions, energy, reproductive needs, and
the environment. We applied the framework to blue whales (Balaenop-
                                                                                  environment (Houston and McNamara 1999; Clark and
tera musculus) in the eastern North Pacific Ocean and explored the                 Mangel 2000). In some species and populations, migratory
effects of environmental and anthropogenic perturbations on female                behavior has evolved to achieve this trade-off (Alerstam
reproductive success. We demonstrate the emergence of migration to                et al. 2003; Lennox et al. 2016). Migration allows individ-
track prey resources, enabling us to quantify the trade-offs among cap-           uals to exploit irregular resources resulting from seasonal
ital breeding, body condition, and metabolic expenses. We predict that            changes in the environment and to ensure that the birth
periodic climatic oscillations affect reproductive success less than un-          of their offspring occurs in areas likely to increase the prob-
precedented environmental changes do. The effect of localized, acute
anthropogenic impacts depended on whales’ behavioral response to
                                                                                  ability of reproductive success (e.g., where predation risk is
the disturbance; chronic, but weaker, disturbances had little effect on re-       minimized; Alerstam et al. 2003). When breeding habitats
productive success. Because we link behavior and vital rates by model-            do not provide sufficient food resources to sustain them, in-
ing individuals’ energetic budgets, we provide a general framework to             dividuals can store energy as body reserves to support pe-
investigate the ecology of migration and assess the population conse-             riods in which foraging is reduced. Pure capital breeders
quences of disturbance, while identifying critical knowledge gaps.                represent an extreme case in which the foraging habitat is
                                                                                  completely decoupled from the breeding habitat (Stephens
                                                                                  et al. 2014).
                                                                                     The complex life-history patterns of migratory animals
* Corresponding author; e-mail: enrico.pirotta@wsu.edu.                           result in wide-ranging movements over long time frames,
  ORCIDs: Pirotta, http://orcid.org/0000-0003-3541-3676; Mangel, http://          which can hinder our ability to investigate even basic as-
orcid.org/0000-0002-9406-697X; Palacios, http://orcid.org/0000-0001-7069-7913;    pects of their biology and ecology. This is particularly true
Huckstadt, http://orcid.org/0000-0002-2453-7350; McHuron, http://orcid.org/0000
-0003-3147-2628.
                                                                                  for marine environments, where animals are often inacces-
                                                                                  sible to human observers at the spatial and temporal scales
Am. Nat. 2018. Vol. 191, pp. E000–E000. q 2017 by The University of
Chicago. 0003-0147/2018/19102-57492$15.00. All rights reserved.                   relevant to the species’ life history (Hussey et al. 2015). Yet,
DOI: 10.1086/695135                                                               these species could be more susceptible to natural and

                                        This content downloaded from 073.109.057.023 on December 14, 2017 04:50:35 AM
                          All use subject to University of Chicago Press Terms and Conditions (http://www.journals.uchicago.edu/t-and-c).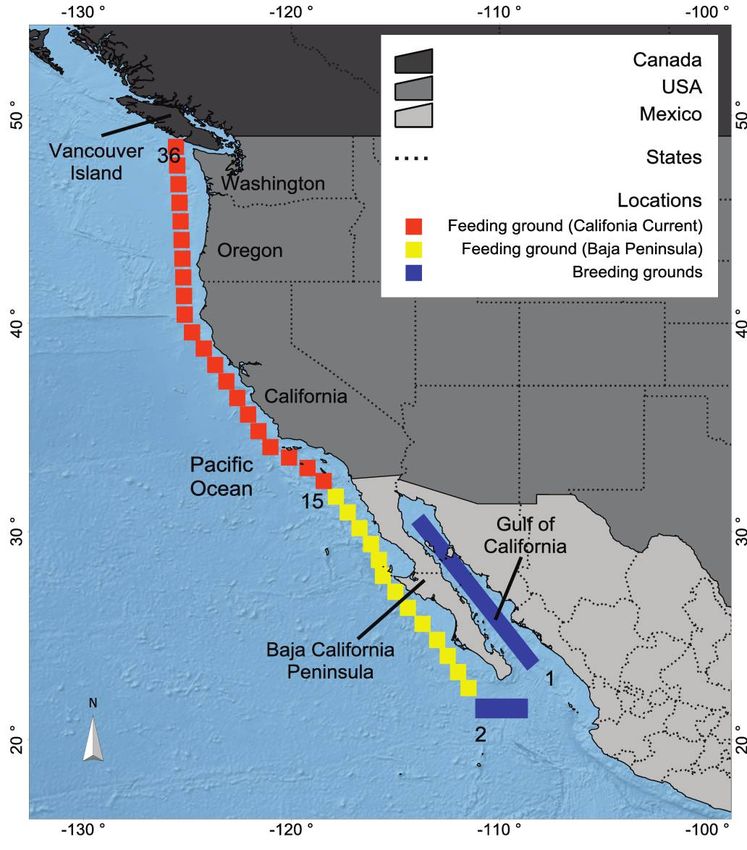
E000    The American Naturalist

human-induced fluctuations in environmental conditions                  behavior in response to disturbance (Nowacek et al. 2007;
because of the physiological constraints of migration (Lennox          Goldbogen et al. 2013; DeRuiter et al. 2016) are relevant
et al. 2016). Thus, the integration of behavioral and phys-            only if they alter the population’s status (e.g., European Hab-
iological research has been proposed as a way to gain a                itats Directive 92/43/EEC, US Marine Mammal Protec-
deeper understanding of biology (Weiner 1992) and to ef-               tion Act). Assessing the population consequences of distur-
fectively tackle current conservation challenges (Cooke et al.         bance requires a mechanistic understanding of how behavior
2014).                                                                 affects an individual’s energy budget (National Research
   State-dependent behavioral and life-history theory, im-             Council 2005; New et al. 2014; National Academies of Sci-
plemented via stochastic dynamic programming (SDP) and                 ences 2016) and how this varies with prey availability (Miller
forward Monte Carlo (MC) simulations, provides a robust                et al. 2011; Williams et al. 2013; Seyboth et al. 2016). Since nu-
framework for quantifying the fitness implications of be-               tritional status and body condition are tightly associated with
havior and characterizing behavioral responses to natural              survival and reproductive success (Lockyer 1986), changes in
environmental variation in different contexts (Mangel and              behavior and physiology can affect an individual’s fitness and
Clark 1988; Houston and McNamara 1999; Clark and Man-                  reverberate at the population level (New et al. 2014).
gel 2000). SDP models can be used to investigate optimal                  We show how SDP methods can be used to develop test-
decisions based on an individual’s internal physiological              able hypotheses regarding the mechanisms that drive the
state and the state of the external environment over the               evolution of behavioral and physiological strategies, as well
course of the reproductive cycle. This is done by linking be-          as assess responses to fluctuations in the environment. This
havior to a measure of Darwinian fitness that accounts for              solid characterization of the population’s ecology and evolved
both survival and reproduction (Mangel and Clark 1988).                responses to environmental variation enabled us to investi-
Since SDP models explicitly acknowledge the physiological              gate the consequences of anthropogenic disturbance on vital
basis of behavior, they can be employed to elucidate the bi-           rates. Our approach provides insights into biological pro-
ology of poorly known species and generate new, testable               cesses that are difficult to sample directly, such as the ener-
hypotheses on the evolution of behavioral and life-history             getic basis of migration and reproduction in baleen whales.
strategies, while also identifying the parameters to which             In addition, it identifies critical knowledge gaps, offers guid-
the results and the corresponding uncertainty are most sen-            ance on how to address situations where incomplete infor-
sitive (Mangel and Clark 1988; Weiner 1992). Moreover,                 mation is available, and could be extended to other species
disturbance from multiple stressors or rapid environmental             with comparable life histories.
change can be simulated under the assumption that anthro-
pogenic activities are not part of the evolutionary history of                                        Methods
these species (McHuron et al. 2017).
                                                                                                    Case Study
   In this study, we present an SDP framework to model the
movement, foraging, and reproductive behavior of a migra-              Developing the model required a series of simplifying as-
tory mammal through the various phases of its breeding cy-             sumptions that may not fully reflect the biology of the pop-
cle. We use long-lived female baleen whales, specifically,              ulation under analysis. These arise from the need to main-
eastern North Pacific (ENP) blue whales (Balaenoptera mus-              tain model tractability and from uncertainty in the available
culus), as a case study to demonstrate the strength of the ap-         data. The use of simplified biological assumptions will be
proach. In particular, we highlight the ability of the SDP             common when dealing with species like baleen whales, where
framework to provide new insights into the biology of migra-           the model must rely on the existing literature and any po-
tory animals for which it is challenging to collect empirical          tential associated biases. The assumptions used in the model
evidence. Furthermore, there are growing concerns regard-              can be interpreted as research hypotheses, which can be ad-
ing the effects of global climate changes (Hazen et al. 2012;          dressed by targeted data collection.
Poloczanska et al. 2013; IPCC 2014) and expanding human                   ENP blue whales are believed to constitute the largest rem-
activities on the marine environment (Halpern et al. 2008;             nant population of this species (Thomas et al. 2016) and, in
Maxwell et al. 2013). Our case study also illustrates the value        their evolutionary history, have experienced environmental
of predictive models that capture fundamental biological and           fluctuations (e.g., El Niño Southern Oscillation [ENSO])
ecological processes to support scientifically sound manage-            and longer-term climate changes (Hazen et al. 2012) that af-
ment measures (New et al. 2014; Christiansen and Lusseau               fect prey density and distribution. In recent ecological time,
2015; King et al. 2015; Pirotta et al. 2015; Villegas-Amtmann          they have been exposed to a series of anthropogenic stressors,
et al. 2015), despite large gaps in empirical knowledge (Har-          including shipping traffic, military exercises, oil and gas ex-
wood and Stokes 2003; Inger et al. 2009).                              ploration, and proposed offshore renewable developments
   Under most regulatory frameworks, the ways in which                 (Thomas et al. 2016). How the effects of these human activ-
baleen whales may change their diving, vocal, or movement              ities may interact with environmental fluctuations is unclear.

                                  This content downloaded from 073.109.057.023 on December 14, 2017 04:50:35 AM
                    All use subject to University of Chicago Press Terms and Conditions (http://www.journals.uchicago.edu/t-and-c).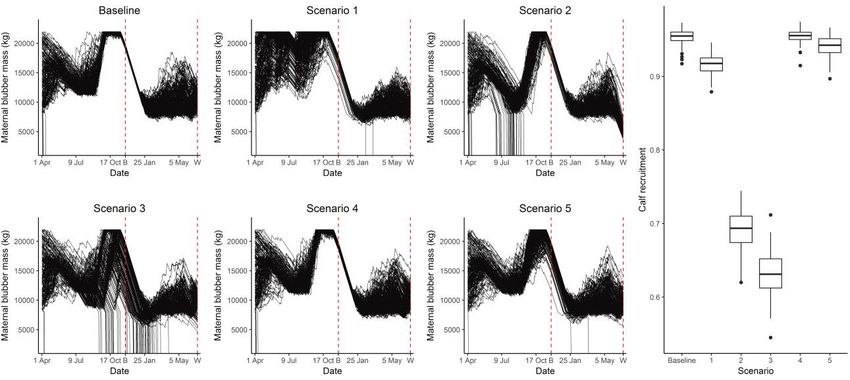
Modeling Baleen Whale Migration            E000

   ENP blue whales spend summer months along the coast                   Baja California Peninsula, and near the Costa Rica Dome
from California to British Columbia (fig. 1), feeding on high             (Bailey et al. 2010).
densities of krill (euphausiids) in the California Current                  In contrast to pure capital breeders (Stephens et al. 2014),
(Croll et al. 2005). In this area, whales primarily target adult         ENP blue whales continue feeding in their breeding grounds,
euphausiids belonging to the species Euphausia pacifica and               where substantial euphausiid populations occur throughout
Thysanoessa spinifera (Fiedler et al. 1998). Satellite telemetry         the winter (Gendron 1992; Etnoyer et al. 2006). Most whales
data suggest that individuals follow the seasonal increase in            leave the breeding grounds in spring, moving northward, pri-
productivity (Bailey et al. 2010; Irvine et al. 2014), which is          marily along the coast, stopping for several days to feed on
characterized by a peak that shifts to higher latitudes as the           krill available along the Baja California Peninsula (Bailey
summer progresses (Schwing et al. 1996; Henson and Thomas                et al. 2010). The foraging patches off Baja California and in
2007). In late autumn, blue whales migrate to their breeding             the Gulf of California are mainly dominated by the subtrop-
grounds in the Gulf of California, off the southern tip of the           ical species Nyctiphanes simplex, which is smaller and thus

Figure 1: Map of the study area, showing the 36 100 # 100-km locations used in the model. Relevant locations are numbered for reference.
Larger boxes for the breeding grounds indicate whales’ ability to roam within those areas.

                                    This content downloaded from 073.109.057.023 on December 14, 2017 04:50:35 AM
                      All use subject to University of Chicago Press Terms and Conditions (http://www.journals.uchicago.edu/t-and-c).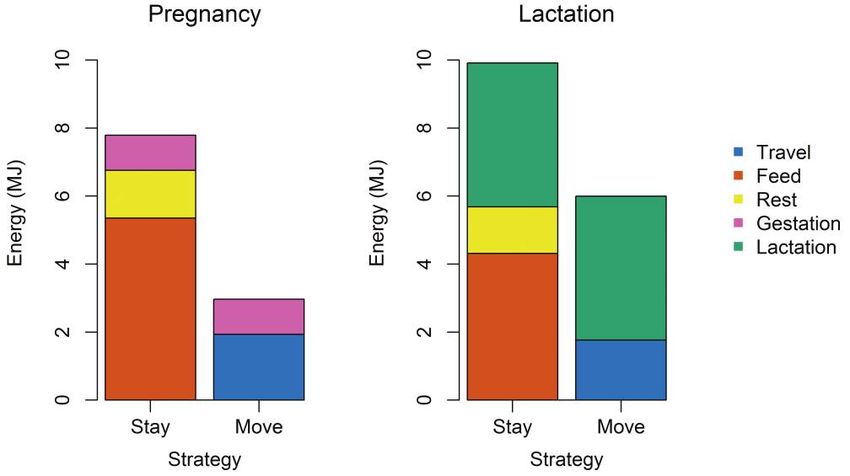
E000    The American Naturalist

less energy-rich than the euphausiids targeted in the Cali-             ley et al. 2010). On days when she does not travel, there will
fornia Current but appears to be subject to fewer seasonal              be some movement within the location, but we assume this
fluctuations (Gendron 1992; Gómez-Gutiérrez 1995). In this               movement involves energy expenditure that is comparable
study, we focus on the subset of the population that breeds in          to resting (Williams 1999).
the Gulf of California and off the southern tip of Baja Cali-
fornia because it is unclear what proportion of the ENP pop-
ulation uses the Costa Rica Dome and whether the region
                                                                                                   State Variables
supports a separate, nonmigrating population of blue whales
(Calambokidis et al. 2009).                                             Full details on the state variables and all associated param-
   Mating in blue whales is thought to occur in low-latitude            eters are provided in appendix A (apps. A–D are available
breeding grounds in winter (Lockyer 1981; fig. 1). Gestation             online). The state variables (table 1) are
lasts for 11 months, during which a female has to acquire                   a) Blubber mass (kg) of the female at time t, X(t) p x,
significant energy reserves to support gestation, migration              which is a measure of the female’s energy stores (Lockyer
to the feeding grounds and back, to the breeding grounds                1986; Miller et al. 2011; Williams et al. 2013). This can vary
(where birth is thought to occur), and part of the subse-               between a minimum of xmin p 2,000 kg and a maximum of
quent lactation (Lockyer 1981). Lactation is extremely costly           xmax p 22,000 kg (Lockyer 1976).
in marine mammals, since the calf has to rapidly accumu-                   b) Current location, L(t) p l, simplified as the position
late lean tissues to grow as well as fat mass for insulation            along a south-to-north axis representing the range over
and to sustain its energy needs in the transition to auton-             which the species migrates. This corresponds to the Gulf
omous feeding (Oftedal 1997). There are no data on the                  of California and the southern tip of Baja California in the
duration of lactation in ENP blue whales, so we used infor-             south, which are the winter breeding grounds, to the waters
mation from Antarctic blue whales (Balaenoptera muscu-                  south of Vancouver Island, which is the northernmost ex-
lus intermedia), whose calves follow their mothers on the               tent of the summer migration. Each location corresponds
spring migration and are weaned on the feeding grounds                  to a patch size of 100 km by 100 km (Bailey et al. 2010;
at 7 months (Lockyer 1981). The amount of energy a female               Wiedenmann et al. 2011). Within the locations representing
transfers to her calf during lactation is expected to affect her        the breeding grounds, whales can roam and take part in all
offspring’s size and condition at weaning and, thus, its sur-           relevant behaviors, including feeding.
vival probability (e.g., McMahon et al. 2003; Miller et al.                c) Current patch type, I(t) p i. There are three patch
2011). Since a female cannot accrue all the necessary energy            types, based on available prey species: low-quality food patches
for reproduction within the breeding area, the accumula-                (N. simplex), high-quality food patches (T. spinifera and E. pa-
tion of sufficient reserves in the feeding grounds is critical           cifica), and patches with no food. Patch quality is determined
for the success of a reproductive event (a self-sufficient               by the differences in the size of krill species, which results in
weaned calf ) and, ultimately, a female’s reproductive fitness           variation in the total available biomass and, thus, the energy a
(interpreted as offspring recruited to the population; New              female acquires per unit of water engulfed. A female that
et al. 2014).                                                           travels for the day has a probability l(l, i) of finding patch
                                                                        type i in location l. We estimated this probability using exist-
                                                                        ing long-term satellite telemetry data (Mate et al. 1999; Bailey
         Stochastic Dynamic Programming Model
                                                                        et al. 2010; Irvine et al. 2014; app. A; telemetry data available
Our model covers one reproductive cycle, that is, the period            via the Animal Telemetry Network (http://oceanview.pfeg
in a female’s life history ranging from her departure from              .noaa.gov/ATN/). Given current patch type i, location l, and
the breeding ground (90-days pregnant), through gestation               day t, a whale that stays in the patch and feeds has a proba-
of the fetus while migrating to the feeding grounds and                 bility p(i, l, t, j) of encountering krill density j. The probabil-
back, to the birth of the calf and the end of lactation. The            ity p(i, l, t, j) varies spatially and seasonally to reflect yearly
time horizon is, therefore, T p 454 days, between April 1               fluctuations in the environment along the migratory route.
in the first year and the end of June of the following year              We used the upwelling index provided by the Environmental
(date of weaning). A whale shifts from pregnancy to lacta-              Research Division, Southwest Fisheries Science Center, NOAA
tion at t b p 244, when the calf is born, fixed here for sim-            Fisheries, as a proxy for this variable (Schwing et al. 1996;
plicity. On each day, a whale may stay in her current location          figs. A2, A3; figs. A1–A3 are available online) and assumed
to feed and rest, travel forward for an entire day to the next          that whales can sense prey density and distribution in a patch.
location, or travel backward to the previous location. On the              d) Blubber mass of the calf M(t) p m, expressed as a pro-
breeding grounds, a whale may also move within the corre-               portion of its total mass at time t. This can vary between
sponding location, which captures whales’ roaming behav-                mmin p 0:05 and mmax p 0:44 and only applies during lac-
ior in these areas during winter to access food or mates (Bai-          tation.

                                   This content downloaded from 073.109.057.023 on December 14, 2017 04:50:35 AM
                     All use subject to University of Chicago Press Terms and Conditions (http://www.journals.uchicago.edu/t-and-c).
Modeling Baleen Whale Migration E000
Table 1: Value of the state variables and associated parameters
State variable, parameter Description Value Reference
Blubber mass:
xmax Max. blubber mass 22,000 kga Lockyer 1976, 1981
xmin Min. blubber mass 2,000 kga Wiedenmann et al. 2011
xabo Threshold mass for abortion 8,000 kga Lockyer 1976, 1981
xlac Threshold mass for lactation 8,000 kga Lockyer 1976, 1981
Location:
Breeding ground, Gulf of California ... 1–2 Bailey et al. 2010
and off southern tip of Baja California
Feeding ground, Baja California ... 3–14 Bailey et al. 2010
Feeding ground, California Current ... 15–36 Bailey et al. 2010
d Location radius and distance 100 km Bailey et al. 2010;
covered per day Braithwaite et al. 2015
Patch type:
l(l) Vector of probabilities of (0.6, 0, 0.4) for Analysis of satellite
encountering different l in [1,14]; tracking data
patch types (given location l) (0, 0.7, 0.3) for
l in [15,36]
Low-quality food patch type ... 1 ...
(Nyctiphanes simplex)
High-quality food patch type ... 2 ...
(Thysanoessa spinifera and
Euphausia pacifica)
No food patch type ... 3 ...
Calf ’s proportion of blubber mass:
mmax Max. % blubber mass of calf 0.44 Reilly and Fedak 1990;
Noren and Mangel 2004
mmin Min. % blubber mass of calf 0.05 Whittemore 1998; Malavear
2002
m50 % blubber mass of calf at which 0.27 Lockyer 1976, 1981a
survival probability is 0.5
g Steepness of fitness function 8 ...
a
These values were derived from the cited source as described in app. A.
Fitness Metric that is, the maximum expected value of the terminal fitness
taken over all possible behavioral decisions and environ-
We let φs (M(T) p m) denote the probability of a calf re-
mental stochasticity, given the current value of the state
cruiting into the population, given its blubber as proportion
variables X(t) p x, M(t) p m, L(t) p l, and I(t) p i. If
of total mass is m at the time of weaning (T). Assuming that
we define V b (x, m, l, i, t) as the fitness value of behavioral
φs(m) is sigmoidal, we set l
choice bl during lactation (stay, move forward, move back-
mg ward, or move within the breeding location), then
φs (m) p , ð1Þ
mg 1 m50 g F lac (x, m, l, i, t) p maxfV b (x, m, l, i, t)g: ð3Þ
l
where g determines the steepness of the curve and m50 is the Because calves have limited swimming abilities in the first
inflection point, at which the proportion of the calf ’s mass weeks after birth (e.g., Cartwright and Sullivan 2009), we
that is blubber results in a 50% chance of the calf recruiting set an arbitrary threshold of lean mass (4,500 kg) that the
(fig. A1). calf must reach before being able to travel outside the breed-
Prior to calf recruitment, the female is lactating. We de- ing grounds with its mother. This results in the mother-calf
fine the fitness function when lactating as pairs staying in the breeding grounds for the first 40 days af-
ter parturition.
F lac (x, m, l, i, t) p max Efφs (M(T))jX(t) p x, M(t)
ð2Þ If, at any time during lactation, the mother’s blubber
p m, L(t) p l, I(t) p ig, mass is equal or below the starvation threshold xmin, she
This content downloaded from 073.109.057.023 on December 14, 2017 04:50:35 AM
All use subject to University of Chicago Press Terms and Conditions (http://www.journals.uchicago.edu/t-and-c).E000 The American Naturalist
dies. Her calf can survive depending on its current value (22 m; Gilpatrick and Perryman 2008). The full state dynam-
of m and the energy required to survive and grow until ics and parameters are described in appendix B (table B1,
7 months, when weaning would have occurred. Finally, the available online).
dependent calf dies whenever the proportion of its mass that Equations (1)–(6) are known as the SDP equations (ad-
is blubber falls below 0.05; that is, ditional details in app. C) and are solved backward starting
at t p T (Mangel and Clark 1988; Houston and McNamara
F lac (x, m, l, i, t) p 0 if m ≤ mmin : ð4Þ 1999; Clark and Mangel 2000). The backward iteration of
the SDP equations resulted in the identification of the opti-
Prior to lactation, the female is pregnant. We define fitness mal behavior during pregnancy, bp *(x, l, i, t), and lactation,
when pregnant, Fpreg(x, l, i, t), in analogy to equation (2). bl *(x, m, l, i, t), given the value of the state variables at each
Given the current value of the state variables X(t) p x, time step (Mangel and Clark 1988; Clark and Mangel 2000).
L(t) p l, and I(t) p i, the fitness function for the preg-
nancy phase, Fpreg(x, l, i, t), is 0 if x ! xabo , where xabo is the
threshold level of blubber mass below which a fetus is Forward Iteration
aborted. Abortion can occur at any time during pregnancy,
although for simplicity, the energy contained in the fetus We used bp *(x, l, i, t) and bl *(x, m, l, i, t) to simulate the be-
cannot be reabsorbed. If we let V b (x, l, i, t) denote the fitness
p
havior and state dynamics of 200 females through time,
value of behavioral choice bp during pregnancy, then starting on April 1. This sample size captured individual
variability while ensuring manageable run times and array
F preg (x, l, i, t) p maxfV b (x, l, i, t)g:
p
ð5Þ sizes. Each whale’s initial condition was drawn from a uni-
form distribution X(1) ∼ U(xabo , xmax ), and the initial loca-
We linked the two phases (lactation and pregnancy) us- tion L(1) was either 1 or 2 (the breeding grounds). We used
ing sequential coupling (Mangel and Clark 1988; Clark and Monte Carlo simulations to account for the environmental
Mangel 2000). On the last day of the pregnancy (t p 243), a stochasticity encountered at each time step (Mangel and
female needs to be in the breeding ground, otherwise her fit- Clark 1988; Clark and Mangel 2000), which was determined
ness is set to 0 (i.e., the newborn calf dies). The fitness at the by l(l, i) and p(i, l, t, j). We accounted for the degradation of
end of pregnancy defines the expected fitness at the begin- a food patch using the mean time spent in area-restricted
ning of lactation: search behavior (Bailey et al. 2010). Specifically, after 21 days
of daytime feeding in the same patch (Bailey et al. 2010),
F preg (x, l, i, t) p F lac (x0 , m0 , l, i, t 1 1), ð6Þ patches with food (patch types 1 and 2) became patches with-
out food (patch type 3). Decisions regarding abortion, star-
where F preg (x, l, i, t) p 0 for all L(t) p l 1 2 (i.e., outside the
vation, and calf survival followed the same rules described
breeding grounds) and for x ! xabo , m0 p 0:06 (i.e., the
above. Females that aborted their fetus were counted and re-
calf ’s proportion of blubber mass at birth, assuming that a
moved from future time steps in the simulation.
calf is born with minimum blubber mass to allow survival),
and x0 is the female’s blubber mass at t, minus the costs of the
last day of gestation and the costs of resting for the entire day
Simulated Scenarios
(see details in apps. B, C).
We obtained the cost of traveling for a day from allome- We employed a series of forward MC simulations to show
tric estimates of the minimum cost of transport provided by how the model could be used to assess changes in vital rates
Williams (1999) and approximated the cost of feeding us- due to both environmental and anthropogenic disturbances.
ing the rorqual average active metabolic rate described in Specifically, we considered five scenarios.
Potvin et al. (2012). The amount of time spent feeding in
a day depended on the encountered krill density, the size Natural Disturbance. Scenario 1: El Niño (ENSO) condi-
of the buccal cavity, and digestion times (Wiedenmann et al. tions. This climatic oscillation results in a northward shift
2011; Goldbogen et al. 2015). We assumed that whales feed in the distribution of N. simplex and an overall reduction
only in daylight hours (Fiedler et al. 1998). When not feed- in upwelling intensity in the southern and central California
ing, a whale rested, with a resting metabolic rate twice the Current, where productivity is reduced and confined to
value of its basal metabolic rate, following Potvin et al. (2012). coastal pockets (Chavez et al. 2002; Marinovic et al. 2002).
We estimated the costs of supporting the growing fetus at dif- ENSO is a periodic climatic event, so it is expected to be part
ferent stages of gestation based on Lockyer (1981) and used of the whales’ evolutionary history.
information on calf growth rate, calf metabolic rate, and lac- Scenario 2: A sudden and unprecedented change in the
tation from Lockyer (1981) and Oftedal (1997). We assumed whales’ environment. As an example, we used the anoma-
reproductive females were at their average asymptotic length lous conditions observed in 2005, when upwelling in the
This content downloaded from 073.109.057.023 on December 14, 2017 04:50:35 AM
All use subject to University of Chicago Press Terms and Conditions (http://www.journals.uchicago.edu/t-and-c).Modeling Baleen Whale Migration E000
California Current was delayed by 2–3 months, causing a 0.8 indicating small, intermediate, and large effect sizes, re-
reduction in productivity at an intensity comparable to an spectively (Cohen 1977).
El Niño event (Brodeur et al. 2005; Schwing et al. 2006).
Sensitivity Analysis
Anthropogenic Disturbance. Anthropogenic scenarios rep-
resented extreme disturbances, and we used them to illus- We used a sensitivity analysis to identify the parameters
trate possible applications of the model. We simulated dis- that had the largest influence on simulation results. We in-
turbance as occurring at given locations with specified daily dividually varied each parameter by 510%, 520%, and
probability. When in a disturbed location, a whale had the 540% from the original value, while holding all others con-
option to change her behavior and select the second-best stant. We tested model sensitivity to 41 parameters, result-
alternative. Each individual had a probability rw of moving ing in 246 investigations of sensitivity (full list in the sup-
away from a disturbed location (McHuron et al. 2017). When plementary material, available online in a PDF). For each
a whale chose to stay in the disturbed location, her feeding ac- investigation, we reran the SDP backward iteration and 100
tivity was partially impaired (Goldbogen et al. 2013; DeRuiter replicates of the forward iteration. We calculated mean re-
et al. 2016; Friedlaender et al. 2016). To do this, we reduced cruitment probability in the undisturbed scenario for the base-
the amount of time available to feed on that day by a propor- line and for each sensitivity combination, as well as the value
tion, sd, which could indicate the severity or duration of the of Cohen’s d for disturbed scenarios.
disturbance or the whale’s response. We considered three The code and associated data to run the SDP model,
scenarios for disturbance. Monte Carlo simulations, and sensitivity analysis are de-
Scenario 3: An intense, localized disturbance source, that posited in the Dryad Digital Repository: http://dx.doi.org
is, operating at one location, with a daily probability of 1 /10.5061/dryad.md416 (Pirotta et al. 2017).
and reducing available foraging time to 0. This could corre-
spond to a naval sonar exercise, a seismic survey for oil and
Results
gas exploration, or the construction of an offshore wind
farm. All whales were assumed to remain in disturbed loca- The forward MC simulations (based on the matrix of opti-
tions; that is, all r w p 0. mal behavioral decisions) generated results that are consis-
Scenario 4: As scenario 3, but all whales were assumed tent with observations of ENP blue whales’ natural behav-
to move to an undisturbed location; that is, all rw p 1. ior. Individual blubber mass oscillated in the first phase
Scenario 5: Weak disturbance over a large scale. Half of of migration (fig. 2A), when the whales stopped to feed in
the locations (selected at random) were disturbed with a the lower-quality patches along the coast of the Baja Cal-
50% daily probability, causing a 50% reduction in available ifornia Peninsula (fig. 2B, 2C). As females’ blubber mass im-
time to feed if females remained in the disturbed location. proved, they progressively moved northward into the waters
A whale’s tendency to move away from disturbance was of California, which most whales reached around June (fig. 2C).
drawn from a beta distribution, that is, rw ∼ b(5, 5). This In these locations and those farther north (fig. 2C), females
scenario could exemplify shipping traffic or whale watching, could feed on high-density patches of larger krill, allowing
that is, regular, low-intensity disturbance covering a large them to obtain the maximum blubber mass defined by their
portion of the species’ range. physiological limitations (fig. 2B). With the approach of au-
Additional details of simulated scenarios are reported in tumn, the best strategy for the simulated whales consisted
appendix D. Since ENSO events are part of the whales’ evo- of staying in prey-rich Californian waters as long as possible
lutionary history, we reran the backward iteration to estimate to maintain their blubber stores before starting their migra-
optimal behavioral decisions under the altered environment tion back south to give birth to the calf (fig. 2C). This last
defined in scenario 1. For the remaining scenarios, we used stage was completed quickly, without stopping for food
the SDP results under normal conditions and perturbed the (fig. 2A). During the winter, female blubber mass declined
environment in the forward simulations. We ran each MC dramatically, primarily as a result of the milk delivered to
simulation 100 times and recorded mean recruitment prob- the dependent calf (fig. 2A, 2D). As female blubber mass de-
ability, mean number of abortions, mean number of calf star- clined, calf condition increased concomitantly (fig. 2D).
vations, and mean number of female starvations for all un- Females and their calves moved within the breeding grounds
disturbed and disturbed conditions. To compare recruitment until spring (fig. 2A, 2C), when they could start profiting
probability among scenarios, we computed the value of Co- from the enhanced productivity of the low-quality patches
hen’s d for each simulation (Cohen 1977; McHuron et al. in the breeding grounds and along the Baja California Pen-
2017) and averaged it over the 100 replicates. Cohen’s d is insula in order to recover their energy stores (fig. 2B). As en-
the difference between mean recruitment probabilities scaled vironmental productivity increased, whales quickly traveled
by the pooled standard deviation, with values of 0.2, 0.5, and toward the richer patches of California to support the final
This content downloaded from 073.109.057.023 on December 14, 2017 04:50:35 AM
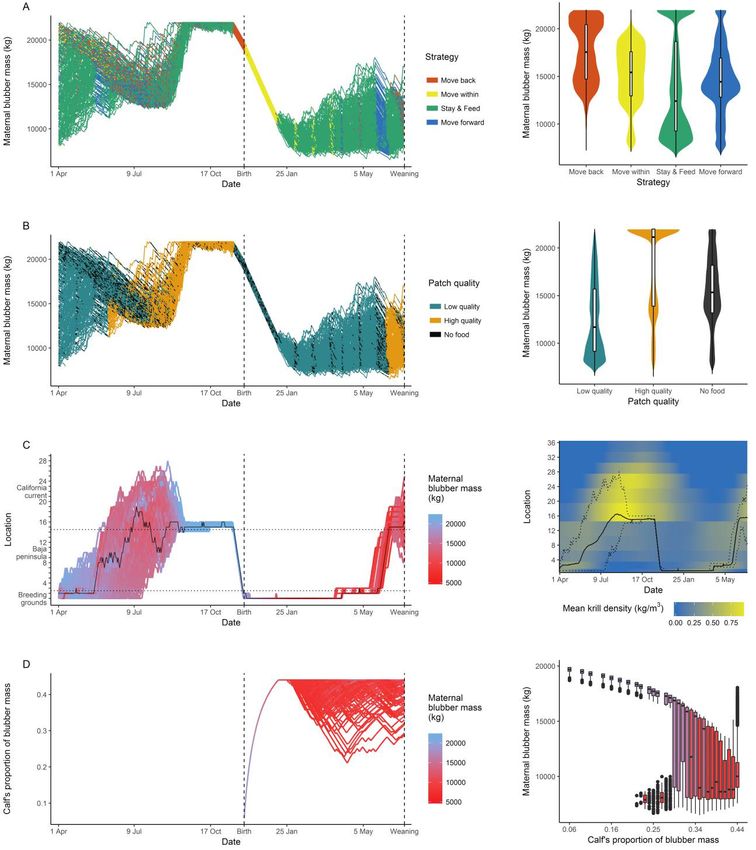
All use subject to University of Chicago Press Terms and Conditions (http://www.journals.uchicago.edu/t-and-c).Figure 2: Model results. A, Variation in blubber mass over time for 200 females in one run of the forward iteration, colored by behavioral
decision at each time step. Birth and weaning are indicated by vertical dashed lines. Right, a violin plot of blubber mass under different be-
havioral decisions. B, A similar plot for the variation in blubber mass over time, but colored by encountered patch quality; right, the blubber
mass in patches of different quality. C, Changes in location over time for 200 females over one run of the forward iteration, colored by the
corresponding blubber mass and an individual example (black line). Location number varies from 1 (breeding ground) to 36 (northernmost
extent of the migration). Horizontal dotted lines represent transitions between geographical regions. Right, a heat map of mean krill density
in each location over time, varying between 0 kg/m3 (blue) and 0.93 kg/m3 (yellow). In black, the mean (solid line) and range (dotted lines) of
whale locations over one run of the forward iteration. D, Changes in calf’s proportion of blubber mass over time for one run of the forward
iteration, colored by maternal blubber mass. The calf starts accumulating blubber mass after it is born at t p 244. Right, relationship between
female and calf condition.
E000
This content downloaded from 073.109.057.023 on December 14, 2017 04:50:35 AM
All use subject to University of Chicago Press Terms and Conditions (http://www.journals.uchicago.edu/t-and-c).Modeling Baleen Whale Migration E000
part of lactation (fig. 2C), although this was not sufficient to with an increase in mean number of calf starvations during
regain high blubber reserves (fig. 2D). lactation from 0 to 0.2%. However, based on Cohen’s d p
Overall, when females were in poor condition or aiming 0:24, the effect size was small. An unprecedented change
to maintain high reserves, they remained in a patch to feed in the environment (scenario 2) resulted in a more dramatic
(fig. 2A). Traveling occurred when a female’s condition im- decline in mean recruitment (from 95% to 69%) and a large
proved or when constrained by reproductive needs. Patches effect size (Cohen’s d p 0:84), mostly driven by a steep
with no food were mostly used for transit, and females rise in the number of abortions (from 2% to 25.5%; fig. 4).
moved away or within them (fig. 2A, 2B). Female condi- The effects of an intense, but localized anthropogenic source
tion matched food availability, so blubber mass was higher of disturbance depended strongly on the whales’ response:
in richer patches (fig. 2B) and more productive locations when the whales stayed and fed in the disturbed patches (sce-
(fig. 2C). During pregnancy, most metabolic expenditure nario 3), mean abortion rate rose to 12.5% and mean percent-
could be ascribed to feeding, especially as the fetus grew, age of calf starvations rose to 18.5%. In this scenario, females
while gestation costs were comparatively low (fig. 3). Dur- were unable to support lactation, and mean recruitment fell
ing lactation, milk delivery became the critical energy cost to 63%, a large effect size (Cohen’s d p 0:99; fig. 4). How-
(fig. 3). In both stages, traveling was relatively inexpensive ever, when all whales moved away from the localized distur-
and exceeded resting costs by only a small amount (fig. 3). bance (scenario 4), there was no detectable change (Cohen’s
A female’s condition at the start of the simulation af- d p2 0:01) in mean recruitment probability (95%; fig. 4).
fected her initial behavioral decisions and blubber dynam- Finally, a weak but diffuse disturbance (scenario 5) caused
ics (fig. 2A). Low initial state also resulted in a few early a small decrease (Cohen’s d p 0:08) in mean recruitment
abortions (2%, on average, over 100 replicates). However, probability to 94%, which included a small increase in calf
initial conditions became irrelevant as whales reached Cali- starvations (0.2%, on average; fig. 4).
fornia waters in summer, where they could fully replenish The sensitivity analysis highlighted that the most influ-
their blubber stores in good years (fig. 2A). At the end of ential parameters were the morphology of the female and
100 iterations of the forward simulation, the mean propor- calf (e.g., her energy storage abilities and the allometric re-
tion of the calf’s mass that was blubber was 0.43 (standard lationships), the metabolic rates in different activity states,
deviation: 0.03). Combining state-dependent calf recruit- the characteristics of the environment and prey, and the
ment to the population and initial abortions resulted in a scaling parameter of the calf survival function (m50). Other
95% mean calf recruitment probability (fig. 4). aspects of whale physiology, such as costs of pregnancy
Under scenario 1 (El Niño environmental conditions), (with the partial exception of fetus size and heat increment
recruitment probability declined to 92%, on average (fig. 4), of gestation), costs of lactation (with the exception of the
Figure 3: Metabolic costs of different activities (megajoules [MJ]) during pregnancy and lactation. Energy expenditure was averaged across
200 females and across the days that constitute each phase. Feeding and resting costs were calculated assuming a fixed krill density corre-
sponding to 12 h per day of active feeding. Lactation costs correspond to maximum milk delivery rate.
This content downloaded from 073.109.057.023 on December 14, 2017 04:50:35 AM
All use subject to University of Chicago Press Terms and Conditions (http://www.journals.uchicago.edu/t-and-c).E000
Figure 4: Variation in maternal blubber mass over time under environmental and anthropogenic disturbance scenarios and corresponding changes in calf recruitment probability
(boxplot). Vertical dashed lines indicate time of birth (B) and weaning (W). Vertical black lines indicate abortions or starvations.
This content downloaded from 073.109.057.023 on December 14, 2017 04:50:35 AM
All use subject to University of Chicago Press Terms and Conditions (http://www.journals.uchicago.edu/t-and-c).Modeling Baleen Whale Migration E000
relative threshold), energy requirements of the growing calf, data (Mate et al. 1999; Calambokidis et al. 2009; Bailey et al.
and the dynamics of digestion, were comparatively less im- 2010). Although individual migratory strategies varied, the
portant. Overall, the results of the first three disturbance forward simulations also highlighted a whale’s ability to trade
scenarios showed higher sensitivity to model parameters, off the distance to reach a patch against its quality, so that
while conclusions from scenario 4 and 5 were largely un- some individuals used northern, high-quality patches, while
changed. A full description of the results is provided in the others focused on closer, but lower-quality patches along the
supplementary material. Baja California Peninsula. This plasticity arose because opti-
mal behavior was determined by current fat reserves, future
reproductive needs, and time constraints (fig. 2; Mangel and
Discussion
Clark 1988). However, at certain stages of migration, there
We developed a dynamic state variable model that syn- were some areas that appeared to be critical to all individuals
thesizes the behavioral, physiological, and environmental for maintaining good condition (e.g., the waters off California
constraints shaping the ecology of migratory populations. in late summer). That is, different parts of a migratory species’
We used the model to investigate the complex interaction range have different contributions to fitness (Alerstam et al.
between a female’s energy budget and her ability to exploit 2003). The highly variable metabolic costs of different activi-
dynamic environmental resources to successfully repro- ties and how these combined in the two phases of the repro-
duce. By characterizing the physiological mechanisms and ductive cycle also contributed to predicted behavior (fig. 3).
challenges that an individual experiences through migra- Lactation was the costliest phase of a whale’s reproduc-
tion, the model can be used to understand the processes that tion, leaving a female in a state of extreme energy depletion
drive the evolution of life-history strategies and behavioral at her calf ’s weaning (figs. 2, 3; cf. Lockyer 1981; Oftedal
patterns. This enables us to predict the consequences of be- 1997). In terms of energy transfer from mother to calf,
havioral changes caused by environmental or anthropogenic females maximized milk delivery in the first weeks of the
disturbances on population dynamics (Wiedenmann et al. calf ’s life when their condition was high, relying on body
2011; McHuron et al. 2017). We applied the framework to reserves accumulated in the feeding grounds. In this phase,
migratory baleen whales, choosing the ENP blue whale pop- females behaved as stereotypical capital breeders. However,
ulation as an example of how the model could be parameter- nursing activity became more irregular as blubber reserves
ized. Model results provide practical guidance for identifying were depleted and females had to start feeding to supple-
the critical data required to inform such an approach and ment their energy stores (fig. 2). This suggests that females
suggest ways to assess knowledge gaps and uncertainty, mak- need to feed during winter to survive through lactation. The
ing it applicable to other populations of migratory animals. flexibility of their reproductive strategy reinforces the idea
Our approach accounts for behavioral decisions result- that there is a continuum between pure capital and pure in-
ing from the trade-off between an individual’s condition, come breeding and that the interplay between morphology,
the metabolic costs of different activities, the characteris- physiology, and food availability drives the observed provi-
tics of the external environment, and the moment in time sioning strategy (Stephens et al. 2014). The initial condition
(Mangel and Clark 1988). Although behavioral decisions of pregnant whales only affected behavioral decisions and
were simplified to either staying in a patch or moving, the expected reproductive success in the first phase of the re-
model captured the dramatic fluctuations in body condi- productive cycle. Whales in poor condition could lose the
tions experienced by a pregnant female throughout a repro- fetus before reaching foraging patches productive enough
ductive cycle (Lockyer 1986; fig. 2). Because of the large var- to replenish their blubber stores. However, they were not
iation in where and when females could accumulate energy at a disadvantage once they made it through the summer
for survival and reproduction, the local dynamics of pro- feeding season in good years (fig. 2). As a result, carrying
ductivity drove their behavior. This gave rise to the emer- a fetus to term may not represent a physiological bottle-
gence of the migratory behavior, as whales tracked the south- neck, which is confirmed by the low abortion rate in histor-
to-north seasonal wave of productivity along the coast in ical whaling records (Ichihara 1962). Under the modeled
order to support their high energetic requirements (Croll environmental conditions, whales appeared to be able to
et al. 2005; fig. 2). Our model, therefore, provides support fully replenish their body reserves in summer (fig. 2). Nat-
for the hypothesis that migration evolved to exploit tempo- ural interannual resource variability may compromise such
rally productive, spatially explicit regions, while meeting the good performance and have cascading effects on reproduc-
demands of reproduction (Alerstam et al. 2003; Lennox et al. tive success, as our environmental perturbation simulations
2016). suggest (fig. 4).
The timing of the various stages of migration resulting Little is known about baleen whale energy dynamics dur-
from our forward simulations broadly matches the infor- ing pregnancy and lactation (Oftedal 1997; Williams et al.
mation provided by observational studies and telemetry 2013; Christiansen et al. 2014), and our results could be
This content downloaded from 073.109.057.023 on December 14, 2017 04:50:35 AM
All use subject to University of Chicago Press Terms and Conditions (http://www.journals.uchicago.edu/t-and-c).E000 The American Naturalist
used as testable hypotheses to drive future research efforts. duction in available foraging time. As a result, their condi-
For example, it will be critical to verify whether weaning tion deteriorated and the probability of calf recruitment
time is flexible so that females can respond to variable feed- declined following increased abortions and starvation. In
ing conditions, whether females abandon calves when con- contrast, when whales moved away from disturbed loca-
sistently unable to provide milk and whether calf births can tions and fed elsewhere, there was no detectable long-term
occur outside the breeding grounds, since these assump- effect. It is therefore important to investigate whales’ behav-
tions can have large effects on model construction and re- ioral responses to disturbance and, particularly, the context
sults. Calf recruitment rate in the baseline scenario (95%) in which these responses may change. The interruption of
was higher than first-year survival rates estimated for other feeding activity can depend on patch quality (Hazen et al.
species (e.g., 87.5% in humpback whales; Barlow and Clap- 2015; Friedlaender et al. 2016) and on the whale’s behav-
ham 1997), but our estimate does not include mortality after ioral state (Goldbogen et al. 2013). Other contextual factors,
weaning. This result is another hypothesis to test with future such as body condition, time of year, availability of alterna-
empirical studies. tive feeding areas, and individual differences, may also play
Simulating environmental change over a short temporal an important role (Beale and Monaghan 2004; Ellison et al.
scale, such as caused by El Niño (e.g., Chavez et al. 2002), 2012). The extent of the disturbance, the distance traveled
led to a reduction in calf recruitment probability, consistent to avoid it, and the intensity of feeding impairment should
with studies on pinnipeds (e.g., Le Boeuf and Crocker 2005). also be considered, instead of the fixed 100% or 50% reduc-
The reduction was small, since we assumed whales’ behav- tion in feeding we used here for illustration. Moreover, a
ior is adapted to cope with such periodic variation in their whale’s responsiveness may evolve over time (Bejder et al.
environment. Telemetry studies have shown whales in good 2009; McHuron et al. 2017). Because of the difficulties asso-
condition using northern waters unaffected by El Niño in ciated with data collection, there is limited empirical evi-
the relevant years (Bailey et al. 2010). Migratory species, which dence on the impacts of anthropogenic disturbance on vital
have evolved to track variations in their habitat, are ex- rates in cetacean populations (National Research Council
pected to show some plasticity in their movement strategies 2005). However, a decline in first-year calf survival by 56%
(Lennox et al. 2016). The ability of whales to compensate was detected in the bottlenose dolphin population of Doubt-
for lower food availability in Californian waters during El ful Sound, New Zealand, following anthropogenic and en-
Niño years is possible due to the low mass-specific cost of vironmental perturbations (Currey et al. 2009), which is
transport associated with their large size (Williams 1999). even larger than the predicted decline under our extreme
This corresponded with the lower metabolic expense assumed scenario 3.
in our model (fig. 3), allowing individuals to travel between These results highlight the need for careful planning of
alternative patches and reach those with higher productivity acute anthropogenic disturbances, in order to avoid locations
at little cost. In contrast, unprecedented environmental change and times critical to the focal species (Foley et al. 2010). How-
strongly affected reproductive success, particularly in the first ever, a weak but long-term disturbance (e.g., noise result-
phase of the cycle, when failure to compensate resulted in a ing from regular shipping traffic) may have chronic con-
large number of abortions (fig. 4). These results, although only sequences on whale physiology, leading to a less dramatic
illustrative and simulated, raise concern regarding the whales’ but progressive population decline (Ellison et al. 2012). Our
ability to respond to the unpredictable environmental shifts model estimates the effects of disturbance on important vital
that are anticipated due to global climate changes (e.g., Ha- rates, such as successful weaning of a calf and female survival.
zen et al. 2012; IPCC 2014). Although whales may use strat- Evaluation of the population consequences of disturbance
egies developed in their evolutionary history to address peri- will require that the results of these effects be integrated over
odic declines in environmental productivity, these new features a longer time horizon, either via SDP extended to a female’s
of the environment may be sufficiently different from pre- reproductive lifetime or by incorporating these effects into a
viously experienced scenarios that responses could be diffi- population model (New et al. 2014; Villegas-Amtmann et al.
cult or maladaptive. 2015).
When considering the potential consequences of extreme Our work shows how to integrate studies on the fine-
responses to anthropogenic disturbance, the effect of a low- scale energetics of lunge feeding and swimming dynamics
intensity disturbance over a diffuse area (e.g., from shipping (Goldbogen et al. 2011; Wiedenmann et al. 2011; Potvin
traffic or whale watching) on reproductive success was mini- et al. 2012; Hazen et al. 2015) with large-scale information
mal. However, the effect of intense, continuous, but con- on movement patterns and migratory strategies (Mate et al.
fined disturbance in the main summer feeding ground (e.g., 1999; Bailey et al. 2010; apps. A, B). We modeled the envi-
a seismic survey or the construction of a wind farm) depended ronment with intermediate complexity (Plagányi et al. 2014),
on the behavioral response. When whales stayed in the dis- capturing the seasonal, spatial, and stochastic variation driv-
turbed environment, they could not compensate for the re- ing the availability and distribution of prey resources (Fiedler
This content downloaded from 073.109.057.023 on December 14, 2017 04:50:35 AM
All use subject to University of Chicago Press Terms and Conditions (http://www.journals.uchicago.edu/t-and-c).Modeling Baleen Whale Migration E000
et al. 1998; Croll et al. 2005). By treating behavior as an evo- Potvin et al. 2012; Villegas-Amtmann et al. 2015); and (4) ad-
lutionary trait, state-dependent life-history theory naturally ditional studies using long-term telemetry data, particularly
integrates internal and external factors that are influencing of individuals wintering near the Costa Rica Dome and in
individuals’ decisions at multiple scales, while explicitly mod- feeding areas during years with anomalous productivity (Mate
eling their energetic and long-term fitness implications (Man- et al. 1999; Bailey et al. 2010).
gel and Clark 1988; Houston and McNamara 1999; Clark and
Mangel 2000). As such, it has potentially wide applications
to other species of migratory marine animals that depend
Conclusion
on similarly dynamic environmental resources and are sub-
ject to comparable reproductive constraints. In addition to We developed an effective predictive approach to explore
many other cetacean species, some species of pinnipeds, baleen whale migratory ecology and assess the consequences
seabirds, elasmobranch, large teleosts, and turtles rely on re- of human and environmental disturbance on their repro-
stricted areas to reproduce, show plastic behavioral traits, ductive success. The model highlights trade-offs individuals
and are highly affected by fluctuations in prey availability face between condition, reproductive needs, and the environ-
(Alerstam et al. 2003; Lennox et al. 2016). Our understand- ment, resulting in large fluctuations in energy reserves and
ing of their feeding, reproductive, and migratory ecology the emergence of migration. This tool could be used to sup-
may thus benefit from simulations grounded on energetic port management decisions regarding proposed activities in
and behavioral principles, such as the ones achieved via a population’s range, while identifying important knowledge
our model. gaps that should be targeted by future research. Our work
Many parameters are required to build SDP models, and aligns with efforts to combine behavioral and physiological
their estimation can be problematic for long-lived, large an- research to support wildlife conservation (Cooke et al. 2014)
imals such as marine mammals (McHuron et al. 2017). We and is thus firmly in Pasteur’s quadrant, in which funda-
extracted information from the whaling literature, but this mental understanding is sought in the resolution of an im-
often involved data from different regions or species and portant applied problem (Stokes 1997; Clark et al. 2016).
may suffer from unknown sampling biases. Moreover, some We demonstrated how context, in both the nature of distur-
parameters remain impossible to measure given logistical bance and whale behavioral responses, can drastically change
and ethical restrictions in large vertebrate research (Gales conclusions regarding the long-term effects of disturbance
et al. 2009). Most approaches aiming to link behavior to pop- (Ellison et al. 2012). Moreover, we showed how environmen-
ulation dynamics face similar difficulties. Dynamic state var- tal changes can disproportionately affect reproductive suc-
iable modeling allows for an explicit investigation of the cess depending on how whales react and adjust to a perturbed
effects of model assumptions, providing a robust way to ex- environment. The approach outlined here could be adapted
plore the results’ sensitivity to parameter variation, which to other marine migratory species for which information on
can direct data collection efforts to efficiently tackle the most morphology, feeding and swimming energetics, ranging be-
crucial uncertainties (Mangel and Clark 1988; Clark and Man- havior, and reproductive physiology is available. Although
gel 2000). extensive prior knowledge is required to inform the param-
From the sensitivity analysis (supplementary material), eters of the model, its structure is flexible and data from com-
we found that the scenarios for environmental change and parable species could be used in the interim, while providing
extreme response to anthropogenic disturbance were the ones an indication of how the associated uncertainties influence
most affected by parameter uncertainty. We also confirmed the results.
the need for a better understanding of adult and calf mor-
phology, characteristics of the environment, food resource
dynamics, movement mechanics, metabolic rates in differ-
Acknowledgments
ent activity states, and the whales’ ranging pattern and mi-
gratory behaviors. These gaps in our knowledge could be This research was developed in association with the Office
filled using (1) further photogrammetry studies as well as ul- of Naval Research (ONR)–supported Population Conse-
trasound blubber measurements (Gilpatrick and Perryman quences of Acoustic Disturbance/Population Consequences
2008; Miller et al. 2011); (2) prey sampling across a wider of Disturbance working group and by ONR grant N00014-
spatiotemporal range or indirect assessment from long- 08-1-1195, the E&P Sound and Marine Life Joint Industry
term monitoring of whales’ foraging behavior in different con- Project of the International Association of Oil and Gas Pro-
texts (Nabe-Nielsen et al. 2014; Goldbogen et al. 2015; Hazen ducers. J.A.G. was supported by funding from the ONR
et al. 2015) and in response to sound exposure (Friedlaender Young Investigator Program (award N00014-16-1-2477).
et al. 2016); (3) hydrodynamic modeling using fine-scale tag We acknowledge the field crews, the research, and the ad-
data paired with bioenergetic studies (Goldbogen et al. 2011; ministrative staff at the Oregon State University (OSU) Ma-
This content downloaded from 073.109.057.023 on December 14, 2017 04:50:35 AM
All use subject to University of Chicago Press Terms and Conditions (http://www.journals.uchicago.edu/t-and-c).You can also read