A Fresh Perspective on U.S. Online Grocery Shopping in 2022 and Beyond - Insights for practitioners based on a U.S. representative study about ...
←
→
Page content transcription
If your browser does not render page correctly, please read the page content below
+

U.S. Online Grocery Report

A Fresh Perspective on U.S. Online
Grocery Shopping in 2022 and Beyond
Insights for practitioners based on a U.S. representative
study about customer buying behavior, brand perception,
and the role of technology

Content
          Intro                                                                         3

                  About the study                                                       3

                  Relevance of online groceries and current events                      4

          Part 1: Status Quo Food Retail & Online Grocery                              5

                  Americans’ baseline for grocery shopping                             5

                  Offline vs. online grocery shopping                                   7

                  Use cases of online grocery offerings                                 9

                  Brand perception of U.S. online grocery providers                    11

                  Where Americans buy groceries online                                 13

                  How Americans buy groceries online                                   15

                  Technical user needs and expectations for online grocery solutions   17

                  Opportunities in ready-made food for online grocers                  17

          Part 2: The future of online grocery in the U.S.                             20

                  Grocery shopping in two years                                        21

                  Motivators and blockers                                              22

                  Fans and opponents
          Conclusion

                                                                                        2
Intro
About the study

The U.S. Online Grocery Report 2021 is based on      shopping, online delivery, and ready-made-food
a study run by real-time market research provider    options. The respondents ranged between 16 and
Appinio and digital commerce platform provider       65 years old and lived in the U.S. at the time of the
Spryker. It contains the most current data set on    survey. Geographically, 21% of respondents repor-
the use, brand perception and potential of online    ted that they lived in urban cores, 35% in large
grocery shopping in the US. In a nationwide repre-   suburban regions, 17% from smaller metropolitan
sentative survey, Appinio asked 2,500 participants   areas, and 27% across rural regions. The survey
about their experiences and opinions of grocery      was conducted in September 2021.

                                                                                                         3
If you want to deep dive into the data, you can access Appinio‘s interactive dashboard containing the
entire data set. Simply click the link below and set your own filters, change display options and create your
own analyses.

       Open dashboard with entire data set

                                                                                                            4
Relevance of online groceries and current events

Pandemic, digital transformation and heated competition are shaking up the U.S. food and grocery
industry. This report offers a fresh and data-driven perspective on current challenges and opportuni-
ties within the online grocery industry. In a representative study, we surveyed U.S. consumers and asked
about their online grocery shopping behavior and perceptions. We analyzed the results to bring value for
suppliers, manufacturers, and retailers with insights and practical implications for future online growth.

                                                    When large markets experience small changes, it can
                                                    make a big difference. The U.S. food and grocery in-
                                                    dustry is not big. It’s huge! Combined grocery sales
                                                    through all channels hit $1.40 trillion in 2020, which
                                                    is an increase of more than 12% from $1.24 trillion in
                                                    2019. With that, the changes moving the market are
                                                    massive.

                                                    Digital transformation has reached one of the last re-
                                                    tail segments where consumers shopped more offline
                                                    than online. Shifts toward omnichannel strategies
                                                    have led to U.S. online grocery sales hitting $110.72
                                                    billion in 2020. That’s a 108.2% increase from $53.19
                                                    billion in 2019. An additional 50 million people in the
                                                    U.S. purchased groceries using an e-commerce solu-
                                                    tion during the pandemic, compared to 2019.

                                                    The pandemic gave online grocery an unforeseen
                                                    boost. But how will the lockdown-induced shift to
                                                    online offerings fare in the long term? And what can
                                                    we assess as a ‘new normal’ in grocery shopping?

                                                    In a way, grocery retailers are in a unique situation.
                                                    They can reasonably expect to have customers so
                                                    long as people need food. However, evolving cus-
                                                    tomer expectations have already uprooted where
                                                    and how consumers shop for food. To better un-
                                                    derstand this situation and help grocers, retailers,
                                                    and suppliers make the right business decisions, we
                                                    asked 2,500 U.S. consumers about their online gro-
                                                    cery shopping habits and attitudes towards purchas-
                                                    ing online in the future. A deep dive into the data
                                                    revealed some interesting key takeaways.
                                                                                                          5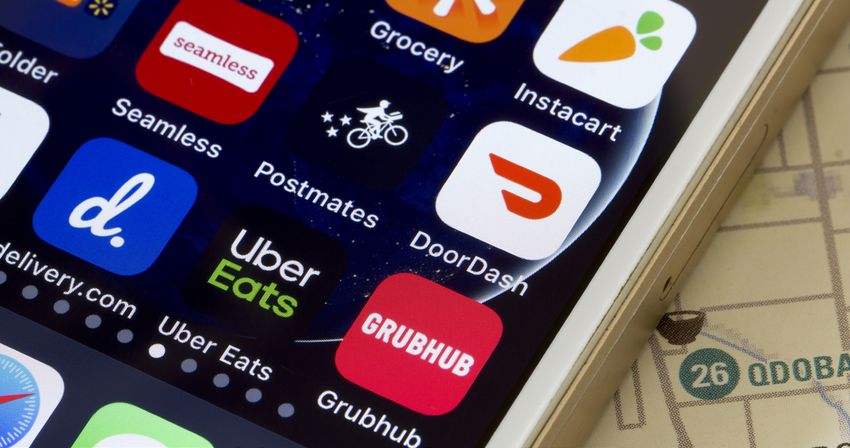
Offline vs. online: e-grocery use cases, target groups, and trends
 There’s no doubt customers’ expectations surrounding online purchases have drastically changed. Some
 argue that customers now expect omnichannel experiences, and options like curbside pickup or BOPIS
 (buy online pickup in store) are a must-have. Others observe that even with the availability of online
 options, many consumers still clearly prefer offline. We take a closer look at the data to help answer
 these questions: What are some real-world use cases for e-grocery offerings? How are they used, and
                                by which target groups? How will this change in the coming years?

                                                     Competition: brand perception,
                                                     customer retention, and platform
                                                     preferences
                                                       Amazon bought Whole Foods, Walmart ac-
                                                       quired Jet.com, and recently Uber announced
                                                       its intention to become the leader in grocery
                                                       delivery with the launch of Uber One, a new
                                                       perk-filled membership program. Grocery has
                                                       always been a competitive market, but with the
                                                       entry of more e-grocery providers, competi-
                                                       tion is certainly heating up. We wanted to find
                                                       out how many providers do consumers actu-
                                                       ally need? How do they perceive and use the
                                                       brands within the ecosystem? And how do they
                                                       rate online shopping options from big box retail-
                                                       ers, discounter grocers, third-party platforms,
                                                       and others?

                                                     Customer experience: technology,
                                                     features, ordering and delivery models
                                                       In a short period of time, an enormous number
                                                       of consumers have moved beyond the normal
                                                       once-a-week in-store grocery shop. Customer
                                                       expectations continue to evolve, and grocery re-
                                                       tailers will need to figure out how to meet these
                                                       new demands with seamless digital customer
                                                       experiences. But what makes an outstanding
                                                       online grocery experience? How does consum-
                                                       er behavior differ in online channels? And which
                                                       features and services are particularly important
                                                       to online users?
                                                                                                       6
Part 1:

Status Quo Food Retail
& Online Grocery
Americans’ baseline for grocery shopping
Grocery shopping is not fun
The first thing we wanted to find out from our       Distance is another factor. Our data shows that
study participants was what grocery shopping         for consumers, the farther the grocery store, the
means to them (question 5). Do Americans like        more they tend to view the shopping experience
doing groceries? Almost half (45%) responded         as unpleasant. Those who live more than five
that grocery shopping is a „chore that must be       miles away from the nearest grocery store dislike
done“. This is high compared with similar respons-   shopping 50% of the time. For those living in rural
es in other countries. For instance, posing the      areas, this figure is as high as 53%.
same question to a representative sample in Ger-
many revealed that only 35% of Germans dislike       These numbers indicate a fundamentally great
grocery shopping.                                    potential for alternative offers, services and busi-
                                                     ness models that can help make grocery shopping
The most positive sentiments towards grocery         less of a chore for consumers.
shopping came from the oldest (55-65) age de-
mographic. But even among them, 42% find going
to a grocery store an unpleasant experience.

                                For me, food / grocery shopping is...

                 ...a pleasant experience - 55%        ... a chore that must be done - 45%
                                                                                                        7
Oversupply, not only in urban cores
Another fundamental question is that of market                So, it can be concluded that accessibility is not
coverage of offline offerings. Are consumers sat-             an obstacle in offline groceries, as the stores
isfied with the selection and availability of grocery         are sufficiently available and easy to reach. The
stores? Or is a lack of accessibility driving the             only exception is rural areas, where the number
online trend?                                                 of consumers without a store within five miles is
                                                              three times higher than the average (17% vs. 6%).
We asked participants how many grocery stores                 But then again, even there, 36% of people have
they have within a five mile radius of their home,            three or more stores within a five-mile radius. In
and how far is the nearest store (questions 6 and             these areas, even without online offerings, the
7). Almost two thirds of respondents (62%) live               grocery market is competitive and saturated with
near three or more grocery retailers, and nearly              an oversupply rather than a shortage of options.
three in ten (29%) people have a choice of four               With easily accessible brick-and-mortar options,
or more grocery stores nearby. Not surprisingly,              we wanted to understand what’s motivating con-
nearly half (45%) of respondents live within a mile           sumers to purchase online.
of a nearby store. In cities with more than 500,000
inhabitants, this number is as high as 62%.

How many grocery stores are within a 5-mile radius of your home?

50%                             47%

40%                                                           38%                38%

30%
                                      22%               24%

20%         17%
                                                                           13%
                                                                                                   rural
10%
                   2%
                                                                                                   urban core
               None                 1-2                   3-4                 4+

                                                                                                                8
Offline vs. online grocery shopping
One in two already uses online grocery options
We asked the participants how they currently buy           Interestingly, this figure does not significantly de-
their groceries (question 8). The striking result:         pend on the size of the city or the density of the
Almost one in two Americans (47%) already                  population in the participants’ geographic location.
buys groceries online at least occasionally, i.e.          While the country’s northeast and rural areas are
from grocery retailers or other delivery services.         outliers with only 40% online grocery use, all other
Of those, 13% shop mostly (11%) or exclusively             regions are quite consistently at about 50% online
(2%) online.                                               grocery adoption rate. In other countries like Ger-
                                                           many, for example, this gap between urban and rural
                                                           areas is significantly larger, with an overall adoption
                                                           rate of online services that is about 10% lower.

How do you shop for groceries / food?
                                                                                              35%
                                                                                         mostly in-store,
              53%                                                                       sometimes online
       exclusively in-store
                                                                                              11%
                                                    47%                                  mostly online,
                                               online at least                         sometimes in-store
                                                sometimes                                      2%
                                                                                        exclusively online

The data illustrates that the market for online gro-       For the U.S., however, a look at the details also
ceries in the U.S. is already huge, and the rate of        shows: 55-65 year-olds are 7% more likely to say
adoption is well ahead of the international curve.         they buy exclusively in stores, while this figure is
Only in Asia, digitization is even more advanced:          10% below average for the 25-34 age group. If
Forecasts predict that online channels will account        older generations stick to brick-and-mortar store
for almost 7% of total grocery retail sales by 2022,       shopping and younger generations remain open to
and e-grocery penetration rates reach as high as           purchasing more and more online, the share of on-
73% in Singapore.                                          line grocery shopping will likely continue to grow.

Implications for practitioners

If every second person already uses online offers for grocery purchases, grocery retailers need to find a
way to serve this target group. Limited online initiatives will have to give way to a more customer-oriented
strategy. For retailers this means exploring a multichannel or omnichannel approach to deliver a range of
customer experiences to a broad customer base.

Despite the already high adoption rate, only 2% of U.S. consumers currently shop exclusively online. This
leaves plenty of space for grocery retailers and brands to meet their customers where they are -- using
both offline and online shopping options.
                                                                                                                 9
Bargain hunters are at odds
Price is always a significant deciding factor,
especially in B2C and food retail, where cus-
tomers are very money-conscious about their
spending. If any channel, online or offline, is
perceived as significantly more expensive than
the other, it would be a huge disadvantage. We
asked participants whether they feel like they
would usually pay more when shopping online
or offline (question 24).

While 20% of respondents say it would usually
be more expensive for them to buy groceries
online, 37% say they actually spend less online.
Another 37% think the way they purchase
groceries doesn’t influence their spending at
all, and the remaining 7% are unsure. So, the
picture is very mixed, and the majority are un-
decided or do not see strong price differences
between the channels.

Important to note is whether people are doing
their groceries mainly online or offline, the
frequency of online shopping does not signifi-
cantly influence this perception. When it comes
to gender, men are more likely to respond that
they spend more money online (23% vs. 17%
women). Women meanwhile see shopping
offline at brick-and-mortar stores as more
expensive (41% vs. 33% men). Overall, there
is no clear and commonly shared opinion that
either online or offline grocery shopping would
be more expensive than the other.

                                              10
Use cases of online grocery offerings
Convenience and time-saved are convincing factors
What drives online grocery shopping? We asked time, while 38% of 16-34 year olds attribute it to
participants about the reasons motivating their laziness. What is notable is that 45-54 year-olds
choices to shop for groceries online, to find out mention time savings particularly often, at 56%,
the most relevant use cases (question 17). It be- whereas laziness is mentioned primarily by 16-34
came very clear that the number one reason is year-olds, at 38%. But both of these top two re-
convenience. According to our survey, the most sponses clearly fall into the convenience category
frequently stated reasons for ordering online that offline offerings cannot provide. A seamless
are lack of time to go to a grocery store (50%), customer experience is therefore an important
and laziness to leave one’s house (34%). Inter- USP for any online grocery offerings.
estingly, 56% of 45-54 year olds mention lack of
When do you order groceries online?
49%
50%
40%
34%
30%
27%
20%
13%
10%
4%
When missing When too lazy to When no time to I’m doing all my Other
ingredients leave the house go to a grocer weekly grocery
while cooking shopping online
For the food industry, online means a shift in
sales channels and a deeper understanding of
the changing customer buying behavior. We will
take a closer look at how this can best be han-
dled technically in the chapter “Technical user
needs and expectations for online grocery solu-
tions” on page 21.
11Personal safety still a major concern
For a significant portion of respondents, personal
safety is a close second when it comes to fac-
tors affecting online grocery buying decisions. We
asked consumers about the main reasons they
shop for groceries online (question 18), 35% cited
personal safety as a main reason. Nearly two years
after the start of the pandemic, more than a third
of people are concerned enough about safety to
choose online options. Retailers must question to
what extent customers who’ve been accustomed
to the online channel for two years will return to
old patterns after the end of the pandemic. From
this perspective, COVID-19 has certainly given the
online grocery industry a kick-start.
A weekly habit
We wanted to understand how frequently con- Regardless of whether customers prefer delivery
sumers shopped for groceries online via different or BOPIS, more than half use their favorite online
channels. Are people exploring online options due channel at least once a week. In other words, for
to lockdowns, or are they curious about the pro- a majority of respondents online grocery shopping
cess? Are consumers shopping online regularly, or is a weekly habit.
on an ad-hoc basis, or when no other options are
available? And, to what extent has online grocery Among respondents, 12% (delivery) and 13% (BO-
shopping become a part of consumers’ everyday PIS) even use their preferred online option more
lives? than twice a week (questions 22 and 23). By con-
trast, those who use online less frequently than
Our data shows that more than one in four U.S. once a month total 16%. The number of regular
online consumers (27%) order all of their weekly to heavy users thus significantly exceeds that of
grocery shopping online. Only 13% of consumers casual online shoppers, making it clear that regu-
use online shopping spontaneously, for exam- lar weekly grocery shopping is already a legitimate
ple when missing an ingredient while cooking. use case for many online buyers.
Online grocery shoppers’ frequency of use of BOPIS (buy online, pick up in store)
and delivery options
40% 40%
40%
31% 34%
30%
20%
13% 12% 16% 15%
BOPIS
10%
delivery
Two or more Once a week Once a month Less than once
times a week a month 12Brand perception of U.S. online grocery providers
A triumvirate leading in a scattered market
In order to learn more about brand awareness of 17-21% of respondents. Major grocery brands and
providers within the American e-grocery land- retailers like Kroger, Target, and Safeway hover at
scape, respondents were asked prompted and around 2%, and together make up less than 10%
unprompted questions about brands. First, par- of brands that come to mind when thinking of gro-
ticipants were asked to list all the brands they cery delivery services. These are low figures even
could think of without being given any answer for unaided surveys and, in combination with the
options (question 10). Walmart, Instacart, and fact that no provider stands out, indicate that the
Amazon were the brands most frequently men- brand landscape is very scattered for consumers.
tioned. However, this is at a very low level. The This is a strong indication that the race for provid-
three leading brands were all mentioned by only ers to become the market leader is ongoing.
E-grocery brands that are top of mind of U.S. online consumers
13DoorDash, Grubhub, and the recognition paradox
Statistically more meaningful is the question it does not seem to be top of mind, as only 13%
about aided awareness. For example, whether mentioned the brand without an answer op-
consumers recognize brands that they are shown tion being provided. The same paradox applies
(question 11). According to our data, there is no to Grubhub (73% recognition), Postmates (52%
one provider that clearly stands out. It’s equally recognition), and more. Local presence might
striking that some brands have very high brand partly explain this scattered distribution, but it
recognition values, but were hardly mentioned in also becomes clear that no one supplier domi-
the unprompted query. nates the market. Interestingly, it also gives cause
to wonder why no brand has successfully figured
DoorDash for example, is the most recognized out how to differentiate itself in consumers’ minds
brand among U.S. consumers (81%) even though for the long term.
Overview of brand awareness in online food & grocery industry
81%
73%
62%
60%
52%
50%
38%
13%
12%
2%
Age and regional differences
Looking at different subgroups and cohorts within Even if the effect is not strong, brand aware-
the sample, some differences in terms of brand ness is influenced by age. This influence is even
awareness are notable. 16-24 year olds for in- more subtle by region. Postmates has the great-
stance are 9% more likely than the average to est variation, ranging from 45% awareness in the
know Postmates, and the age group 25-34 is 7% northeast to 59% in the west. Overall, however,
more likely to recognize Gopuff. In contrast, the the brand awareness scores are very stable and
oldest participants aged 55-65 have recognized not significantly influenced by the frequency with
Grubhub at 7% above average. which respondents order groceries online.
14Where Americans buy groceries online
Big box retailers way ahead of discounters and 3rd party platforms
To understand the buying behavior of American for third-party platforms, the use rate increases
online shoppers, we not only looked at specific proportionally with the population density. While
brands, but also the popularity of different types only 18% of people in rural areas shop online on
of suppliers (question 12). The result: When order- third-party platforms, twice as many (36%) do so
ing groceries online, more than three out of four in urban cores. This effect is also visible in the case
people (77%) generally buy at big box retailers like of high-end grocery stores, where usage ranges
Costco, Walmart, or Kroger. Retailers dominating from 11% in rural regions to 35% in urban cores
the offline grocery market are therefore also major (average 23%). It’s possible that lower availabili-
players when it comes to online food and grocery ty in rural areas is one of the reasons why usage
shopping. A distant second and third place in use there is below average. However, this does not
rates are discount grocers (like Food4Less, Aldi, or necessarily mean that consumers are not interest-
Grocery Outlet) at 31%, and 3rd party platforms ed in the respective players. Above-average us-
(e.g., Instacart, Postmates, Gopuff) at 27%. age with better availability is an indication that the
more rural regions offer great potential for growth,
At least for some players, however, this is subject provided that the offerings can be implemented
to influence by the region of residence. Especially profitably even in sparsely populated areas.
When purchasing food/groceries online from which of the following players do you buy from?
Avg 77%
80%
60%
rural
Avg 23% Avg 31% Avg 27% Avg 8%
40%
smaller
metropolitan
20%
larger
suburban
urban core
Big box retailers: High-end Discount grocers: 3rd party plat- International food
Costco, Walmart, grocers: Whole- Food4Less, Aldi, forms: Instacart, marketplaces:
Kroger foods, Erewhon Grocery Outlet Postmates, Gopuff JONS, Super King,
Vallarta 15Diverse offerings are valued
In the next question, we wanted to know from
the participants which platform types or offering
models they prefer (question 13). Instead of the
specific player categories, the focus here was on
different e-grocery variations. It is immediately ap-
parent that, although pickup or delivery from tra-
ditional retailers leads the field at 50%, this figure
is significantly lower than the percentage of con-
sumers who shop at these same retailers (77%)
that we saw in the previous question. Despite the
continued dominance of traditional retailers, many
consumers seem to prefer other platforms and
e-grocery models when considering online gro-
cery shopping.
Third-party platform offers on the other hand get
relatively high approval of 32% here, and Ama-
zon Fresh also lands at 31%. In addition, there is a
whole range of niche offerings, all of which are not
used extensively but have a notable number of
supporters. Meal kit delivery leads this pack with
14% usage, and local farm deliveries are also used
by 12% of American online shoppers. So-called
ugly produce deliveries still come in at 7%.
Implications for practitioners
It is difficult to draw clear conclusions from the picture of broad distribution across many service models.
However, in combination with the declining popularity of traditional retailers and their pickup and delivery
services, it seems advisable to look beyond one’s own business model.
For example, a marketplace could be an innovative way for grocers to maintain their market share by part-
nering with more niche types of retailers as merchants on a larger marketplace platform. The big players
offer reach and customer access, while the different merchants expand the range of products and the
target group, so that ultimately both sides benefit.
A marketplace is only one of many possible ideas. But given the broad spectrum of customer preferences
today already, it will become increasingly difficult, especially for traditional grocers, to achieve customer
centricity as the online grocery market continues to diversify.
16The vast majority switch between providers
As a final question on the topic of where Ameri- On the extreme, a good fifth (18%) of people or-
can online shoppers buy, we wanted to know how dering groceries online are currently juggling three
many providers and services consumers use on or more apps at the same time. For people living in
average (question 15). Four in ten Americans have urban cores, this figure is as high as 27%. Whether
only one favored service that they use exclusive- one buys mainly online or offline does not impact
ly. Conversely, this means that six in ten are not that figure significantly, though. It remains unclear
tied to one offering, and are customers at several whether online shoppers want the variety of opti-
providers. This can be taken as a sign of market ons or feel compelled to use multiple services, as
volatility or willingness to try other services, and no single solution offers the full range of desired
is reflective of how people buy groceries offline options. The very competitive offer landscape li-
as well. kely plays a role, too, as many providers use pro-
motions or special deals to attract new customers,
while existing users might install several apps and
use whichever one has the best offer at the time.
How many platforms/services do you usually use to order food/groceries online?
39%
use 1 solution
45%
61% use 2 solutions
use 2 or more 4%
use 4 or more
13%
use 3 solutions
17How Americans buy groceries online
Single orders dominate, but subscriptions on the rise
In addition to the question of where users mostly the most widespread ordering option. The remai-
do their online grocery shopping, it’s also interes- ning third, on the other hand, uses subscriptions.
ting to know how they make their purchases in 16% of respondents obtain all their online gro-
this channel. In that regard, one online-specific ceries from subscriptions and memberships, and
point that also has to do with brand loyalty is the 17% use both subscriptions and individual orders.
decision between individual orders or a subscripti- Among people who buy all their groceries online,
on model. We asked the study participants whet- the share of subscription customers is as high as
her they prefer one of the two or use a combina- 48% (21% subscription-only), which shows that
tion of both (question 16). subscriptions are especially attractive for heavy
users. In the 55 to 65 age group, on the other
The results show that single orders are used by hand, the proportion of individual orders is even
two-thirds (67%) of respondents, making them more pronounced at 73%.
Online grocery shoppers’ preferences for ordering models
80%
67%
60%
40%
16% 17%
20%
One-time/ Suscriptions/ I do both
single orders membership
service
Implications for practitioners
Ultimately, the question is: Is one-third coverage for subscriptions, or 17% for subscription-only use, a big
or small market share? Due to the predictability of cash flows and longer customer retention, subscrip-
tions are a very attractive business model - one that has not yet played a significant role in offline grocery
retailing. If users of online grocery offers are open to this model, this is therefore strategically extremely
valuable for the providers, even when it is only a minority of consumers using them so far. After all, this
could still change if the market continues to consolidate or the corresponding options are advertised even
more actively; it does not seem far-fetched, for example, that the proportion of heavy users and, with it,
the proportion of subscription supporters will continue to rise. Subscriptions have great potential in online
offerings and are therefore a strong business argument for e-grocery models.
18Small bills the exception rather than the norm
In the chapter on use cases, we already dispelled find themselves in the range of $100-200 week-
the myth that online grocery shopping is main- ly, and 7% are at the top polled edge with week-
ly used for impulse purchases or missing single ly e-grocery spending over $200. It is particularly
items. However, for online business to work, con- noteworthy that this distribution can only be ex-
sumers in these channels need to spend enough plained to a limited extent by consumers’ prefe-
money to cover the last mile and picking costs. rence for online or offline channels.
We therefore asked online consumers how much
they typically spend when buying groceries online Yes, the proportion of $200+ shoppers among
(question 25). online-only advocates is logically particularly high
(18%). But even among those who say they pri-
Remarkably, only 6% of online shoppers spend marily shop in-store, 30% spend more than $100
small amounts (under $20) in an average week. and 5% spend more than $200 per week on on-
The most frequently cited response, at 36%, is a line groceries. This proves how huge the market
$50-100 weekly spend on online groceries. More is already. This clearly illustrates that people don’t
than every third American online shopper even just use online channels to “fill the gaps” or order
says they spend more than $100 per week. 27% something they forgot to buy in store.
On average, how much do you typically spend on online groceries per week?
40%
36 36 35
31
30%
25
22
21
20% 18
partly online
13 12 12
10% 8 mostly online
7 4 4 5 6 5
exclusively
online
less than $20-50 $50-100 $100-200 $200+ I am not sure
$20
19Delivery over BOPIS,
speed over scheduling
We also asked study participants if they prefer
to pick up their ordered groceries themselves
(BOPIS), or would rather have them delivered
(question 21). Overall, almost four out of ten
(39%) online shoppers prefer to pick up their
groceries themselves. In rural areas, this figure
is even at 47%, which might correlate with
fewer delivery options being available. Out of
the 61% that prefer delivery, 19% like to sched-
ule the delivery dates, while the largest group
of 42% online buyers wants their groceries de-
livered as fast as possible. Quick delivery being
the preferred option by the majority of online
grocery shoppers shows once again that fast
availability and convenience are key for users.
These preferences have an influence on the
choice of provider. Those who prefer immedi-
ate delivery are 42% likely to order from 3rd
party platforms, which is 9% above average.
However, the choice of the last mile option has
no influence at all on the frequency of orders.
As already mentioned previously, proponents
of both options order groceries almost exactly
the same number of times. 52% (delivery) and
53% (BOPIS) order at least once a week, 12%
and 13% respectively order two or more times
per week.
20Technical user needs and expectations for online grocery solutions
Hygiene factor outstanding UX
Now that the basic issues surrounding online gro- pack and is also partly reflected, for example, in
cery have been clarified, we wanted to under- good and transparent order processing (order
stand in more detail what makes a good online tracking/convenient delivery time/delivery-slot
solution for users, or what technological details notification), which 67% find important or very
and features are considered particularly import- important; and 86% of people who shop exclu-
ant (question 19). If we look at the characteristics sively only. Interestingly, the youngest study par-
that are important or very important to users, we ticipants (age 16-24), are below average for all
see a whole series of criteria that get over 60% criteria, except for reviews and product infor-
agreement. Users are therefore demanding and mation (52% agreement). Ease of use has 59%
have many expectations of online services. agreement in this age group, making UX overall
the leading requirement for them as well, but at a
At the top of the list of qualities demanded by us- more restrained level. Young users therefore seem
ers is an easy-to-use platform and user-friendly to be less demanding.
shopping experience, at 70%. UX thus leads the
When ordering groceries/food online, how important is it that
the online providers/their platforms offer you the following?
Not important Important
or not important at all or very important
Order tracking/convenient delivery time
6% /delivery-slot notification 67%
Expanded assortment
5% 67%
and product freshness
5% Easy to use platform and user-friendly 70%
shopping experience
16% Personalized promotions 42%
5% Fast and responsive customer service 67%
6% Transparent pricing/price-matching 68%
10% Reviews and product information 51%
9% Low per-order fees and attractive 60%
subscription models
12% Organized shopping lists 51%
6% Free delivery options 69%
21The second category, which is reflected in sev- make it any less critical for suppliers to be aware
eral top responses, is price. Free delivery options of these expectations. But the main takeaway for
and transparent pricing are considered important online providers must be: Create a great digital
or very important by 69% and 68% respectively. experience. Consumers expect more than run-of-
In addition, fast and responsive customer service the-mill platforms and clunky apps, and how you
is also demanded by 67%. The fact that price and sell is at least as influential as what you sell in this
service play an indispensable role is hardly sur- channel.
prising in a retail study. However, this does not
Desktop for Boomers, mobile for everyone else
An evergreen of online channel analysis is the de- exclusive, desktop also gets a decent use rate of
vice that is primarily used. The question of which 34%. Especially among Baby Boomers (age group
device the participants use for their online pur- 55-65), the use of desktop for online grocery
chases (question 26) could therefore not be miss- shopping is as high as 42%. In contrast, voice
ing in our study. It is obvious at first glance that assistants such as Siri, Alexa and the like form a
mobile is the dominating way for users to order clear niche. On average, they are used by only 5%
groceries online. Almost eight in ten (78%) on- of respondents. The outlier here is the youngest
line grocery buyers opt for their mobile devices. respondents, aged 16-24, with a use rate of 8%.
However, as the choice of devices is not mutually
Which of the following devices are you using to buy groceries online?
78%
80%
60%
40%
34%
20%
5%
Mobile app Desktop Voice assistant
Implications for practitioners
Mobile is dominating most B2C e-commerce already, so it is hardly surprising that for online groceries, too,
there is no way around a mobile-optimized user journey. However, it must also be noted that desktop is
far from dead, and voice cannot be underestimated. Different target groups have varying preferences, and
even if the age distribution suggests that mobile and even more innovative channels like voice will gain in
importance in the future, no channel should be neglected. A sophisticated multichannel or omnichannel
approach is the ideal strategy to strive for.
22Yes to coupons, but not on social media
Coupons and promotions have increasingly migra- The only outlier in the digital reception options is
ted to online transmission, even for offline retail, in social media. Only 11% of participants like to recei-
recent years. We wanted to know if this is an ad- ve coupons and promotions there. However, a look
vantage or disadvantage for online groceries, and at the details shows that this is clearly influenced
asked users which way they would like to receive by age. The younger the respondents, the more
coupons and promotions for food and groceries popular coupons are via social media, up to 18%
(question 27). And the winner is: email. Almost half among 16-24 year-olds. The most striking finding
of the respondents (45%) like to receive coupons is that Americans really value coupons and pro-
in the digital classic, their email inbox. motions, with a full 90% stating that they enjoy
receiving these money-saving deals. And when
Two out of three respondents prefer digital cou- it comes to how, digital channels dominate, led
pons to printed ones. Mobile apps are also a po- by the flagship email.
pular channel in this category, with 40% approval.
How do you like to receive coupons and promotions for food and groceries?
50%
45%
40% 40%
33%
30%
23%
20%
11% 10%
10%
Mobile app Email Text message Social media Printed ads I don’t like
mailed to me receiving coupons
and promotions
16-24 years old
20% 18
16
25-34 years old
10 35-44 years old
10% 8
4
45-54 years old
55-65 years old
Social media
23Opportunities in ready-made food for online grocers
Grocers on par with restaurants
Definition of ready-made food
Following on from online food as a whole, let’s
now zoom in on a category that is gaining in im- Ready-made food means complete meals in
portance, with little existing market research data: one package, already cooked, and displayed in
ready-made food. chilled cabinets, such as lasagnas, deli meats,
salads, or sandwiches. They are different from
To get a first impression of the current relevance convenience food like canned food, which are
of ready-made food from grocers, we asked study not necessarily already cooked but can be
participants to rank which categories of food they prepared quickly. Takeaway meals on the ot-
spend the most money on (question 29). While her hand are bought hot, perhaps delivered to
groceries take the largest share of average week- the door, and consumed immediately. And fast
ly food spending for a vast majority of all parti- food is bought on the premises of the vendor,
cipants, ready-made food from grocers is almost and usually consumed there. So, ready-made
on par with dine-in restaurants and take-out or food serves the niche between the conve-
delivery from restaurants. About half of all partici- nience of a restaurant, not having to cook, and
pants ranked these options as one of their three the prices and predictability of grocery shop-
biggest cost items for food. This shows how po- ping. Convenience is the keyword, and this ca-
pular ready-made food is already, and that people tegory seems to be tailor-made for e-grocery.
are willing to pay for it.
Implications for practitioners
These results are particularly interesting for grocery retailers and brands for two reasons. First, ready-
made food offers higher margins than most traditional items in a grocery store. And second, ready-made
food can add additional revenue by capturing what may have been previously spent in restaurants. In com-
bination with the increasing convenience of online grocery shopping, ready-made food is a very promising
vertical for grocers.
24Broad distribution and heavy users
The second question on ready-made food revol- This figure is particularly high for men (43%),
ved around frequency of use. Regardless of the 25-34 year olds (45%), and those who value on-
decision whether it was for pick-up or delivery, line groceries primarily for prizes and promotions
we asked how frequently consumers purchase (56%). Of those consumers who purchase their
ready-made food from a grocery store (question food exclusively online, on the other hand, just
30). This revealed a very broad and fairly balan- 26% include ready-made food as part of their
ced distribution for each option. All opinions are weekly purchases, and 34% of them buy less fre-
represented, from very heavy users with two or quently than once a month or never. Although
more orders per week (13%) to never (9%). Ove- ready-made food from grocery stores already has
rall, nearly four out of ten Americans (39%) or- a high market penetration and seems to serve a
der ready-made food from a grocery store at least similar target group as e-groceries, it has so far
once per week. This is compared to 33% who or- primarily played a role in offline sales.
der take-out or delivery at restaurants in the same
time span.
How frequently do you purchase ready-made food from a grocery store?
Average
40%
38% at least weekly
35%
30%
25%
25%
20% 15% 15%
15% 13% 11% 11%
9%
10%
5%
2+/week 1/weekConvenience, price, and specialities
We also asked participants about their reasons clearly demonstrate the potential of ready-made
for buying ready-made food from a grocery store food as a lucrative segment for grocers. Another
(question 31). And, how likely are they to prefer 16% of survey participants report buying ready-
purchasing ready-made food compared to meal made food from grocery stores primarily because
delivery or take-out from a restaurant (question they like their specialties. This could be a further
32). More than half, 56% of shoppers cite conve- opportunity for grocery retailers to diversify or in-
nience and saving time as the leading reasons for crease ready-made offerings to attract even more
buying ready-made food. While 17% do it to save buyers. The greatest potential, however, seems to
money. lie in the integration of ready-made food into the
grocers’ online segment. This has a large overlap
More than half of the respondents prefer ready- in target group and use cases and seems to have
made food to a restaurant (54%). These numbers been leveraged comparatively little so far.
26Part 2:
The future of online grocery in the US
Grocery shopping in two years
E-grocery growth continues
In order to be able to make a forecast for the fu- some of their groceries online in two years, while
ture, we asked all participants how they imagined 22% plan to purchase most or all of their groceries
their grocery shopping in two years time (ques- through online channels. An expected 21% increa-
tion 34). Here’s what the answers revealed. The se within two years, compared to the status quo
growth of e-grocery is far from over. Nearly six (question 8). An additional 10% of Americans will
in ten Americans (57%) expect to order at least likely start using online grocery offerings.
27Younger age groups, such as 25-34 year-olds, of offline buyers, at 43%. Otherwise, online is
report even higher values. Of them, 66% expect growing in all areas and cohorts. And the exact
to buy groceries online at least occasionally and numbers could be even higher, as a full 10% of
25% even mostly or exclusively. Only the oldest respondents did not provide an estimate, not
respondents (55-65 year olds) still stand out in being sure how to make a prediction given the
the future forecast with an above-average share rapid pace of change in the industry.
How do you envision your food shopping in the next 2 years?
10% 4%
I am not sure given exclusively online
the pace of change
18%
mostly online,
34% 57% sometimes in-store
exclusively in-store online at least
sometimes
35%
mostly in-store,
sometimes online
Implications for practitioners
Like all other e-commerce models, online grocery has benefited from the COVID-19 pandemic as a catalyst
for digitization. However, this has always been accompanied by whether sales would migrate back to the
brick-and-mortar store, at least in part. These results now show that this is by no means to be assumed.
Rather, COVID‘s influence lies in the fact that online grocery providers found it particularly easy to get
started. Customer acquisition costs for online grocers were extremely low, and demand was skyrocketing.
Even if the strong demand slows down somewhat after the pandemic, providers could ramp up their on-
line marketing again to counteract; especially since everyone now knows about the existence of these
offers.
Overall, the timing for market entry and rapid scaling remains optimistic. The density of supply is still rela-
tively low, not only in rural areas, and there are many indications that once customers have been acquired,
they will continue to use online channels.
28Motivators and blockers
No digital equivalent to seeing and feeling products
In addition to the general intention to use more
or less e-grocery offers in the future, the partici-
pants were asked about obstacles they see to or-
dering food online (question 20). There is no clear
consensus, and no single obstacle is rated as
relevant by more than half of the respondents.
The most frequently cited answer is that they
cannot see and touch items before purchasing
them (47%). This uncomfortable feeling is univer-
sal, even people who exclusively order food online
still have it. E-grocery operators will need to come
up with solutions to establish trust in freshness
and quality, otherwise this will remain a clear
advantage of offline stores.
What do you see as the biggest obstacles to shopping for groceries online?
50% 47%
40%
40%
31%
30% 26%
20%
12%
8% 7%
10%
not being delivery I enjoy unwanted inconvenient poorly perso- none, I don’t
able to hand- costs are in-store product user nalized online see any
pick products too high shopping substitutions/ experience experience obstacles
suggestions
The second most frequently cited answer, delivery in all age groups. A third main obstacle, unwant-
charges that are too high, is the most common ed products, is primarily criticized by those that
answer among those under 40, at 41%. This shows order online a lot (8% above average). They also
two other possible blockers: extra costs and age. complain about poor personalization above
It was already revealed in many questions that average (13% vs. 8% average). So this last ob-
young target groups are especially open-minded stacle can be summarized as high expectations
towards online groceries and price concerns are towards a seamless digital user experience and
not widespread overall (see chapter “Bargain execution, which becomes especially important
hunters are at odds”, question 24), but do occur as usage increases.
29Convenience and a sense of control
Convenience is by far the biggest motivator for products more easily (27%). The more compre-
online grocery shopping. When asked directly hensive product information and reviews also
about the main reasons behind shopping for appeal to 22% of online shoppers. All of these
groceries online (question 18), 59% cited con- arguments have in common the sense of control
venience, while 35% of respondents were still consumers feel when shopping online. Online is
concerned with personal safety. a more controlled environment than the brick-
and-mortar store, making shopping less stressful.
Other frequently stated reasons for online gro- Consumers like being able to choose exactly the
ceries include the avoidance of impulse purchases products they really want and need with less pres-
(29%) and the possibility to compare prices and sure and in familiar surroundings.
30Fans and opponents
Users become fans
If you’re looking for consumers who are particu- reduce their online shopping, the proportion of
larly positive about online grocery shopping, the those who plan to switch completely to online is
first group that can be found is: those who try as high as 18%, four and a half times higher than
it. Of those who already order at least most of the average (4%). Online offers therefore seem to
their groceries online today, only 2% believe they convince many consumers and lead to increased
will stop doing so in the next two years. And whi- customer retention over time.
le few online-consumers have the intention to
Expected use of grocery shopping channels in 2 years by current shopping preferences
60% 57%
50%
40% 35%
34%
30% average
18% 18%
20% 14%
10% people who
10% 9% order at least
4%
2% most of their
groceries
exclusively mostly in-store, mostly exclusively things are online today
in-store sometimes online online, online evolving so quickly,
sometimes I am not sure how
in-store to answer
31Ideal customer profile:
tech-savvy women from the south
One factor that rarely reaches statistical signifi-
cance but shows up as a trend in many questions
is gender. Overall, women seem to be more open
to online food than men. The percentage of men
who shop exclusively offline is 2% higher (54%
vs. 52%), while the percentage of heavy online
users (buying mostly or exclusively online) is 3%
higher for women (14% vs. 11%). Similarly, in the
future forecast, the use rate is slightly higher for
women, and they are almost twice as likely to not
see a single reason not to shop online for grocer-
ies (8% vs. 5%).
An additional observation is that most online
grocery fans in the U.S. come from the south.
The south has the lowest percentage of offline
advocates at 48% and the highest percentage of
heavy online users at 15%. Also, compared to all
other regions, by far the largest share of people
do all of their weekly shopping online in southern
states (32% vs. 26% average). Moreover, south-
erners on average spend the most money online,
with 37% spending more than $100 weekly (vs.
34% average).
Furthermore, technology affinity plays a reinforc-
ing role for online adaptation. For example, only
32% of those who prefer to receive coupons
digitally rather than printed make their grocery
purchases exclusively offline, which is almost half
the population average (52%). So those who like
to use modern technology also like to use e-gro-
cery options. And the particularly good news for
e-grocery providers is that it appears that these
tech-savvy customers also order in large quanti-
ties. For example, 15% of those who use voice or
other innovative technologies for ordering spend
more than $200 a week on online groceries, which
is twice as high as the average (7%).
32Price sensitivity and offline advocates
Higher age and residence in rural regions are fac- Then there is another group that is very obvious
tors whose inhibiting influence on online adaptati- but particularly difficult to convert: people who
on has already been demonstrated. In addition, we enjoy in-store shopping. They already order on-
tried to find groups that reject online after they line less often (70% exclusively online, vs. 53%
have tried it. The strongest influencing factor in average), and when they do, they pay less (30%
this respect appears to be price sensitivity. Those under $50 per week, vs. 25% average), and nearly
who say they generally pay more online than offline half of them still plan to buy exclusively online in
are 9% more likely to return to in-store shopping two years (47%, vs. 34% average). So it remains
altogether in two years time. This is more than to be said that online grocery shopping is not for
double the average figure for all online shoppers everyone. However, there are few who don't try it,
(4%). Among those who currently shop online and it is hard to find any reliable trends of groups
mainly at discounters, this figure is as high as 12%, that have a conspicuously negative attitude to-
three times the average. The perception that on- wards online offerings.
line is more expensive is not shared by a majority,
but those who hold this opinion are significantly
more likely to be opponents of e-grocery.
Proportion of online shoppers who plan to switch completely to offline purchases
in two years’ time
2% 4% 9% 12%
heavy online average people who believe people who do online
users online shopper online grocery is grocery shopping
more expensive than mainly at discounters
offline
33Conclusion
It is very clear that the study results show a complex market with multifaceted customer requirements that
is undergoing change. In the following, we have summarized the most striking findings and takeaways for
business practitioners based on the questions we raised in the introduction.
Offline vs. online: e-grocery use cases, target groups, and trends
Nearly half (47%) of Americans already purchase $100 per week on online grocery shopping. Online
groceries online at least sometimes, while 15% grocery shopping has long since become part of
shop mostly or exclusively online. And yet, the consumers’ everyday lives.
growth potential of e-grocery is still huge, with an
expected 21% increase within two years. Online E-grocery providers are currently making gains,
grocery is here to stay as a significant part of the especially among younger and tech-savvy audi-
new normal in the U.S. food and grocery retail ences, women more than men, and in southern
industry. states. Apart from true offline fans, however,
almost no one is unwilling to try it out, and for
Online offers are valued above all for their con- large proportions of users, ordering frequency
venience and reduced health risk. So the impact increases over time. Stationary providers without
of COVID-19 is still ongoing, but there are no digital solutions should act quickly to avoid missing
signs that there will be a jump back to the con- out on more than just the phase of lowest
sumer behavior of 2019 even after the end of the customer acquisition cost. No offering today means
pandemic. More than one in four (27%) online no prospects for tomorrow due to missing learn-
shoppers purchase all their weekly groceries ing curves and a growing need to catch up with
online, and one in three (34%) spend more than the competition.
34Competition: brand perception, customer retention, and platform preferences
With the pandemic as a catalyst, there has been companies are paying for their customer acqui-
a strong influx of new players, retail models and sition with frequent and heavy discounts. Not
financing in online grocery in recent years. For all providers can win this battle, especially since
consumers, this seems to have left a very clut- online customers are price-sensitive and demand
tered market. No brand stands out in terms of price transparency (68%), or criticize delivery
recognition, and average awareness levels are so costs (40%).
low that the race for market leadership does not
yet seem to have been decided. But competition is not just between online provid-
ers. For every $1 billion in growth in 2022, around
So far, there are enough users for a variety of of- $3 million, or the sales of a mid-sized grocer, will
ferings, especially since nearly two-thirds (61%) of shift to online retail every day. This shift will not
customers use two or more services in parallel. But work without cannibalization effects and is likely
the market is still likely to consolidate. A growing to affect stationary grocery retail in urban areas in
number of users are committing to one provider particular, where online offerings are in particularly
with subscription models (33%), and many new high demand and can be implemented efficiently.
35Customer experience: technology, features, ordering and delivery models
It is not what is sold, but how it is sold that mat- experience” and “ease of use” are the decisive
ters, and that is why technological solutions play a factors for seven out of ten U.S. consumers when
crucial role in this market. 78% of users purchase choosing an online grocery provider, underlining
online groceries on mobile devices, while 8% of the importance of an intuitive UX.
those under 25 use voice assistants. 67% expect
order tracking as well as fast and responsive cus- Grocery retailers who choose to invest in tech-
tomer service. Customer expectations are high nology can get ahead of the curve in customer
and diverse, and grocers need to be able to meet retention and satisfaction. A sophisticated mul-
them with excellent solutions, regardless of how tichannel or omnichannel approach is the ideal
consumers are shopping. strategy to strive for to optimize the customer
journey. This requires modern, agile e-commerce
Offering a seamless experience beyond the brick technologies to find exactly the customer-centric
and mortar stores is the key for grocery retailers to solutions that consumers are currently demanding
win the hearts of those who view grocery shop- and to adapt flexibly once the market changes.
ping as a chore (45% of respondents). “Shopping
36About Appinio
Appinio is the global market research platform which enables companies to source thousands of opinions
from specific target audiences worldwide - in just a few minutes. For the first time, everyone can validate
decisions and ideas in real-time with representative results from consumers. As the fastest solution for
market research, Appinio delivers feedback from 90+ markets to more than 1000 companies from all
industries. Customers include VW, Unilever, Netflix, Gorillas, Jägermeister, and Red Bull.
About Spryker
Spryker enables companies to build sophisticated transactional business models in unified commerce
including B2B, B2C, D2C, and Enterprise Marketplaces - out of one stack. Spryker customers extend their
sales reach and grow revenue with a system that allows them to increase operational efficiency, lower the
total cost of ownership, and expand to new markets and business models faster than ever before.
Gartner® recognized Spryker as a Visionary in the 2021 Magic Quadrant for Digital Commerce, and our
solutions have empowered 150+ companies to manage transactions in more than 200 countries worldwide.
Customers include Aldi, Toyota, Siemens, Ricoh, and Hilti.
About the authors
Tim Thedens Ines Moumene
E-Commerce Content Specialist Research Consultant
Mail: tim.thedens@spryker.com Mail: ines.moumene@appinio.com
Spryker Systems America Inc. APPINIO GmH © Copyright 2021
80 Pine Street, Floor 24 Große Theaterstraße 31
All contents, in particular texts, photographs and
New York, NY 10005 / U.S. 20354 Hamburg / Germany
graphics are protected by copyright. All rights,
T +49 / 30 / 208 49 83 50 T +49 / 40 / 413 49 710 including reproduction, publication, editing and
M hello@spryker.com M contact@appinio.com translation, are reserved, Spryker Systems GmbH,
W spryker.com W appinio.com Heidestraße 9-10, 10557 Berlin, Germany.
37 37You can also read