A Generational Voting Model for Forecasting the 2020 American Presidential Election
←
→
Page content transcription
If your browser does not render page correctly, please read the page content below
A Generational Voting Model for Forecasting the 2020 American
                      Presidential Election

                   Jonathan Auerbach∗                   Yair Ghitza†        Andrew Gelman‡

                                                       8/03/2020

                                                        Abstract
          We predict how the political events that occurred during the Trump administration will factor into
      the 2020 American Presidential Election. We begin by motivating the advantage of a generational voting
      model, in which voters’ partisan preferences are modeled as a running tally of impressions left by the
      political events they live through. We then state the model explicitly. Finally, we predict how different
      generations will respond to the political events that occurred during the Trump presidency. Our results
      raise new questions about the comparability of generations in an era of extreme political polarization.

Introduction

The outcome of the 2020 American presidential election will depend on how voters assess the political events
that occurred during the Trump administration—from the aftermath of the 2016 election, Mueller Report,
and impeachment hearings to the coronavirus pandemic, recession, and widespread protests. Although
unprecedented in several respects, it is because history repeats that past elections provide a scientific basis
for predicting how voters will assess these events. The challenge is determining the manner in which history
repeats, and thus the exact relevance of past elections, which may only be clear long after the 2020 election.
We predict how voters will assess the political events of the Trump administration using using the generational
voting approach of Ghitza, Gelman, and Auerbach (2020) (see paper for details). The model builds on
political socialization theory, which describes how political events influence voting behavior (for example,
see Hyman (1959), Campbell et al. (1960), and Jennings and Markus (1981)). Generally speaking, the
value of this or any theory is that, if the underlying assumptions are reasonable, the problem of predicting a
complex phenomenon such as voting behavior is reduced to a manageable number of unknown factors. The
advantage of political socialization theory specifically is that the assumptions are supported by decades of
research, transparent, and easily discussed among experts or communicated to a lay audience. We believe this
advantage is particularly desirable given the unusual circumstances in which the 2020 election will take place.
We proceed in three sections. We first motivate the main assumption underlying our generational voting
model, which permits the comparison of voters across generations. We then describe the data and model (for
related literature, see for example Burnham (1970), Beck and Jennings (1979), and Beck (1991)). Finally, we
forecast how voters will assess the political events that occurred during the Trump presidency. Our main
finding is that Generation Z has become more Democratic over the course of the Trump administration, but
appear to lean only slightly Democratic overall when compared to previous generations—raising questions
about the comparability of generations in our era of extreme political polarization.
  ∗ Department  of Statistics, Columbia University
  † ChiefScientist, Catalist
  ‡ Departments of Statistics and Political Science, Columbia University

                                                             1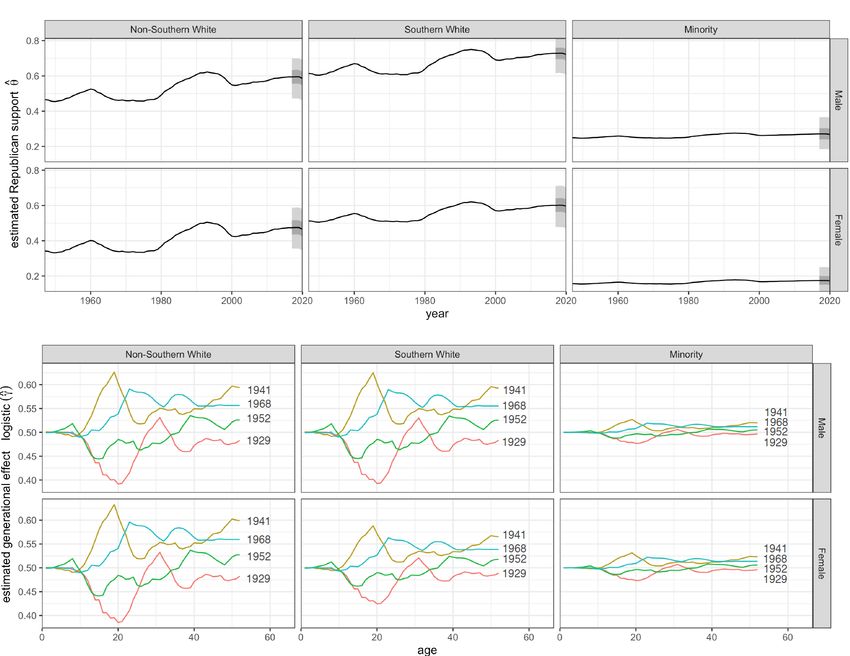
1. We use the Gallup Organization’s presidential approval rating time series to
compare voters across generations.

Political socialization theory provides a broad framework for understanding how voters assess political events.
To summarize, political events make impressions on voters, and the cumulative weight of those impressions
determines which candidate a voter prefers. While every impression is unique, they typically coincide with a
voter’s demographic characteristics—such as age, race, ethnicity, and sex—reflecting the common conditions
under which voters experience political events.
Forecasting an election with political socialization theory requires modeling how voters form their impressions.
The model is then extrapolated to predict the impressions left by new political events. The problem is that
both the political events and the manner in which voters assess them change over time, and the two must
be disentangled before prediction is possible. For example, that older voters prefer conservative candidates
could reflect the fact that voters become more conservative with age or the fact that the current generation
of older voters acquired conservative-leaning ideologies from political events unique to their adolescence. In
the first case, we would expect future voters to become more conservative with age, while in the second case,
we would expect future voters to retain their childhood ideologies, all else equal.
The natural solution is to compare voters from different generations when they were the same age and of
arguably similar impressionability. Continuing the previous example, we could calculate the proportion of
the older generation’s conservative leanings that are due to adolescence by comparing the childhood of this
generation to the childhoods of other generations. Such comparisons fill our public discourse, from the specific
advice beginning “if I were your age . . . ” to the general nostalgia of a previous generation. However, there
are any number of ways to compare two childhoods, and few articulate what exactly they mean if they were
another’s age. (Strictly speaking, if you were another’s age, you would share their experiences and thus
behave like them, although that is rarely what anyone means.) Even seasoned researchers speak casually
about the effect of age without clarification.
The conceptual ambiguity inherent in intergenerational comparisons extends to all concomitant variables—
variables that cannot be manipulated experimentally and represent abstract experiences whose relevance is
subjective and case dependent, such as age, race, ethnicity, and sex. In order to fully realize the advantages
of political socialization theory, namely transparent and easily communicated predictions, we must be explicit
how different generations are compared. Our approach uses the Gallup Organization’s presidential approval
rating time series to represent political events and capture the changing zeitgeist; our main assumption is
that voters who live through similar ratings adopt similar political ideologies. The approval ratings thus
permit the comparison of voters across generations, not unlike how the consumer price index permits the
comparison of prices across generations or the human development index permits the comparison of standard
of living. The following section describes how exactly we make these comparisons, and the final section
questions whether approval ratings sufficiently capture our new era of political polarization.

2. We model partisan preferences as a running tally of impressions left by the
political events.

We assemble a dataset of responses to public opinion surveys about the American presidential election from
five sources: (1) the ANES (elections 1952-2016), (2) the Gallup presidential polling dataset from the Roper
Center’s iPoll database (1952-2016), (3) the Annenberg National Election Studies (2000, 2004, and 2008), (4)
the Greenberg Quinlan Rosner Research internal campaign polls (2012), and (5) the CNN/ORC and Pew
polls (2016). The dataset has 215,693 complete responses after discarding undecided voters.
Let a = {1, 2, . . . , 70} denote the age of the respondent, p = {1956, 1960, . . . , 2016} the year of the response,
g = {non-Southern white male, Southern white male, minority male, non-Southern white female, Southern
white female, and minority female} the demographic group of the respondent, and h = {Annenberg, Gallup,
NES, GQRR, CNN/ORC/Pew} the survey house that collected the response. We group all minority
respondents together by sex since the data does not distinguish consistently between minority groups in early
years; white refers to non-Hispanic white.

                                                         2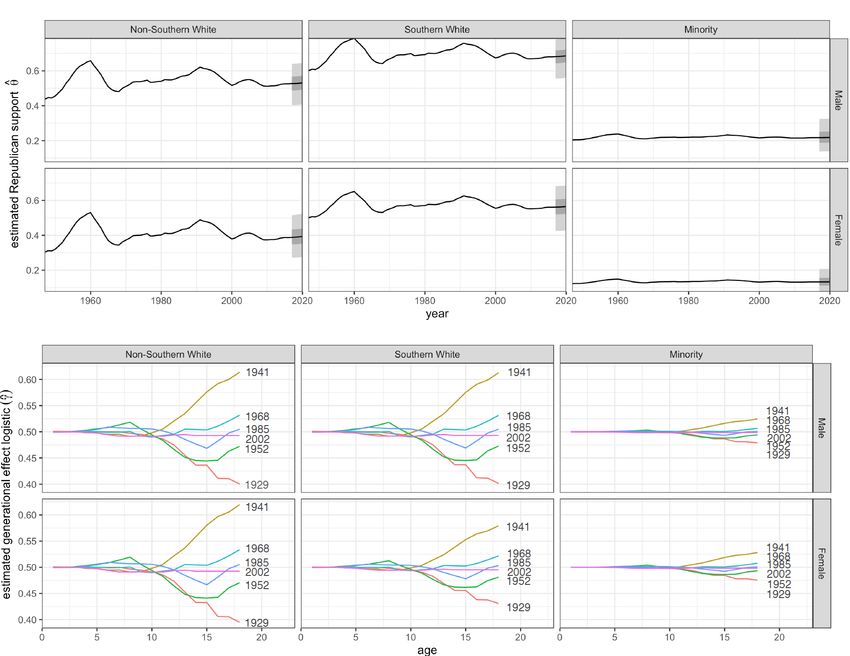
We also collect the Gallup Organization’s long-running presidential approval rating time series from August
1937 to June 2020. Let xt denote the Republican-directional presidential approval rating in year t, which
is calculated by (1) subtracting 50% from the Gallup presidential approval rating in the year t, and (2)
multiplying the difference by −1 if the sitting president was a Democrat.
The covariates, a, p, g and h, partition respondents into mutually exclusive cells. For each cell, j, we denote
the age, period, group, and source of the responses by a[j], p[j], g[j], and h[j]. Let yj denote the number
of respondents supporting the Republican candidate in cell j, and nj the number preferring either the
Republican or Democratic candidate. We model

                                             yj ∼ Binomial(nj , θj ),

where θj is the proportion supporting the Republican presidential candidate within cell j.
We decompose θj into four effects. We define a generational effect as the running tally of impressions left by
the political events experienced by the voters of cell j up until period p[j],
                                                       a[j]
                                                       X
                                          γj = Ωg[j]          wi xp[j]−a[j]+i
                                                       i=1

where wi denotes the age-specific weight of the rating at age i, and Ωg denotes the scale of the age-specific
weights for group g.
We define a period effect for each group, βpg , a period and age-weight interaction, λg wa βpg , and an election
effect,

                                       Bj = βp[j]g[j] + λg[j] wa[j] βp[j]g[j]

                                          = 1 + λg[j] wa[j] βp[j]g[j]

We also define an age effect αa and a house effect ηh . Put together, these effects sum to θj on the logit scale,

                                       logit(θj ) = αa[j] + Bj + γj + ηh[j]

We smooth the age weights,

                                          wi ∼ Normal (wi−1 , 0.01) ,

and specify normal distributions for α, β, and η with mean zero and standard deviations σα , σβ , and ση . The
scale parameters, λ and Ω, are constrained to be positive.

3. Our model suggests the political events of the Trump administration will have
smaller influence on average than the events experienced by previous generations
of the same age.

We fit our generational model with Stan (Carpenter et al. (2017)) using the R (R Core Team (2020)) package
cmdstanr (Gabry and Češnovar (2020)). We sample 4 chains for 2000 iterations each. In each iteration, we
generate θ̂j , the proportion supporting the Republican presidential candidate, for all groups, ages 0 to 70, and
years 1937 to 2020. NOTE: We set βpg = β2016g and η = 0 so that the θ̂j are comparable across years—at this
time there is insufficient data to estimate β2020g . We ensure satisfactory diagnostic and posterior predictive
performance (Gelman et al. (2013)) before using sample quantiles for estimates (median) and credible
intervals in the following five figures. Darker intervals represent 50 percent posterior regions and lighter
intervals represent 95 percent regions.

                                                          3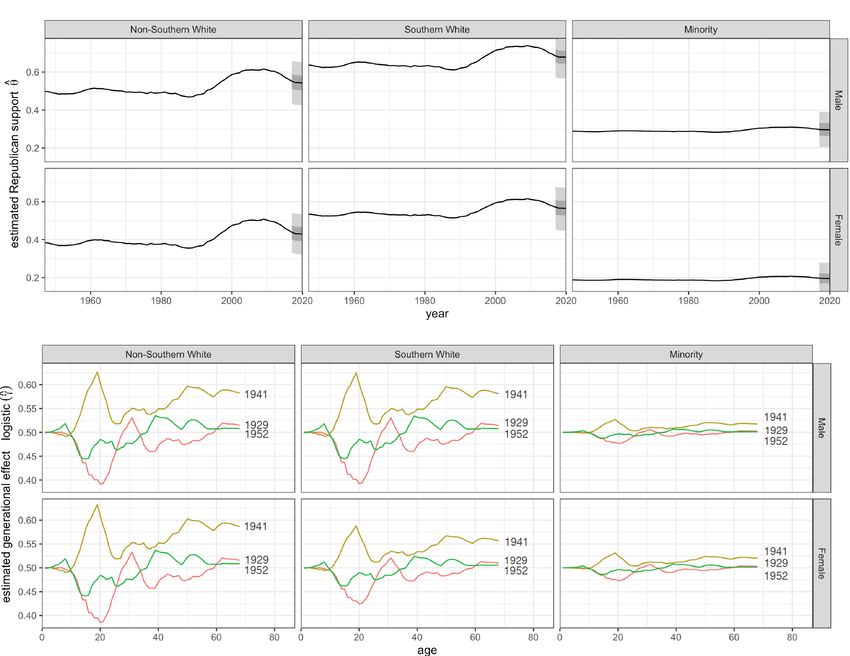
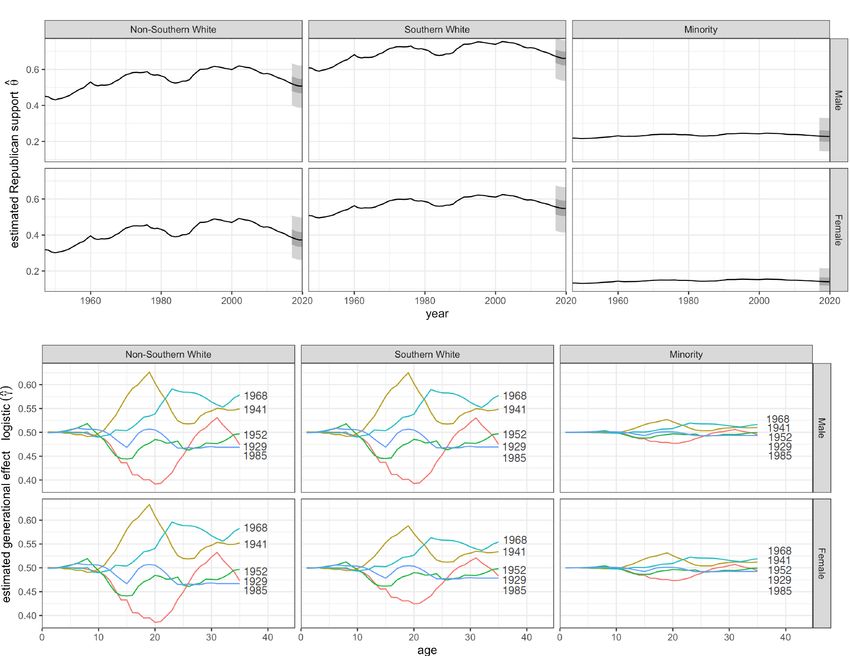
Figures 1-4 each examine four age groups of voters representing four different generations—18-year-olds
(Generation Z), 35-year-olds (Millennials), 52-year-olds (Generation X), and 68-year-olds (Baby Boomers).
The top half shows the estimated Republican support from that age group since 1950. Generation Z and
Millennials lean Democratic compared to previous voters of that age, while Generation X and Baby Boomers
lean Republican. The bottom half shows how the political events experienced by the different generations
(labeled by birth year for consistency across Figures) have shaped their political ideology. Each generation
is politically agnostic at age 0. They then develop unique trajectories of partisan preferences according
to the political events they live through—displayed up until the age of the current generation. Under our
model, younger generations have become more Democratic from the events experienced during the Trump
administration. For non-minority Generation Z and Millennials, the shift is smaller than past generations,
suggesting recent political events have had a smaller on average influence than the events experienced by
older generations at the same age. For older generations, such as Generation X and Baby Boomers, and
minorities of all generations, the change is consistent with previous generations.
We conclude by revisiting our main assumption: that approval ratings permit intergenerational comparisons.
If this assumption is reasonable, one explanation for our findings is that the Internet and 24-hour news cycle
have dampened the long-term influence of political events. If this assumption is not reasonable, as recent
polls appear to suggest, approval ratings may understate the extent to which younger generations support the
Democratic candidate. Future work should examine how these ratings might be adjusted to better facilitate
intergenerational comparisons. However, any adjustment would likely forgo the eighty-three year length of the
approval rating time series or overall interpretability of the model. Whether the benefit of adjustment exceeds
the cost will be clearer after the 2020 American presidential election, which is sure to test the assumptions of
every forecasting method.

                                                       4
Figure 1: Comparing 18-year-olds (currently Generation Z, birth year 2002, magenta): Estimated
Republican support from 18-year-olds since 1950 (top) and cumulative partisan impressions producing this
support from birth to age 18 for select birth years (bottom).
5Figure 2: Comparing 35-year-olds (currently Millennials, birth year 1985, blue): Estimated
Republican support from 35-year-olds since 1950 (top) and cumulative partisan impressions producing this
support from birth to age 35 for select birth years (bottom).
6Figure 3: Comparing 52-year-olds (currently Generation X, birth year 1968, teal): Estimated
Republican support from 52-year-olds since 1950 (top) and cumulative partisan impressions producing this
support from birth to age 52 for select birth years (bottom).
7Figure 4: Comparing 68-year-olds (currently Baby Boomers, birth year 1952, green): Estimated
Republican support from 68-year-olds (Baby Boomers) since 1950 (top) and cumulative partisan impressions
producing this support from birth to age 68 for select birth years (bottom).
8Figure 5: Relative vote share: Estimated Republican support by age, race, ethnicity, and sex. These
estimates can be post-stratified to predict the outcome of the 2020 election, which we plan on doing when
data becomes available.
9References
Beck, Nathaniel. 1991. “Comparing Dynamic Specifications: The Case of Presidential Approval.” Political
Analysis, 51–87.
Beck, Paul Allen, and M Kent Jennings. 1979. “Political Periods and Political Participation.” The American
Political Science Review, 737–50.
Burnham, Walter Dean. 1970. Critical Elections and the Mainsprings of American Politics. New York:
Norton.
Campbell, Angus, Philip E Converse, Warren E Miller, and Donald E Stokes. 1960. “The American Voter
New York: Wiley.”
Carpenter, Bob, Andrew Gelman, Matthew D Hoffman, Daniel Lee, Ben Goodrich, Michael Betancourt,
Marcus Brubaker, Jiqiang Guo, Peter Li, and Allen Riddell. 2017. “Stan: A Probabilistic Programming
Language.” Journal of Statistical Software 76 (1).
Gabry, Jonah, and Rok Češnovar. 2020. Cmdstanr: R Interface to ’Cmdstan’.
Gelman, Andrew, John B Carlin, Hal S Stern, David B Dunson, Aki Vehtari, and Donald B Rubin. 2013.
Bayesian Data Analysis. CRC press.
Ghitza, Yair, Andrew Gelman, and Jonathan Auerbach. 2020. “The Great Society, Reagan’s Revolution, and
Generations of Presidential Voting.” Under Review.
Hyman, Herbert. 1959. “Political Socialization.”
Jennings, M Kent, and Gregory B Markus. 1981. “Political Involvement in the Later Years: A Longitudinal
Survey., in. Jennings, M. Kent & Niemi, Richard, 1981: Generations and Politics: A Panel Study of Young
Adults and Their Parents.” Princeton, NJ: Princeton University Press.
R Core Team. 2020. R: A Language and Environment for Statistical Computing. Vienna, Austria: R
Foundation for Statistical Computing. https://www.R-project.org/.
10You can also read