A Hybrid Approach for COVID-19 Detection Using Biogeography-Based Optimization and Deep Learning
←
→
Page content transcription
If your browser does not render page correctly, please read the page content below
Computers, Materials & Continua                                                                 Tech Science Press
DOI:10.32604/cmc.2022.018487
Article

       A Hybrid Approach for COVID-19 Detection Using Biogeography-Based
                         Optimization and Deep Learning
  K. Venkatachalam1, Siuly Siuly2 , M. Vinoth Kumar3 , Praveen Lalwani1, Manas Kumar Mishra1 and
                                           Enamul Kabir4, *

   1
       Department of Computer Science and Engineering, CHRIST (Deemed to be University), Bangalore, 560074, India
           2
             Institute for Sustainable Industries & Liveable Cities, Victoria University, Melbourne, 14428, Australia
         3
           Department of Computer Science and Engineering, Anna University, University College of Engineering,
                                                      Dindigul, 624622, India
           4
             School of Sciences, University of Southern Queensland, Toowoomba, Darling Heights, 4350, Australia
                            *
                              Corresponding Author: Enamul Kabir. Email: Enamul.Kabir@usq.edu.au
                                         Received: 10 March 2021; Accepted: 19 April 2021

                    Abstract: The COVID-19 pandemic has created a major challenge for coun-
                    tries all over the world and has placed tremendous pressure on their public
                    health care services. An early diagnosis of COVID-19 may reduce the impact
                    of the coronavirus. To achieve this objective, modern computation methods,
                    such as deep learning, may be applied. In this study, a computational model
                    involving deep learning and biogeography-based optimization (BBO) for early
                    detection and management of COVID-19 is introduced. Specifically, BBO
                    is used for the layer selection process in the proposed convolutional neural
                    network (CNN). The computational model accepts images, such as CT scans,
                    X-rays, positron emission tomography, lung ultrasound, and magnetic res-
                    onance imaging, as inputs. In the comparative analysis, the proposed deep
                    learning model CNN is compared with other existing models, namely, VGG16,
                    InceptionV3, ResNet50, and MobileNet. In the fitness function formation,
                    classification accuracy is considered to enhance the prediction capability of the
                    proposed model. Experimental results demonstrate that the proposed model
                    outperforms InceptionV3 and ResNet50.

                    Keywords: Covid-19; biogeography-based optimization; deep learning;
                    convolutional neural network; computer vision

1 Introduction
     The outbreak of COVID-19 [1], also known as coronavirus caused by SARS-CoV-2, has
become a public health hazard for the international community. This outbreak was announced by
the WHO as a public health emergency of international concern on January 30, 2020 and was
officially declared as a pandemic [2–4] on March 11, 2020. COVID-19 is a contagious disease
that can be transmitted among humans. The number of confirmed cases worldwide has risen
exponentially over the past year, reaching 125,436,255 (with 101,304,833 recoveries and 2,756,767
deaths) as of March 25, 2021.

                        This work is licensed under a Creative Commons Attribution 4.0 International License,
                        which permits unrestricted use, distribution, and reproduction in any medium, provided
                        the original work is properly cited.
3718                                                                             CMC, 2022, vol.70, no.2

     The mass transportation and large gatherings during the Chinese festivals last year resulted
in the rapid spread of the virus in other parts of China [5]. The amount of deaths attributable
to this virus has already exceeded the numbers reported in other pandemics, such as SARS and
MERS [6]. As reported in [7–9], the usual manifestations of COVID-19 include fever, respiratory
symptoms, pneumonia, and low white blood cell count [10,11]. The virus has also been described
as an acute respiratory tract syndrome [12]. Its early symptoms include difficulty in breathing and
lung disease accompanied by hyperthermia. The aberration seen in lungs due to viruses other than
COVID-19 is visually similar or peripheral to that reported in viral pneumonia and other bacterial
pathogens [13]. To prepare countries in handling the pandemic and make efficient decisions, viral
activity predictive modelling studies are performed by using big data. Some of the issues being
faced by various countries due to COVID-19 include the following:
    1.   early and accurate diagnosis of the disease;
    2.   spreading awareness;
    3.   delivering relevant guidelines;
    4.   preventing the proliferation of hoaxes on social media;
    5.   saving health care experts some time from doing laborious jobs; and
    6.   ensuring adherence to social distancing norms.
     Machine learning can play a critical role in solving these issues [14–17]. Current medical infor-
matics and experience imply that reverse transcription polymerase chain reaction (RT-PCR) [18]
tests used for the detection or identification of viral RNA has low sensitivity especially at the
initial stage [19,20]. This problem has also been reported in laboratory tests [21] and can be
ascribed to many factors, including sample preparation and quality control [22].

1.1 Key Findings for the Early Diagnosis of COVID-19
     In the identification process, an inflammation of air sacs in the lungs is detected in the
form of pneumonia, and tracking the bilateral lung involvement can help identify various stages
of the disease, such as initial, intermediate, and last stage. Easily available imaging equipment,
such as chest X-rays and thoracic CT, greatly facilitates the diagnosis of such aberrations [23,24].
Therefore, a large number of abnormal chest CT images from COVID-19 patients have been
gathered and examined [25,26]. From this pool of data, bilateral pulmonary grounded glass
shadow [27] and nodules were observed, which indicate severe levels of the disease. Therefore, in
the early diagnosis of COVID-19 and community-acquired pneumonia [28,29], characterizing the
relationship among multiple features from CT images introduces the possibility for an automated
diagnosis of the disease. Sample chest CT images are shown in Figs. 1a–1c and 2.

                       (a)                       (b)                       (c)

                             Figure 1: CT images of COVID-19 patients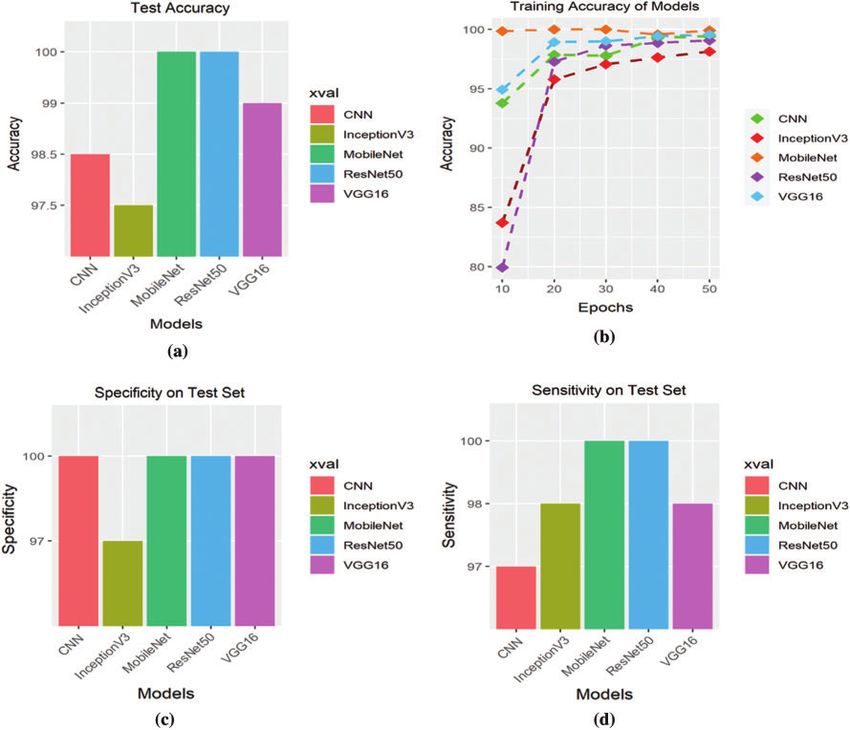
CMC, 2022, vol.70, no.2                                                                     3719

              Figure 2: CT images of patients with community-acquired pneumonia

1.2 Research Problem and Objectives
     COVID-19 detection via imaging has become a leading research area. However, the existing
approaches in this domain [30] have low prediction accuracy due to the improper selection of lay-
ers. Instead of randomly selecting layers in a convolutional neural network (CNN), a customized
selection by using optimization techniques that enhance prediction accuracy can be used.
    This research aims to propose a new method for the early prediction of COVID-19 to cease
further transmission and save more lives. Various images, such as X-rays, are being analyzed in
the prediction process by using the deep learning model. However, a pre-trained model may be
considered in hardware development, which results in low accuracy. Therefore, the classification
accuracy of real-time devices needs to be enhanced. To achieve this objective, a new model is
developed via biography-based optimization (BBO).

1.3 Research Contributions
    The highlights of this article are as follows:
    • This article extensively reviews the most important technologies that use computational
      methods for COVID-19 detection.
    • Most of the solutions provided by researchers are based on computed tomography images.
      Therefore, this article also categorizes these solutions during the analysis.
    • We propose a novel CNN for classifying COVID-19 positive patients based on chest X-rays.
    • BBO is used for the layer selection process in CNN.
    • Classification accuracy is taken into consideration in the fitness function composition.
    • The proposed model is compared with existing models to demonstrate its superiority.

1.4 Thesis Organization
    The rest of this article is organized as follows. Section 2 describes the recent advances in
COVID-19 diagnosis based on image data. Section 3 presents an overview of BBO. Section 4
presents the proposed model for classifying COVID-19 positive images. Section 5 presents an
experimental and comparative analysis of the existing models. Section 6 concludes the paper and
presents directions for future research.

2 Related Work on COVID-19 Prediction
    This section presents the recent applications of machine learning in COVID-19 diagnosis.
These existing applications are categorized into CT-scan- and X-rays-image-based approaches. The
advantages of the proposed model over extant ones are also highlighted.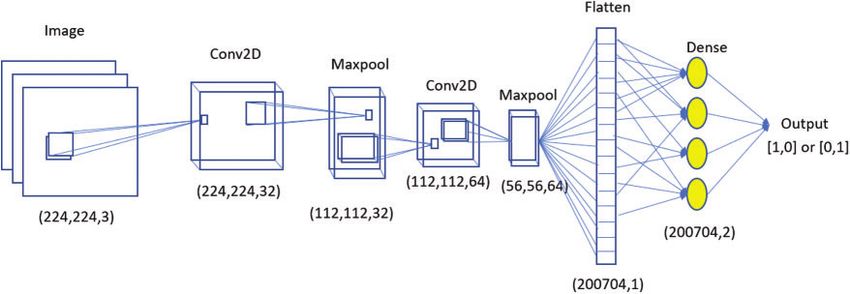
3720                                                                        CMC, 2022, vol.70, no.2

2.1 CT-Scan-Based Approaches
     Chest CT images of patients are classified into three groups, namely, COVID-19, influenza-
A viral pneumonia, and healthy cases. Researchers in [30] developed a dual sampling attention
network for diagnosing COVID-19 from community-acquired pneumonia cases by using chest CT.
They used a 3D CNN to determine the infection regions in lungs, but their proposed model
reported an accuracy of only 87%, which can be further improved by using other computational
models. Researchers in [31] attempted to identify pulmonary vein arteries from chest CT images
by using 3D CNN. While their proposed model obtained a maximum accuracy of near 93%,
this level can be improved further by using other computer vision approaches. Specifically, they
extracted the features of interstitial lung diseases and used deep CNN and transfer learning
afterward. However, this process reduced the accuracy of their model to 91%, which needs to be
improved further before their model can be adopted in real-world applications. Researchers in [32]
proposed a supervised dis-convolutional framework with an aim to detect pulmonary fissure in
CT. However, their proposed fissure methods are limited to handcrafted and local features, thereby
leading to low specificity. These methods obtained an accuracy of 98%. Moreover, they attempted
to classify pulmonary nodules from CT images by using a multi-view convolution network and
achieved a maximum accuracy of around 94%. However, to achieve further improvements, other
computational models can be adopted.
    In [33], 3D CNN was used to identify pulmonary nodules from chest CT images, and the
experimental results were compared in terms of their accuracy. A maximum accuracy of 95%
was obtained. Researchers in [34] predicted the severity of tuberculosis from CT pulmonary
images by using a 3D block-based residual deep learning network. They reported an accuracy
of 92.7%, which can be further improved by altering the depth-ResNet parameters. Researchers
in [35] used a deep transfer learning technique to classify patients infected with COVID-19.
Similar work was done by other researchers who reported a 96.2% accuracy. These researchers
also proposed a deep-learning-based system for segmenting and quantifying infected regions in
lungs based on chest CT. They also applied a VB-Net neural network for image segmentation and
obtained a dice similarity index of 91.6%. However, the benchmark was not reached in real time.
Therefore, another computation method with fine tuning parameters should be adopted. Other
researchers proposed efficient feature extraction techniques, such as ResNet and deep learning
models, and obtained significant results. Researchers in [36] proposed a deep learning framework
known as COVIDX-Net, whose structure is based on seven different deep CNNs, namely, VGG19,
DenseNet201, InceptionV3, ResNetV2, InceptionResNetV2, Exception, and MobileNetV2. Those
CNNs that outperformed others include VGG19 and DenseNet201, which reported an accuracy
of 90%. However, combining analytical models with CNNs can lead to further improvements.
Researchers in [37] proposed a novel technique with the objective of identifying lung abnormalities
or aberrations based on the deep learning framework and reported an accuracy of around 97.7%.

2.2 X-ray-Based Approaches
    X-rays are considered acceptable alternatives to chest CT scans given its greater sensitivity
to pulmonary diseases compared with the latter. One major reason for switching from chest CT
images is their sensitivity to pulmonary diseases and limited portability seeing that these images
require more staff and an additional hour to process, which leads to the possibility of infecting
hospital staff. By contrast, chest X-rays can be captured in a highly isolated environment and
requires less time to process. Sample chest X-rays of infected and non-infected patients are shown
in Fig. 3.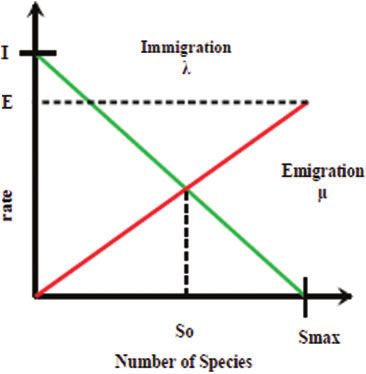
CMC, 2022, vol.70, no.2                                                                       3721

         Figure 3: X-ray images of non-COVID-19 (left) and COVID-19 patients (right)

    Previous studies have utilized the power of deep learning algorithms and trained neural
networks to detect the frontal view of chest radiographs for 14 pathologies (CheXNeXt, 2018).
They achieved an accuracy ranging from 80% to 85%, which is too low to be considered for actual
practice.
    Researchers in [38] demonstrated the use of an iteratively pruned deep learning model for
detecting the pulmonary manifestation of COVID-19 based on chest X-rays. They compared
the performance of customized CNN with that of ImageNet-pertained models, namely, VGG16,
VGG19, InceptionV3, Xception, InceptionResNetV2, MobileNetV2, DenseNet-201, and NasNet-
mobile. The customized CNN outperformed the other tested models with a maximum accuracy
of 99%.
     Researchers in [39] proposed a hybrid COVID-19 detection model that extracts small regions
from chest X-rays that contain identifying features of COVID-19 based on the improved marine
predators algorithm (IMPA). They also applied the ranking-based diversity reduction strategy
to enhance the performance of IMPA in a limited number of iterations. In the experimental
analysis, deep learning algorithms (i.e., CNN) have been proven to be strongly optimistic for image
classification, but they require more data for testing and classification to achieve an improved
accuracy. However, during the pandemic, obtaining a sufficient number of chest radiographs for
training the algorithm with higher precision is difficult.
    In this article, we utilized three CNNs for diagnosing COVID-19, namely, ResNet50, Incep-
tionV3, and Inception-ResNetV2 [40]. ResNet50 obtained the highest accuracy of 97%, but a more
rigorous testing of models should be implemented.

2.3 Advantage of the Proposed Model Over Existing Methods
    The merits of the proposed model are as follows:
    • In the proposed work, a novel approach for layer selection based on BBO is devised. This
      method uses classification accuracy as a fitness function in contrast to existing works where
      the classification accuracy is low due to improper layer selection.
    • Some researchers attempted to capture the solution by using metaheuristics, such as GA,
      but BBO obtains a better solution with a smaller number of iterations [41].
    • Deep transfer learning is used to train the CNN classification model with VGG16 and
      InceptionV3, thereby reducing pre-processing and feature selection works in contrast to
      existing techniques.
    • The proposed technique obtained a classification accuracy of 97.98% for publicly available
      COVID-19 datasets, and this accuracy is comparatively better than that of other techniques.
3722 CMC, 2022, vol.70, no.2
3 Overview of Biogeography-Based Optimization
Introduced by Simon et al. in 2008 [41], BBO distributes biological species in a geographical
way. To represent a geographical zone, an index called habitat suitability index (HSI) is considered.
Another index called suitability index variable (SIV) is used to represent the area and livelihood
conditions. The goodness of each habitat is represented by the HSI value and the number of
species. The HSI value can be increased by adopting features from the high HSI solution, and
this mechanism is called BBO.
Fig. 4 illustrates the species abundance process wherein the immigration and emigration rates
are represented by λ and μ, respectively. In the immigration curve, the immigration rate is
estimated to be maximum (I) when the habitat consists of zero species. Fig. 4 also shows that
λ decreases along with increasing species and reaches zero when the habitat has the maximum
number of species. Fig. 4 also shows that the emigration rate increases along with the number of
species and reaches 0 when no species are in the habitat. In the balanced condition, both rates
are equal as indicated by (So).
Figure 4: Species representation of a single habitat
The immigration and emigration rates are formulated from the straight-line curve (Fig. 4) as
follows:
E × nk nk
μ= , λ=I 1− (1)
nt nt
where nk represents the number of species inside the habitat, and nt denotes the total number of
species.
The BBO mechanism is based on migration and mutation processes as described below.
3.1 Migration
Let represent the optimization problem. The population members represent the candidate
solution, with each member having an n dimension vector called habitat and being represented by
SIV. The fitness value of a habitat is estimated by using the number of species and HSI value. In
the solution improvement process, a low HSI solution shares the same features as the high HSICMC, 2022, vol.70, no.2 3723
solution vector based on λ and μ. One habitat (Hi) is initially selected by using λ, and another
habitat (Hj) is selected based on μ. In the migration process, some SIVs from Hj are transferred
to Hi.
3.2 Mutation
The mutation process in BBO is reflective of a natural disaster. Specifically, similar to dis-
asters, the mutation has an unpredictable effect when applied on a habitat. This effect depends
on the number of species and is estimated by using Eq. (1). In this process, the probability is
estimated for each habitat. A high probability corresponds to low chances of mutation, that is,
the solution is not optimal, and vice-versa.
⎧
⎪ −(λnk + μnk )Pnk + μnk+1 Pnk+1 , nk = 0
⎨
Pnk = −(λnk + μnk )Pnk + μnk+1 Pnk+1 + μnk−1 Pnk−1, 1 ≤ nk ≤ Smax − 1
h
(2)
⎪
⎩
−(λnk + μnk )Pnk + μnk−1 Pnk−1 , nk = S_max
where m(nk) represents the mutation rate of nk species, mmax is the maximum mutation rate,
and Pmax represents the maximum mutation probability. This mutation has three key advantages.
First, this process has a greater variety of candidate solutions. Second, resist solution to disrupt
having HSI value. Third, this process improves both the high and low HSI solutions. However,
the mutation process may degrade the solution vector.
4 Proposed Approach: BBO-Based Deep Learning Model
This section presents the notations and abbreviations, an overview of the proposed model,
a description of habitat representation and initialization, the fitness function, the migration and
mutation processes, the pseudo code of the BBO-based deep learning model, and the layers of
the optimized model.
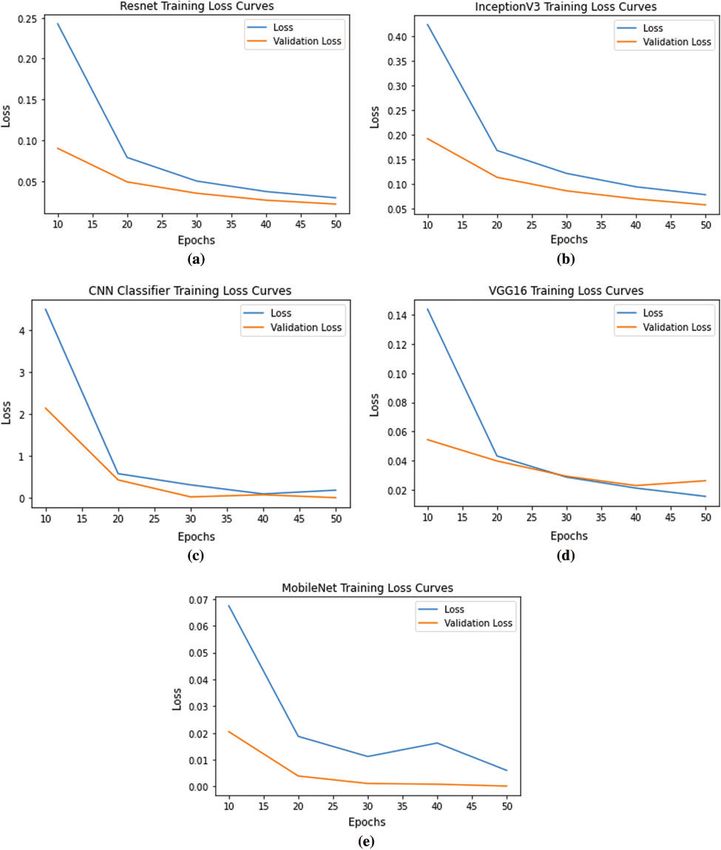
4.1 Overview of the Proposed Model
As shown in Fig. 5, in the initial step, all layers of each type in the CNN are randomly
initialized, and the solution vectors are framed. Afterward, the classification accuracy of all
random solution vectors (habitats) is estimated as shown in Fig. 5b. Thereafter, the habitat (i.e.,
solution vector) is updated with the help of migration and mutation processes by using the
immigration and emigration rates. The BBO mechanism is repeated, that is, the migration and
mutation steps are repeated until the best classification accuracy is achieved as shown in Fig. 5a.
4.2 Habitat Representation and Initialization
In this process, the habitat represents the type of layers in CNN and is initialized with a
number of layers of each type. Let Hi represent the habitat (i.e., type of layers), where Hi = {H1 ,
H2 , . . ., Ht }. Each SIV is randomly initialized between 1 and Lmax , where Lmax represents the
maximum number of layers of each type that can be considered.
4.3 Fitness Function Formulation
Classification accuracy is considered in the fitness formulation process as shown in Eq. (4).
Increasing the classification accuracy also increases the fitness score. Therefore, the objective is to
maximize Eq. (4). In BBO, the fitness score represents the goodness of habitat as reflected by the
HSI value and number of species.3724 CMC, 2022, vol.70, no.2
Figure 5: Optimized deep learning model
4.4 Migration Process
The migration process is divided into two steps. In the first step, two habitats are selected
probabilistically. The first habitat (Hi ) is chosen probabilistically based on immigration rate (λi ).
Meanwhile, the second habitat (Hj ) is selected probabilistically based on emigration rate (μj ). In
the second step, the SIVs from habitat Hj are transferred to Hi , that is, a number of layers of
each type appears from the high HSI solution to the low HSI one. One position (i.e., pi ) is then
randomly generated between the s1 and tth dimensions and, from position pi to the last position,
all SIVs are transferred from Hj to Hi .
4.5 Mutation Process
In the mutation process, we consider the number of layers ranging from 1 to 25 of each type.
In this mechanism, a habitat is selected while considering mutation probability. Afterward, one
SIV is selected between the 1 to tth dimensions randomly and replaced with a random selection
of layers.CMC, 2022, vol.70, no.2 3725
4.6 Step-Wise Approach of the Proposed Framework
The proposed model involves several steps, namely, BBO, classification accuracy and solution
evaluation, and prediction process initiation. The model workflow is illustrated in Fig. 5, and its
algorithm is shown in Algorithm 1.
Algorithm 1: Proposed Algorithm
1. Data Cleaning and Filtering (removing nan values and enhancing consistency of data).
2. Optimization of model architecture using BBO (refer to Algorithm 2)
3. Splitting of data in train and test set.
4. Training the model on train set.
5. Model testing and evaluation of test set.
4.6.1 Workflow
The workflow is divided into three phases after BBO (i.e., after the best solution for the
prediction initiation is evaluated). BBO is briefly discussed and illustrated above.
The three phases include training the model on the train set, testing the model on the test set,
and evaluating the model on the test set. The evaluation metrics are briefly discussed in Section 6.
4.6.2 Layer Description of the Obtained Optimized Deep Learning Model
The obtained optimized CNN comprises 2 conv2D layers, 2 maxpool layers, 1 flatten layer,
and 1 dense layer. The first conv2D layer consists of 32 filters, whereas the other conv2D layer
consists of 64 filters. Chest X-rays with dimensions of (244, 244) are pre-processed (inspired from
VGG16 image pre-processing). The proposed model is illustrated in Fig. 6. The dataset is split into
three sets, namely, the train set, test set, and validation set. The model is trained for 50 epochs
and is evaluated based on its classification accuracy. Section 5 presents a detailed description of
the results.
Figure 6: Optimized CNN model architecture3726 CMC, 2022, vol.70, no.2
4.7 Algorithm of the BBO-Based Deep Learning Model
Algorithm 2: BBO based Deep Learning Model
Input:
(a) Random Number of Layers of each Type Hi = H1, H2, H3,. . ., Ht
(b) Predefined Number of Habitats Nh
(c) Dimension of each Habitat t
Result: Set of Near Optimal Layer of each Type
Hi = H1, H2, H3,. . ., Ht
1. Step 1: Initialize the Habitat Hi , ∀, 1 ≤ i ≤ Nh ;
2. Step 2:
3. while (T!=Max.iteration) do
4. 2.1 Calculate the HSI value of each Habitat Hi, ∀i , 1 ≤ i ≤ Nh using Eq. (4);
5. 2.2 Sort all the habitats from best to worst according to the HSI values;
6. 2.3 Map the species count nk for each Habitat;
7. 2.4 Estimate the immigration and Emigration rates i.e., λi& μi for each Habitat;
8. 2.5 Update the habitat using the Migration and Mutation Operator;
9. while (i ! = Nh) do
10. 2.5.1 Select Hi using the immigration rate λi
11. while (j ! = Nh) do
12. (a) Select Hj using the emigration rate μj ;
13. (b) Generate the random number r1 between 0 and 1;
14. if (r1 < μj) then
15. Generate random position np, where 1 ≤ np ≤ t th;
16. while (k ! = np) do
17. HKi = Hk j
18. end
19. end
20. end
21. 2.5.2 Update the Habitat using Mutation;
22. (a) Estimate the probability of mutation(Pi) of habitat using immigration and emigr-
ation rates.;
23. (b) Select the habitat based on mutation probability;
24. if (Hi is chosen) then
25. (Op1) Select the random SIV, where 1 ≤ r2 ≤ t th;
26. (Op1) Select the random number of layers for the selected SIV and replace it;
27. end
28. end
29. end
Step 3: Near optimal LayerCMC, 2022, vol.70, no.2 3727
5 Experimental Analysis
The proposed model is implemented along with other models, namely, VGG16, MobileNet,
InceptionV3, and ResNet50, on a public dataset [35]. Images are taken from various collections
of datasets [35]. A total of 413 COVID-19 positive images and 439 normal pneumonia-infected
images are obtained. The proposed model reaches BBO convergence after 200 iterations.
5.1 Classification Accuracy
Classification accuracy is computed as the ratio of correctly classified samples with respect to
the total number of samples and is represented by C(A).
Sc
C(A) = (3)
St
where Sc indicates the correctly classified samples, and St denotes the total number of samples. For
binary classification problems, accuracy as either positive or negative values as shown in Eq. (4).
Tp + Tn
C(A) = (4)
Tp + Tn + Fp + Fn
where Tp , Tn , Fp , and Fn represent true positive, true negative, false positive, and false negative,
respectively.
The metrics of the confusion matrix are mathematically represented in Eqs. (5)–(7).
Tp + Tn
Accuracy = (5)
Tp + Tn + Fp + Fn
Tp
Sensitivity = (6)
Tp + Fn
Tn
Specificity = (7)
Tn + Fp
5.2 Model Training Phase Evaluation
The model training phase is evaluated based on training and validation losses. The results
are illustrated in Figs. 7a–7e. Training loss denotes the error on the training set in each epoch,
whereas the validation loss denotes the error on the validation set (which is 20% of the training
set).
As shown in Fig. 7, InceptionV3 has a monotonically decreasing loss curve with Li (Initial
Loss) = 0.45 and Fi (Final Loss) = 0.1. The proposed CNN also has a significant decreasing
loss curve with Li = 4.6 and Fi = 0.2. ResNet50 has a loss curve with Li = 0.24 and Fi = 0.21,
whereas MobileNet has a loss curve with Li = 0.069 and Fi = 0.01. In VGG16, the curve begins
with loss (Li = 0.14) and ends with another loss (Fi = 0.02). These results indicate that VGG16
and the proposed CNN model have the best fit among all models during the training phase.3728 CMC, 2022, vol.70, no.2 Figure 7: Loss Information patterns of (a) ResNet50, (b) InceptionV3, (c) CNN, (d) VGG16, and (e) MobileNet
CMC, 2022, vol.70, no.2                                                                            3729

5.3 Experimental Results
    The results obtained from the confusion matrix are shown in Tab. 1 and illustrated in
Figs. 8a–8d.

                    Table 1: Comparative analysis of machine learning models
Models                    Test accuracy         Train accuracy          Specificity        Sensitivity
Proposed CNN              98.5                  97.6                    100                97
VGG16                     99.01                 98.2                    100                98.01
InceptionV3               97                    97.2                    97.01              98
ResNet50                  100                   96.8                    100                100
MobileNet                 100                   99.1                    100                100

Figure 8: (a–b) Accuracy on the train and test sets, and (c–d) specificity and sensitivity on the test
set
3730 CMC, 2022, vol.70, no.2
A. Training Accuracy: In the training process, MobileNet and the proposed CNN obtained
the best accuracy, sequentially followed by VGG16, ResNet50, and InceptionV3. The accu-
racy of these models is illustrated in Fig. 8b. The proposed CNN outperformed both
InceptionV3 and ResNet50 and obtained a nearly similar performance as VGG16.
B. Testing Accuracy: MobileNet and ResNet50 obtained the best testing accuracy as shown
in Fig. 8a. The proposed model outperformed InceptionV3 and demonstrated nearly the
same performance as MobileNet and ResNet50.
C. Specificity: The proposed model obtained a similar specificity as MobileNet, ResNet50, and
VGG16 and outperformed InceptionV3 as shown in Fig. 8c.
D. Sensitivity: The proposed model obtained a comparable and nearly similar sensitivity as
MobileNet and ResNet50.
6 Conclusion and Recommendations for Future Research
New hikes in the number of COVID-19 cases are being reported all over the world. One
profound symptom of COVID-19 is a lung infection. Therefore, medical imaging techniques, such
as CT, can be used for COVID-19 diagnosis. This article proposed an optimized computational
model for the early detection and management of COVID-19. In this model, BBO was used for
selecting the layers of the deep learning model to achieve optimal accuracy. Classification accuracy
was considered in the fitness function formation to enhance the prediction capability of the
algorithm. The proposed model accepts images, such as CT, X-rays, positron emission tomography,
lung ultrasounds, and magnetic resonance imaging, as inputs. The proposed deep learning model
CNN was also compared with existing models, namely, VGG16, InceptionV3, ResNet50, and
MobileNet. Results show that this model produces significant results with a training accuracy
higher than those of InceptionV3 and ResNet50. This model also outperformed InceptionV3 on
the test set.
Future research may adopt other optimized algorithms, such as general adversarial nets, for
data augmentation to produce more significant results. Given that the dataset used in this study
was limited, future studies should utilize additional datasets to further enhance the findings of
this work.
Funding Statement: The authors received no specific funding for this study.
Conflicts of Interest: The authors declare that they have no conflicts of interest to report regarding
the present study .
References
[1] J. Chan, F. Woo, S. Yuan, K. H. Kok, K. Kai-Wang et al., “A familial cluster of pneumonia associated
with the 2019 novel coronavirus indicating person-to-person transmission: A study of a family cluster,”
Lancet, vol. 395, no. 10223, pp. 514–523, 2020.
[2] W. H. Organization, “Who director-general’s opening remarks at the media briefing on covid-19—
11 march 2020,” 2020. [Online]. Available: https://www.who.int/director-general/speeches/detail/who-
director-general-s-opening-remarks-at-the-media-briefing-on-covid-19.
[3] C. Lindmeier, “Statement on the second meeting of the international health regulations. Emer-
gency committee regarding the outbreak of novel coronavirus,” (2019-ncov), 2005. [Online]. Available:
https://www.who.int/news-room/detail/30-01-2020-statement-onthesecond-meeting-of-the-international-
health-regulations, 2020.CMC, 2022, vol.70, no.2 3731
[4] C. Sohrabi, Z. Alsafi, N. O’Neill, M. Khan, A. Kerwan et al., “World health organization declares
global emergency: A review of the 2019 novel coronavirus (COVID-19),” International Journal of
Surgery, vol. 76, pp. 71–76, 2020.
[5] Q. Li, X. Guan, P. Wu, X. Wang, L. Zhou, Y. Tong et al., “Early transmission dynamics in wuhan,
China, of novel coronavirus–infected pneumonia,” New England Journal of Medicine, vol. 382, no. 13,
pp. 1199–1207, 2020.
[6] E. Mahase, “Coronavirus: Covid-19 has killed more people than SARS and MERS combined, despite
lower case fatality rate,” vol. 368, pp. 843–848, 2020.
[7] C. Calisher, D. Carroll, R. Colwell, R. B. Corley, P. Daszak et al., “Statement in support of the
scientists, public health professionals, and medical professionals of China combatting COVID-19,”
Lancet, vol. 395, no. 10226, pp. 42–43, 2020.
[8] W. Carlos, S. D. Cruz, B. Cao, S. Pasnick and S. Jamil, “COVID-19 disease due to SARS-coV-2 (novel
coronavirus),” American Journal of Respiratory and Critical Care Medicine, vol. 201, no. 4, pp. 7–8, 2020.
[9] C. Huang, Y. Wang, X. Li, L. Ren, J. Zhao et al. “Clinical features of patients infected with 2019
novel coronavirus in wuhan, China,” Lancet, vol. 395, no. 10223, pp. 497–506, 2020.
[10] W. Guan, Z. Ni, Y. Hu, W. Liang, C. Ou J. et al., “Clinical characteristics of coronavirus disease 2019
in China,” New England Journal of Medicine, vol. 382, no. 18, pp. 1708–1720, 2020.
[11] M. Hope, D. Constantine, A. Raptis, and T. S. Henry, “Chest computed tomography for detection of
coronavirus disease 2019 (COVID-19): Don’t rush the science,” Ann International Medicine, vol. 173,
no. 2, pp. 147–148, 2020.
[12] N. Chen, M. Zhou, X. Dong, J. Qu, F. Gong et al., “Epidemiological and clinical characteristics of 99
cases of 2019 novel coronavirus pneumonia in wuhan, China: A descriptive study,” Lancet, vol. 395,
no. 10223, pp. 507–513, 2020.
[13] D. Kermany, S. M. Goldbaum, H. Liang, S. L. Baxter, A. McKeown et al., “Identifying medical
diagnoses and treatable diseases by image-based deep learning,” Cell, vol. 172, no. 5, pp. 1122–1131,
2018.
[14] A. Alimadadi, S. Aryal, I. Manandhar, P. B. Munroe, B. Joe et al., “Artificial intelligence and machine
learning to fight COVID-19,” Physiological Genomics, vol. 52, no. 4, pp. 200–202, 2020.
[15] P. Hamet and J. Tremblay, “Artificial intelligence in medicine,” Metabolism, vol. 69, pp. S36–S40, 2020.
[16] M. Kaur, H. K. Gianey, D. Singh and M. Sabharwal, “Multi-objective differential evolution based
random forest for e-health applications,” Modern Physics Letters, vol. B33, no. 5, pp. 1950–022, 2019.
[17] C. Jin, W. Chen, Y. Cao, Z. Xu, Z. Tan et al., “Development and evaluation of an artificial intelligence
system for COVID-19 diagnosis,” Nature Communications, vol. 11, no. 1, pp. 1–14, 2020.
[18] C. Heid, A. J. Stevens, K. J. Livak and P. M. Williams, “Real time quantitative PCR,” Genome Research,
vol. 6, no. 10, pp. 986–994, 1996.
[19] Y. Li and L. Xia, “Coronavirus disease 2019 (COVID-19): Role of chest CT in diagnosis and
management,” American Journal of Roentgenology, vol. 214, no. 6, pp. 1280–1286, 2020.
[20] J. Kanne, “Chest CT findings in 2019 novel coronavirus (2019-nCoV) infections from wuhan, China:
Key points for the radiologist,” Radiology, vol. 295, no. 1, pp. 16–17, 2020.
[21] Y. Fang, H. Zhang, J. Xie, M. Lin, L. Ying et al., “Sensitivity of chest CT for COVID-19: Comparison
to RT-pCR.” Radiology, vol. 296, no. 2, pp. E115–E117, 2020.
[22] T. Liang, Handbook of COVID-19 Prevention and Treatment: Compiled According to Clinical Experi-
ence. Zhejiang University School of Medicine, 2020. [Online]. Available: https://smartnet.niua.org/sites/
default/files/resources/handbook_of _covid_19_prevention_en_mobile.pdf.
[23] N. Ali, C. Kaya and Z. Pamuk, “Automatic detection of coronavirus disease (covid-19) using X-ray
images and deep convolutional neural networks,” 2020, [Online]. Available: https://arxiv.org/abs/2003.
10849.
[24] T. A. Mpesiana, “Covid-19: Automatic detection from x-ray images utilizing transfer learning with
convolutional neural networks,” Physical and Engineering Sciences in Medicine, vol. 43, no. 2, pp. 635–
640, 2020.3732 CMC, 2022, vol.70, no.2
[25] A. Bernheim, X. M. M. Huang, Y. Yang and Z. A. Fayad, “Chest CT findings in coronavirus disease-
19 (COVID-19): Relationship to duration of infection,” Radiology, vol. 295, no. 3, pp. 685–691, 2020.
[26] J. Kanne, P. Brent, P. Little, J. H. Chung, B. M. Elicker et al., “Essentials for radiologists on COVID-19:
An update—Radiology scientific expert panel,” vol. 296, no. 2, pp. E113–E114, 2020.
[27] J. Lei, J. Li, X. Li and X. Qi, “CT imaging of the 2019 novel coronavirus (2019-nCoV) pneumonia,”
Radiology, vol. 295, no. 1, pp. 18–28, 2020.
[28] D. Kermany, S. M. Goldbaum, W. Cai, H. L. Sally, L. Baxter et al., “Identifying medical diagnoses
and treatable diseases by image-based deep learning,” Cell, vol. 172, no. 5, pp. 1122–1131, 2018.
[29] J. Kanne, “Chest CT findings in 2019 novel coronavirus (2019-nCoV) infections from wuhan, China:
Key points for the radiologist,”, Radiology, vol. 295, no. 1, pp. 16–17, 2020.
[30] X. Ouyang, J. Huo, L. Xia, F. Shan, J. Liu et al., “Dual-sampling attention network for diagnosis of
COVID-19 from community acquired pneumonia,” IEEE Transactions on Medical Imaging, vol. 39, no.
8, pp. 2595–2605, 2020.
[31] P. Nardelli, D. J. Carretero, D. B. Pelaez, G. R. Washko, F. N. Rahaghi et al., “Pulmonary artery–vein
classification in CT images using deep learning,” IEEE Transactions on Medical Imaging, vol. 37, no. 11,
pp. 2428–2440, 2018.
[32] S. Gerard, E. Taylor, J. Patton, G. E. Christensen, J. E. Bayouth et al., “Fissurenet: A deep learning
approach for pulmonary fissure detection in CT images,” IEEE Transactions on Medical Imaging, vol.
38, no. 1, pp. 156–166, 2018.
[33] A. Pezeshk, S. Hamidian, N. Petrick and B. Sahiner, “3-D convolutional neural networks for automatic
detection of pulmonary nodules in chest CT,” IEEE Journal of Biomedical and Health Informatics, vol.
23, no. 5, pp. 2080–2090, 2018.
[34] X. Gao, C. J. Reynolds and E. Currie, “Analysis of tuberculosis severity levels from CT pulmonary
images based on enhanced residual deep learning architecture,” Neurocomputing, vol. 392, pp. 233–244,
2020.
[35] Y. Pathak, P. K. Shukla, A. Tiwari, S. Stalin and S. Singh, “Deep transfer learning-based classification
model for COVID-19 disease,” Irbm, 2020 (In Press).
[36] E. Hemdan, M. A. Shouman and M. EsmailKarar, “Covidx-net: A framework of deep learning
classifiers to diagnose covid-19 in X-ray images,” 2020. arXiv preprint arXiv: 2003.11055.
[37] A. Bhandary, G. AnanthPrabhu, V. Rajinikanth, K. PalaniThanaraj, S. C. Satapathy et al., “Deep-
learning framework to detect lung abnormality—A study with chest X-ray and lung CT scan images,”
Pattern Recognition Letters, vol. 129, pp. 271–278, 2020.
[38] S. Rajaraman, J. Siegelman, P. O. Alderson, L. S. Folio and L. R. Folio, “Iteratively pruned deep
learning ensembles for covid-19 detection in chest X-rays,” IEEE Access, vol. 8, pp. 115041–115050,
2020.
[39] M. Abdel-Basset, R. Mohamed, M. Elhoseny, R. K. Chakrabortty and M. Ryan, “A hybrid COVID-19
detection model using an improved marine predators algorithm and a ranking-based diversity reduction
strategy,” IEEE Access, vol. 8, pp. 79521–79540, 2020.
[40] A. Narini, C. Kaya and Z. Pamuk, “Automatic detection of coronavirus disease (covid-19) using x-ray
images and deep convolutional neural networks,” 2020. arXiv preprint arXiv: 2003.10849.
[41] D. Simon, “Biogeography-based optimization,” IEEE Transactions on Evolutionary Computation, vol. 12,
no. 6, pp. 702–713, 2008.You can also read