A LARGE-SCALE COVID-19 TWITTER DATASET WITH LATENT TOPICS, SENTIMENT AND LOCATION INFORMATION
←
→
Page content transcription
If your browser does not render page correctly, please read the page content below
A LARGE-SCALE COVID-19 TWITTER
                  DATASET
     WITH LATENT TOPICS, SENTIMENT AND
                 LOCATION
               INFORMATION
Abstract
As a platform, Twitter has been a significant public space for discussion related to the COVID-19 pandemic. Public social media platforms such
as Twitter represent important sites of engagement regarding the pandemic and these data can be used by research teams for social, health, and
other research. Understanding public opinion about COVID-19 and how information diffuses in social media is important for governments and
research institutions. Twitter is a ubiquitous public platform and, as such, has tremendous utility for understanding public perceptions, behavior,
and attitudes related to COVID-19. In this research, we present CML-COVID, a COVID-19 Twitter data set of 19,298,967 million tweets from
5,977,653 unique individuals, and summarize some of the attributes of these data. These tweets were collected between March 2020 and July
2020 using the query terms ‘coronavirus’, ‘covid’, and ‘mask’ related to COVID-19. We use topic modeling, sentiment analysis, and descrip-
tive statistics to describe the tweets related to COVID-19 we collected and the geographical location of tweets, where available. We provide
information on how to access our tweet dataset (archived using twarc) at https://doi.org/10.18738/T8/W1CHVU.

Introduction
COVID-19, an unparalleled global health emergency, led to an exceptional response on social media platforms, which includes posts related to
social, political, and economic life. High volumes of COVID-19-related misinformation are also present on online social networks such as
Twitter [1]. As 68% of Americans report they use social media to access information and news [2,3], understandings of attitudes, perceptions,
and responses to COVID-19 must be studied using social media data. Furthermore, one-third of people report that Twitter is the most important
source of scientific information and news [3]. Twitter, on the other hand, can be a source of misinformation about health issues such as
vaccination [4]. While the Ebola outbreak in 2014 [5] and the spread of Zika in 2016 [6] highlight the importance of studying pandemics in the
content of social networks [7,8], there is a new urgency in monitoring social media content related to COVID-19 [3]. Specifically, social media
data related to the COVID-19 pandemic can, for example, be used to study: (1) the impact of social networks on health info-/mis-information,
(2) how misinformation diffusion and spreading can influence behavior and beliefs, and (3) the effectiveness of COVID-19-related actions and
campaigns deployed by agencies and governments at global and local scales [9]. We explore the frequency of tweet activity related to
COVID-19. We collected tweets in real-time using the Twitter API from March - July 2020 with the following COVID-19-related query terms
('coronavirus', 'covid', and 'mask'). We collected over 19,298,967 million tweets from March – June 2020.

Methods
Our curated data set, CML-COVID, includes 19,298,967 million tweets from 5,977,653 unique individuals from March – June 2020. On
average, a user in our dataset posted 3 tweets. All data were collected from Twitter through Netlytic [11], which queried the Twitter REST
API. The dataset is roughly 15 GB of raw data. To comply with Twitter’s Terms & Conditions (T&C), we have not publicly released the full
text/API-derived information from the collected tweets. Rather, our released data set includes a list of the tweet IDs that others can use to
retrieve the full tweet objects directly from Twitter using their own API calls. There are a variety of tools to accomplish this task such as
Hydrator. Twitter also provides documentation in their Developer site4 on how to hydrate 100 tweets per API request.

First, we pre-processed each raw tweet by concatenating and converting csv files into Python DataFrames and lists in order to optimize our
subsequent data processing. The pre-processing task includes removing characters such as “\, /, ∗ and etc.” and filtering out stop words

                                                        Printed by Wolfram Mathematica Student Edition
2   Project 3.nb

(including most rare and most frequent words), and performing text tokenization. Text tokenization is the process of breaking up a string of text
into characters or other subtexts called tokens. [15] This step is essential to next steps which includes topic modeling and sentiment analysis.
Both of these techniques provide methods for automatically organizing and summarizing large electronic archives, whether it be based on a
given topic or the sentiment of a tweet. For topic modeling we applied an unsupervised topic clustering technique called Latent Dirichlet
Allocation (LDA). Latent Dirichlet Allocation is a topic modeling technique(Bayesian Model) which is typically used to find topics a document
belongs to based on the words in the document. [16] The probability of each topic lying within the document is a representation of the documen-
t.[13]We used TextBlob to perform sentiment analysis. We found extraneous terms (e.g., ‘amp’, ‘dan’, and ‘na’) in our derived topic models.
Therefore, we re-ran LDA and removed these terms to present clearer topic modeling results (see table 3).

We then conducted a frequency analysis by time. We identified the date and time of each tweet and counted the frequencies of tweets for each
day as illustrated in Figure 3. Tweet frequency is relatively consistent during our data collection period. We then calculated the sentiment of
each tweet. Though sentiment analysis has its limitations with large tweet corpora, we do believe, like others, that there is some utility in
understanding top-level sentiment of these data [10]. To extract information related to sentiment in our collected tweets, we used Textblob to
extract the sentiment and scores. We divide tweet sentiment into three main categories - ‘Negative’, ‘Neutral’ and ‘Positive’. For each day we
count the number of tweets with one of these three categories. Figure 4 depicts the time evolution of sentiment by category.

Results
A preliminary analysis of the data shows that English is the dominant language in the tweets we collected (65.4%). One reason for this is that
the keywords that we used for querying the Twitter API were all English-language; however other languages are also notably present. For
example, 12.2% of the tweets are Spanish-language. Table 1 summarizes the top 10 languages, the frequency of associated tweets, and the
percentage of each language in our dataset; 63 different languages were identified among the tweets and 3.4% of tweets had an undefined
language.

For each state in the United States with identifiable state-level location, we counted the number of tweets and calculated the frequency of tweets
per day. These are illustrated in Figure 1. The United States has the highest frequency of tweets during the period that we collected these data.
The number of tweets are low for most regions and countries. As figure 1 illustrates, Canada, Saudi Arabia and India also have a high volume
of tweets.

                                                       Printed by Wolfram Mathematica Student Edition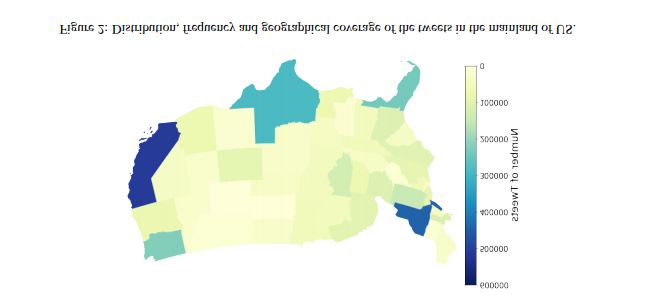
Project 3.nb       3

The United States has the highest frequency of tweets during the period that we collected these data. The number of tweets are low for most
regions and countries. As figure 1 illustrates, Canada, Saudi Arabia and India also have a high volume of tweets.

Figure 2 depicts the frequency and distribution of tweets in the mainland US. California, New York and Texas have the most number of tweets.
The distribution of tweets by state has some similarity to US population distribution. California (“CA”) appeared in 355,364 of those tweet ID
locations, New York (“NY”) appeared in 295,289 user locations, and Texas (“TX”) appeared in 163,920 user locations.

                                                       Printed by Wolfram Mathematica Student Edition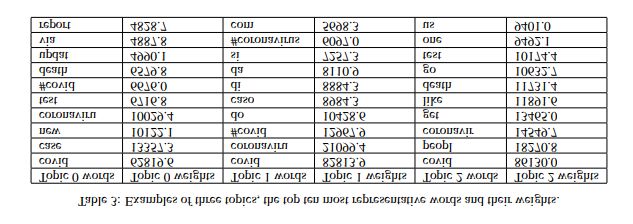
4   Project 3.nb

As figure 4 indicates, neutral tweets were the most numerous, followed by positive tweets. The gap in frequency between the three sentiment
categories is initially, in the first two weeks of April, 2020 reasonably large, but closes after the second week of April,
2020.

                                                     Printed by Wolfram Mathematica Student Edition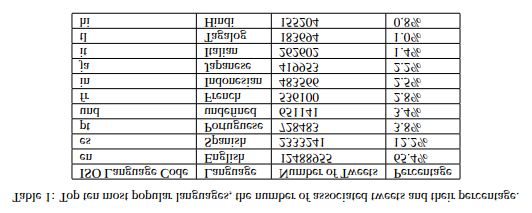
Project 3.nb    5

Discussion and Conclusion
To perform topic modeling, we sampled 20% of the tweets in our dataset and trained an LDA model that was used to estimate the top most
representative words in each topic. Using the trained LDA-based topic model, we obtained 10 topic clusters. Table 3 illustrates the top ten most
representative terms associated with each detected ‘topic’ (3 topics are illustrated in table 3; topic 1 is Spanish-language)n. Since tweets can be
in any of 64 different languages, the topics and the top words may contain words and symbols that are from different languages. As we found,
cleaning the data based on stopwords in one language is not enough to solve these issues.

References
[1] Brennen, J. Scott, et al. “Types, sources, and claims of COVID-19 misinformation.” Reuters Institute 7 (2020): 3-1.
[2] Ortiz-Ospina, Esteban. “The rise of social media.” Our World in Data 18 (2019).
[3] Singh, Lisa, et al. “A first look at COVID-19 information and misinformation sharing on Twitter.” arXiv preprint
arXiv:2003.13907 (2020).
[4] Broniatowski, David A., et al. “Weaponized health communication: Twitter bots and Russian trolls amplify the
vaccine debate.” American journal of public health 108.10 (2018): 1378-1384.
[5] Gomes, Marcelo FC, et al. “Assessing the international spreading risk associated with the 2014 West African Ebola
outbreak.” PLoS currents 6 (2014).
[6] Petersen, Eskild, et al. “Rapid spread of Zika virus in the Americas-implications for public health preparedness for
mass gatherings at the 2016 Brazil Olympic Games.” International Journal of Infectious Diseases 44 (2016): 11-15.
[7] Crook, Brittani, et al. “Content analysis of a live CDC Twitter chat during the 2014 Ebola outbreak.” Communication
Research Reports 33.4 (2016): 349-355.
[8] Fu, King-Wa, et al. “How people react to Zika virus outbreaks on Twitter? A computational content analysis.”
American journal of infection control 44.12 (2016): 1700-1702.
[9] Cinelli, Matteo, et al. “The covid-19 social media infodemic.” arXiv preprint arXiv:2003.05004 (2020).
[10] Kiritchenko, Svetlana, Xiaodan Zhu, and Saif M. Mohammad. “Sentiment analysis of short informal texts.” Journal
of Artificial Intelligence Research 50 (2014): 723-762.
[11] Gruzd, Anatoliy. “Netlytic: Software for Automated Text and Social Network Analysis.” (2016) Available at
http://Netlytic.org.
[12] Forejt, V., Kwiatkowska, M., & Parker, D. (2012, October). Pareto curves for probabilistic model checking.
In International Symposium on Automated Technology for Verification and Analysis (pp. 317-332). Springer, Berlin, Heidelberg.
[13]Blei, D. M., Ng, A. Y., & Jordan, M. I. (2003). Latent dirichlet allocation. the Journal of machine Learning research, 3, 993-1022.
[14] Feldman, R. (2013). Techniques and applications for sentiment analysis. Communications of the ACM, 56(4), 82-89.

                                                          Printed by Wolfram Mathematica Student Edition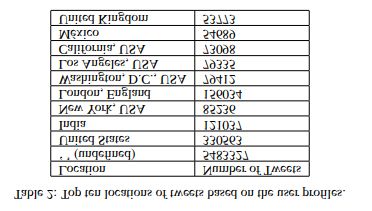
6   Project 3.nb

[15]Grefenstette, G. (1999). Tokenization. In Syntactic Wordclass Tagging (pp. 117-133). Springer, Dordrecht.

Appendix
While this article had potential to be an interesting study investigating twitter trends, potential turns out to be all it had. One of the major issues
with this study is the lack of direction. The authors do not have a clearly stated purpose for this study which leads to inconclusive results. There
are many corrections with the presentation of this work that must be made to make it appealing and informative to the intended audience.

To start, the abstract does not include what the purpose of this experimental study was or what the authors were hoping to find. The authors
seem to have an stated there intended audience, but do not direct their research in a way that would be beneficial for their intended audience.
Instead, the authors do not declare what they are hoping to get from this study and end up with no real conclusion because they did not have
clearly stated expectations to begin with. Typically, the abstract should be used to grab the attention of the intended audience. The authors need
to understand why their research would be helpful for the intended audience and how they can direct to make it intriguing for their audience. In
the abstract, there is a large focus on the background information and no results or conclusion given. The authors also include descriptive
statistics as a way of describing the tweets related to COVID-19, however they fail to actually do so in the report. Since the abstract is used as a
synopsis of the study, a brief explanation of how the results will help the authors come to a definitive conclusion regarding the topic of interest
is necessary.

The introduction was used to give background information regarding twitter activity and COVID-19. The background information should be
given to provide the reader a better understanding of why the researchers are conducting this experiment. However, the authors fail to discuss
their own topic of interest and therefore lead it up to the readers own interpretation of study. The authors mention twitter is deemed by 1/3 of
people to be the most important source of scientific information and news. It would have been helpful for the authors to describe the sample of
people that were asked this question. For example, where are these people from and what are they do they do for a living, and what was their
access to news as opposed to social media. Also, what do the authors classify as scientific information; is it regarding any scientific news
related to COVID or do these people mean for other scientific news such as experiments and discoveries. The authors then describe how there
is misinformation about health issues which can trend on twitter and they claim there is an urgency in monitoring social media content related
to COVID-19. It would be nice if the authors included who their intended audience was for this research. Even though the authors give a list of
what the data they will present could be used for, they do not specifically state what they intend to do with their results. The authors state that
they have made their source code available to use, however, it is highly disorganized as the source code is just a compilation of numbers in text
files with no description. Lastly, I am interested as to why only 3 words related to COVID-19 were queried. It would be helpful if the authors
described why they only selected these words (“coronavirus”, “covid” and “mask” and what criteria they used for the selection of these words.

The methods, results, and conclusion were not organized in accordance with the expectations of the publisher. The methods and results were
separated, however, the author's failed to provide a conclusion. This seems appropriate as how could they make a conclusion with a problem
statement or purpose for their presented research. The method section was missing major elements that are typically provided in published
articles. The authors failed to explain the point of this research. They provided a procedure as to how they got their results, but failed to further
state what they learned from their results or how they plan to continue. Without giving a reason as to why they are interested in this work, how
can they expect their audience to be intrigued. The author states an average user posts 3 times on average. This statement is confusing. What
does the author consider to be an average user; how do they classify an average user from a non-average user. Also, they fail to state how these
tweets are posted; whether it be daily, weekly, or all of the time; the authors must clarify what an average of 3 tweets mean. I believe it is
important for the author to use descriptive statistics and a histogram ,at the minimum, to characterize the data set. Intuitively, it seems the the
distribution of tweets per person is likely to be highly skewed. Based on free-time, career, and other factors, there will be a large variation in the
frequency of tweets by the average person. It would be helpful to see a histogram as a visual tool for the distribution of tweets per person
tweeting. The authors do give a reference when describing how Netlytic was used for collecting tweets, however I believe they should go into
more detail regarding API's. Again, the authors claim to have released their data set (a list of tweet ID's that can be used to retrieve the full
tweet) but I believe they should use a figure to show how an API call can be used to retrieve the tweet. Additionally, the tweet ID's supplied by
the authors is not organized. It is important for the experiment to be reproducible and in this scenario, with just lists of tweet Id's it is very
difficult for other researchers to reproduce the results. As the authors continue, they fail to go into further detail regarding tools that they used.

                                                         Printed by Wolfram Mathematica Student Edition
Project 3.nb 7
They also give alternative tools to hydrate tweets. This is a good idea however, I believe they should explain each tool in a little more detail and
potential state which tool is optimal for different members of their audience. As the authors move into their preprocessing section, there are a
few topics that need further explanation. There must be an explanation or examples given for what stopping words were "filtered out". Addition-
ally, the authors fail to describe text tokenization and Latent Dirichlet Allocation which is their main topic clustering technique. Additionally,
sentiment analysis is an objective term; how do these authors classify sentiment analysis and what do they hope to gain from analyzing
sentiment in this setting. The authors remove extraneous terms from their derived topic models to generate clearer topic modeling results. It
would be helpful for the reader to understand why these words led to unclear and how these words affected topic modeling.
When summarizing the data, the authors provide the results, and use tables and figures for comparison. The authors start by summarizing the
top 10 languages, the frequency of associated tweets, and the percentage of each language in the data set. The authors state this table is
important to interpret because the keywords use for querying were in English, however other languages were found using the same keywords.
Depending on what the author is trying to study, this could have a positive or negative effect on the skewness of the sample. However, the
author fails to explain why this table is included and what it is used for. The authors have to decide in which direction they want to proceed
with this data. I believe the inclusion of this chart is important, but if the author is interested in only accounting for tweets in English, they must
state so explicitly. If they care to include it, which I believe they should as it shows the keywords are used amongst multiple cultural back-
grounds, they should compare the percentage of tweets with the percentage of languages used. If the author only wants to include English
tweets, then the addition of multiple languages in the sample set effects the generalizability of the findings. Since there are different cultural
backgrounds for each of these languages, the authors must consider the effect on the number of tweets. The authors also calculate the fre-
quency of tweets related to COVID-19 per day the authors present this information and fail to elaborate why it was presented. Table 2 is used to
demonstrate the top 10 locations of tweets, however the locations vary by cities, states and countries. If the location (or region) of which these
tweets are taken are not constricted to a certain size, then there is no surprise there are more tweets in the entire United States as opposed to
New York or Los Angeles alone. One important comment I could make about table 2 is the undefined location. The undefined location means
the authors are unsure where the data comes from. If this table is necessary, it seems counteractive to demonstrate that the majority of tweets
are from an unknown location. Additionally, the authors fail to even use the information to come to a conclusion; it seems that this information
is essentially useless. It may be useful to generate a Pareto Curve to visualize the information the authors have placed in these tables. The
Pareto curve can be useful when analyzing frequencies of different defects and can be particularly useful in quality control[12]. In the case of
the experimental study presented. It would be helpful to create a Pareto curve for the % of population vs. the % of tweets instead of presenting
the data in the table as is done.
As the authors continue with the description of their results, they face some issues of objectivity. The authors state there is some similarity with
the distribution of tweets to the US population, however, they do not present any method for comparison or data that would allow one to come
to such conclusion. It would have been more effective to present a chart comparing the US population per state as compared to the percentage
of tweets per state. Additionally, "some" is an objective term that the authors do not quantify, therefore it is up to the reader to assume how
correlated the frequency of tweets are in comparison to the US population. While the frequency of tweets based on location is clearly demon-
strated in Figures 1 & 2, there seems to be no reason as to why this was significant. The authors continued to say they conducted a frequency by
time analysis but fail to explain what this is or what it is used to demonstrate. It should be clearly stated what they hope to gain from implement-
ing this technique. Another phrase the authors failed to define was sentiment. A brief description was added about sentiment analysis since the
authors did not include an explanation, however it is unclear how the authors planned on using sentiment and what their expectations were.
Additionally, the authors used subjective categories (Neutral, Positive, Negative) without a clear explanation regarding the criteria of which the
sentiment of the tweets were based on. The authors were able to demonstrate there was a smaller gap between positive and negative tweets,
meaning either the number of positive tweets decreased or the number of negative tweets increase, during the time the pandemic became
prominent. It would helpful for the authors to make this conclusion instead of leaving it up to the interpretation of the reader. The authors used
topic modeling to estimate the most representative words in each topic. Table 3 compiles the results found based on this method. The authors
fail to define topic modeling and do not conclude why it would be useful in this context. Additionally, the authors did not clearly define what a
topic is or how it was selected, instead they stated 3 topics were selected. In order to understand the data in Table 3, the topic criteria must be
clearly stated which the authors failed to do. The 20% of the tweets in the entire data set that were selected and trained with an LDA model
must have selected in a particular manner. However the methodology was created for selecting these tweets, whether it be random sampling or
another technique, should be included in the authors report. Lastly, the authors state that implementing stop words is not enough to solve the
Printed by Wolfram Mathematica Student Edition8 Project 3.nb
issues of stop words being from different languages, but they do not explain why. In their last claim, the authors present an argument, but do not
provide an alternative solution. They also do not include how they would proceed with their study to account for these issues.
Overall, this paper is not fit for publication unless the stated criteria is met and the issues are fixed. Another issue is regarding the Title. The
authors fail to describe what CML means. I believe they can generate a more informative title that can be direct about their specifc research.
Additionally, the authors must present a conclusion where they relate their objective and draw connections between the analysis and objective,
They must address their key findings and talk about possible limitations, but then also address in future research to better investigate the
research question.
Printed by Wolfram Mathematica Student EditionYou can also read