East Greenbush Central School District K-5 Attendance Zone Study - BoardDocs
←
→
Page content transcription
If your browser does not render page correctly, please read the page content below
East Greenbush Central School District

     K-5 Attendance Zone Study

                  Presented to the

       East Greenbush Central School District
                Board of Education

                        by

                Dr. Jerome D. Steele
                 Mr. Lee Bordick

                December 11, 2019
ii

                                       Acknowledgements
On behalf of Lee Bordick and myself, I would like to thank the following individuals who
assisted in developing this study and final report:

       Mr. Jeffrey P. Simons, Superintendent of Schools

       Mr. Lawrence Edson, Assistant Superintendent for Business

       Mr. Martin Mahar, Principal of Bell Top Elementary

       Mr. Wayne Grignon, Principal of Citizen Genet Elementary

       Mr. John Alvey, Principal of Donald P. Sutherland Elementary

       Mr. Daniel Garab, Principal of Green Meadow Elementary

       Mrs. Helen Squillace, Principal of Red Mill Elementary

       Ms. Mary Ann Belmont, Director of Transportation

       Mr. Wayne Pratt, Chair of the Budget Review and Advisory Committee and all the

       members of the BRAC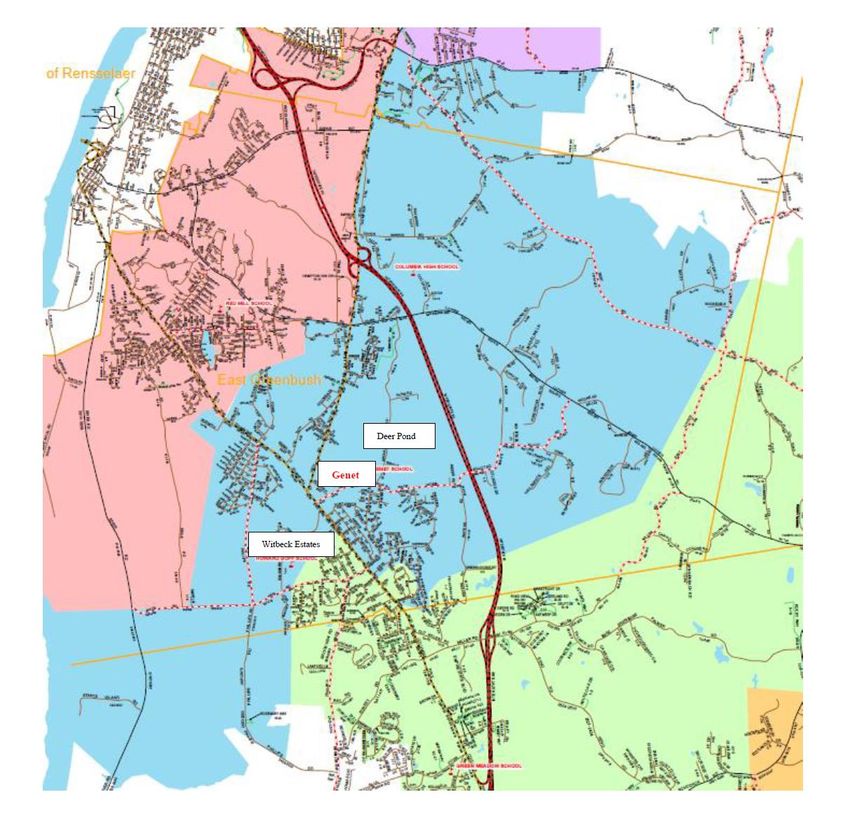
iii

                                         Table of Contents
Introduction                                                        1
District Demographics                                               1
Number of Households                                                1
Median and average income                                           1
Houses building in East Greenbush School District                   1
Purpose of this study                                               2
Methodology                                                         2
Enrollment History, Projects, and Current Data                      3
Enrollment implications                                             7
Residential and growth in the district                              8
Impact on elementary schools                                       11
Commercial growth in the district                                  15
Regeneron and Amazon                                               15
Sales of existing homes                                            16
Count Me In Campaign                                               16
Recommendations for consideration                                  18
References                                                         28

Charts
Chart 1 – Enrollment history, projections, and current data         3
Chart 2 – Enrollment by grade level                                 4
Chart 3 – BEDS data for EGCSD elementary schools                    6
Chart 4 – Average number of children from new and existing homes    8
Chart 5 – North Greenbush residential projects                      9
Chart 6 – East Greenbush residential projects                      10
Chart 7 – North Greenbush commercial projects                      15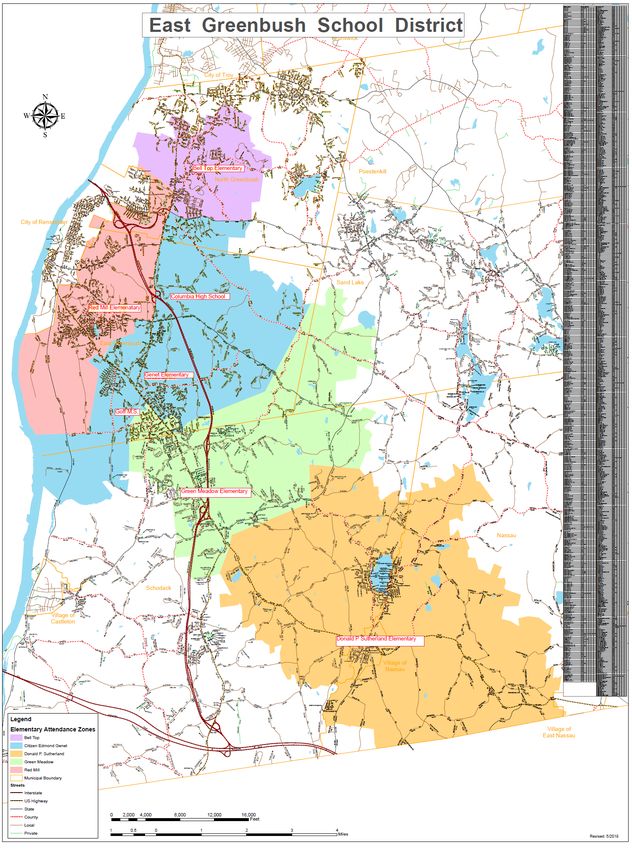
iv

Maps
Map 1 – Bell Top Attendance Zone                                     11
Map 2 – Red Mill Attendance Zone                                     13
Map 3 – Citizen Genet Attendance Zone                                14

Tables
Table 1 – CDRPC enrollment projections for EGCSD                      5
Table 2 – Aggregate enrollment projections by grade level             5
Table 3 – Total Count Me In data as of October 21, 2019              17
Table 4 – New students by school and class year                      17
Table 5 – Total students in the Count Me In system                   18

Appendices
Appendix A – Map of the East Greenbush Central School District       20
Appendix B – Niskayuna CSD Flexible Attendance Zone Policy           21
Appendix C – Niskayuna Flexible Attendance Zone Guide for Families   22
Appendix D – Shenendehowa CSD Flexible Attendance Zone Policy        24
Appendix E – South Glens Falls CSD Flexible Attendance Zone Policy   26

1

Introduction
       The East Greenbush Central School District located in Rensselaer County, New York -
serves students from the towns of East Greenbush, North Greenbush, Nassau, and Schodack.
The current enrollment for the 2019-2020 school year as of BEDS day is 4086 students. The
district has 5 elementary schools: Bell Top, Donald P. Sutherland, Citizen Genet, Green
Meadow, and Red Mill. There is one middle school, Howard Goff, one high school, Columbia.
The district covers approximately 75.6 square miles.
       The following is a snapshot of the demographics of the district:
District Demographics:
   •   Total Population:                    32,775
           o Male:                          16,097
           o Female:                        16,667
Number of Households:
   •   Total Households:                    13,546
   •   Average People per household:        2
   •   Family Households:                   8,443
   •   Non-family Households:               5,103
   •   Households with children:            3,798
   •   Households without children:         9,748
Median and Average Income
   •   Average Household Income:            $92,511.83
   •   Median Household Income:             $81,992.00
   •   People below poverty level:              2,298
   •   People above poverty level:              29,841
Houses built in East Greenbush School District
   •   Built between 1970 and 1979          1,489
   •   Built between 1980 and 1989          1,578
   •   Built between 1990 and 1999          1,539
   •   Built between 2000 and 2009          1,910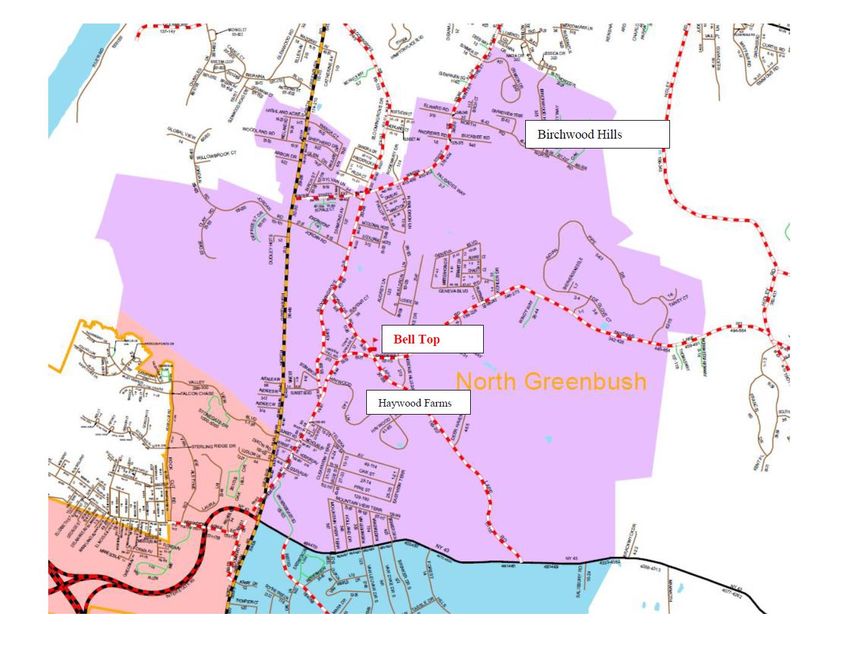
2

    •    Built between 2010 or later                  466
(This data was retrieved from the Point2homes.com website: (https://www.point2homes.com/US/Neighborhood/NY/Rensselaer-
County/East-Greenbush-Central-School-District-Demographics.html#Population)

Purpose of this study
         Consideration of redistricting or redrawing attendance zones for the elementary schools is
not new for the East Greenbush School District. During the 2003-04 school year, as a result of
increased growth within the district and with enrollment over 4600 students, the BRAC
committee developed a plan to redraw attendance zone lines to balance enrollments for each of
the elementary schools. This plan satisfied the needs of the district for a period of time, but
enrollment started to decline after that school year.
         Currently, as residential and commercial development has increased within the East
Greenbush School District, the Capital Area School Development Association (CASDA) was
contacted to conduct a study to explore the extent to which this growth within the district would
have an impact on enrollment, especially at the elementary school level. The following research
questions have guided this study:
    1. What is the impact of projected enrollments on the current capacity of the five elementary
         schools?
    2. What is the impact of current and proposed construction projects being conducted within
         the towns that constitute the East Greenbush Central School District?
    3. What policy changes should be considered by the East Greenbush Central School District
         regarding elementary school attendance zones affected by growth within the district?
This study is not designed to disrupt families currently residing with the district and who have
children currently enrolled in any of the elementary schools. Based on the recommendations of
this report, only families who do not currently have children in any elementary school within the
district may be affected by these recommendations.

Methodology
         Data collected for the study were from a review of current and proposed construction
within in of the town composing the district. Enrollment data were collected from existing
projections created by the Capital District Regional Planning Commission as well as from
3

current enrollment number from the Basic Educational Data Survey (BEDS). BEDS enrollment
data are collected annually from each school district by the New York State Education
Department (NYSED). The BEDS data were collected for this report on October 2, 2019.
Additionally, interviews were conducted with each of the elementary principals in the district to
determine the capacity of each building for anticipated future enrollment increases. Both Mr.
Bordick and Dr. Steele met with Director of Transportation, Mary Ann Belmont and Berkshire
Hathaway Relator, Karen Westman. Mr. Bordick and Dr. Steele also attended the Budget
Review Advisory Committee (BRAC) meetings at which representatives from the towns of East
Greenbush, North Greenbush, and Schodack discussed current and proposed commercial and
residential construction within the district.

Enrollment History, Projections, and Current Data
        The enrollment of the district experienced significant growth during the decades of the
1980s and 1990s. In the past twenty years, the largest enrollment was 4632 during the 1999-2000
school year. Since 2000, enrollment has declined by almost 600 students. Chart 1 indicates total
enrollment by grade for the past twenty years.
Chart 1
Enrollment history 1999-2019

                             East Greenbush Historical Enrollment
 4800                                    1999-2019
 4600   4632               4629
               4559 4532          4570 4557 4548 4541 4555
                                                             4484 4482
 4400
                                                                         4343
                                                                                4291
 4200                                                                                  4184 4155
                                                                                                   4087          4076          4083
 4000                                                                                                     4006          4034

 3800

 3600

(Capital District Regional Planning Commission 2018-2019 Enrollment Study)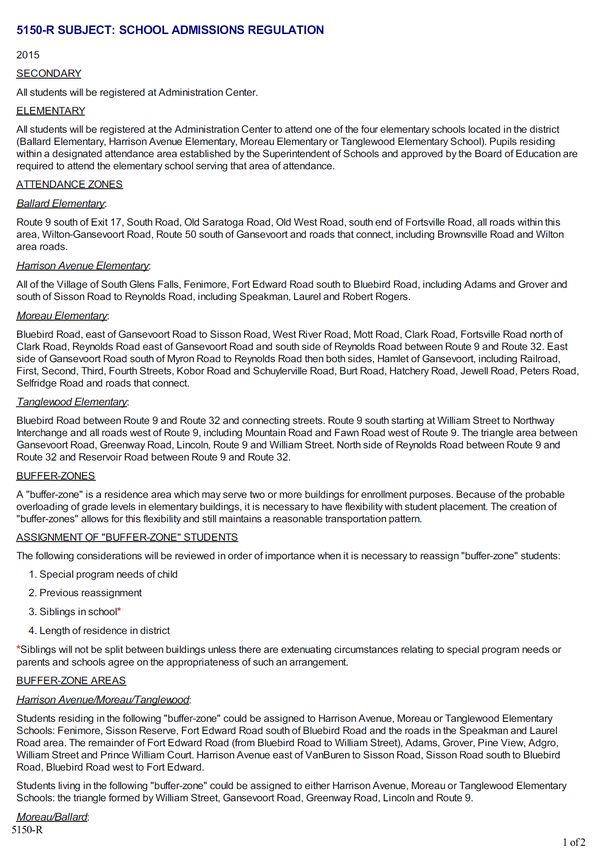
4

Chart 2 indicates total school enrollment by grade level for the same time period.

Chart 2
Enrollment by grade level

                     AGGREGATE ENROLLMENT 1999-2019
                               K-5       6-8       9-12       Ungraded       Total

        5000

        4000

        3000

        2000

        1000

            0

(Capital District Regional Planning Commission 2018-2019 Enrollment Study)

        As Chart 2 indicates, during the early 2000s K-5 enrollment was above 2000 students for
the 1999-00, 2000-01, and 2002-03 school years. By the beginning of the next decade, K-5
enrollment dropped below 1900 students and has remained fairly constant with a current
enrollment of 1841 students at this level.
        The Capital District Regional Planning Commission (CDRPC) has conducted enrollment
studies for the East Greenbush School District for the past few years. The CDRPC used the
cohort survival methodology for making projections of future enrollment. A cohort survival
methodology relies on ten to twenty years of data as well as annual birth rates to create a survival
ratio to predict enrollment from one grade to the next, i.e. kindergarten to first grade, first grade
to second grade. Table 1 is adapted from the CDRPCs 2018-19 study. It indicates projections
through the 2023-24 school year. Inserted next to the projection for 2019-2020 is the actual
enrollment for the current year based upon the BEDs data collected on October 2, 2019.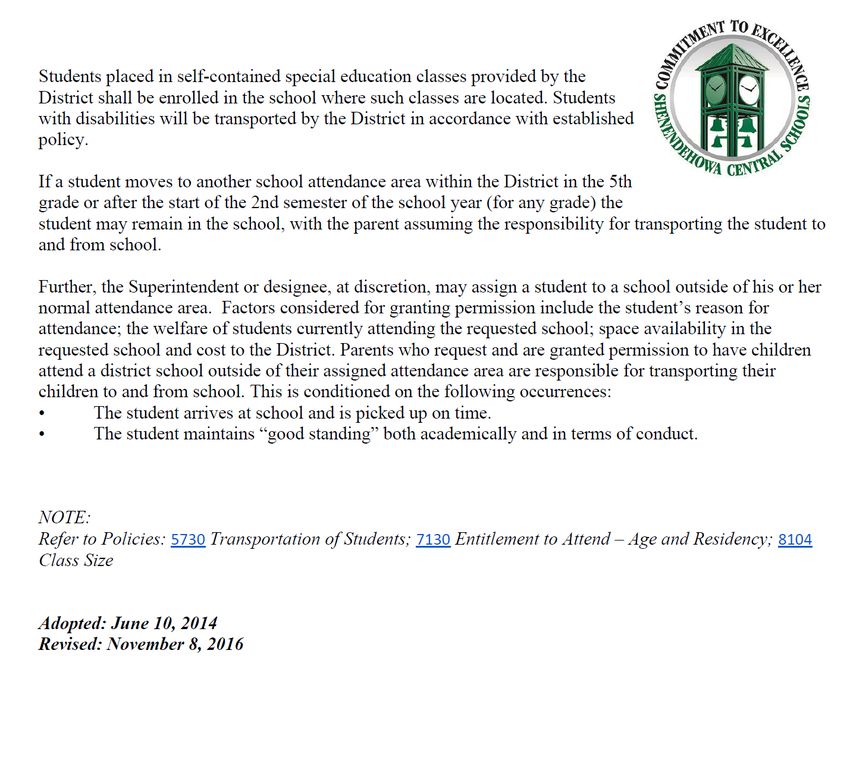
5

Table 1
CDRPC Enrollment Projections for EGCSD
                                              Actual
                                              (BEDS)
                             Projected       10/2/19
   Grade        2018-19       2019-20        2019-20       2020-21       2021-22       2022-23   2023-24
     K            293           318             312          319           359           326       332
     1            289           296             290          321           322           363       329
     2            335           293             284          300           326           327       368
     3            309           341             343          298           305           332       333
     4            302           308             309          340           297           304       331
     5            318           309             303          315           348           304       311
     6            316           319             326          310           316           349       305
     7            298           317             319          320           311           317       350
     8            308           299             289          318           321           312       318
     9            344           322             338          313           333           336       327
    10            348           332             335          311           303           322       325
    11            300           339             338          324           303           295       314
    12            323           300             300          339           324           303       295
   Total         4083          4093            4086         4128          4168          4190      4238
(Adapted from the Capital District Regional Planning Commission 2018-2019 Enrollment Study)

Another way to consider this data is to aggregate the enrollment numbers by grade level. Table 2
shows the same data for K-5, 6-8, and 9-12.

Table 2
Aggregate enrollment projections by grade level
                                             Actual
                             Projected       (BEDS)
   Grades       2018-19       2019-20        2019-20       2020-21       2021-22       2022-23   2023-24
     K-5          1846          1865          1841           1893          1957          1956     2004
     6-8           922           935           934           948           948           978      973
    9-12          1315          1293          1311           1287          1263          1256     1261
    Total         4083          4093          4086           4128          4168          4190     4238
(Adapted from the Capital District Regional Planning Commission 2018-2019 Enrollment Study)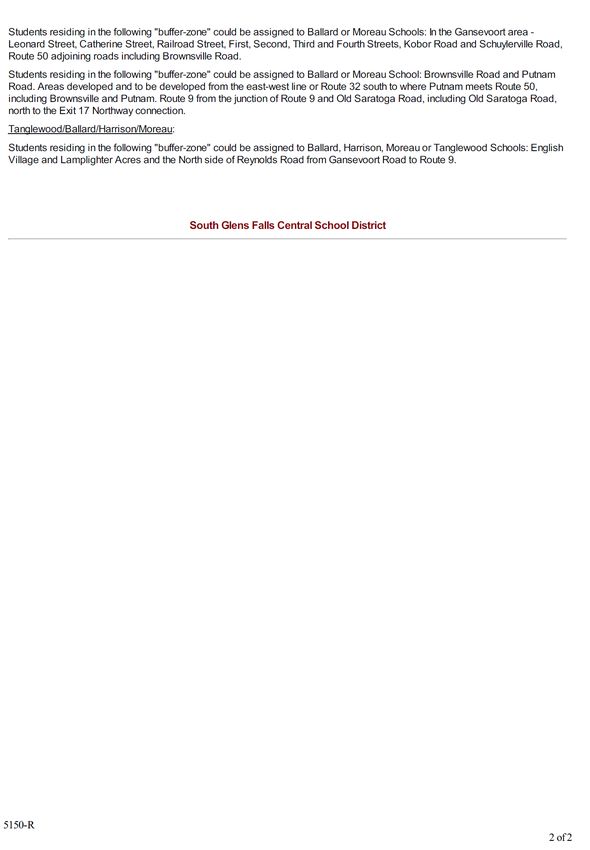
6

       Each year the New York State Education Department collects enrollment data from each
school district in the state. This usually occurs the first week of October. This data was
collected for the district on October 2, 2019. Chart 3 indicates the current enrollment by sections
for each of the elementary schools. Each elementary school also serves students with special
needs and classroom space is provided. However, many special needs students are
mainstreamed in general education classrooms. The numbers in Chart 3 do not necessarily
reflect the total number of students in each class section.
Chart 3
BEDS data for EGCSD Elementary Schools
7
Enrollment implications
Given the enrollment projections provided by CDRPC and considering the current
capacity of each of the elementary schools, the five elementary schools will need to absorb and
additional 163 students by 2023-2024. If these students were distributed across all 88 sections, it
would average out to almost 2 students per section. Historically, this is not necessarily a
problem as elementary school enrollment was over 2000 students twenty years ago. However,
since that time as enrollment has declined each of the elementary schools have taken advantage
of available space to meet the changing needs of their students. This is reflected in rooms being
utilized for Speech and Language, Occupational and Physical Therapy, and computer
technology.
According to the East Greenbush Teachers' Association contract, Article VII., Teaching
Conditions, Subsection A.1 Class Size/Load states that “Class size shall be no larger than the
following: Kindergarten, 25 students, and grades 1-5, 27 students, and grades 6-8, 28 students,
and grades 9-12, 30 students.” Currently, the data in Chart 3, which is as of October 2, 2019
indicates that no class is above the guidelines set for the teachers’ contract. Average size is 20.2
students per class. As the district considers the implications of potential increases in enrollment,
it must also consider the current capacity of each elementary school and its ability to
accommodate new students at every grade level.
Although some classrooms are currently utilized by Questar BOCES, four of these
classrooms at Red Mill Elementary are being returned to the district as these classes will be
moved to another school district next year. This will provide further flexibility for the district to
absorb new students at the elementary level.
These implications are based upon the projections provided by the CDRPC study and
current data from the district as reflected in the BEDS report as of October 2, 2019. What is not
taken into consideration is the current growth within each of the towns that comprise the East
Greenbush School District. The next section highlights current and proposed residential and
commercial growth within the district and its implications for enrollment and current attendance
zones.8
Residential Growth in the District
Most new construction has been taking place in the towns of East Greenbush and North
Greenbush. The three elementary schools most affected by this construction are Bell Top, Red
Mill and Genet. As these construction projects are completed the district will need to determine
the number of students potentially enrolling from these various communities. The National
Association of Home Builders (NAHB) in many cases are required to prepare impact statements
estimating the number of students from new construction. In a recent report developed by
NAHB’s HousingEcomonics.com an analysis was conducted to determine the number of
children from a wide variety of housing units. These included single-family detached, single-
family attached, manufactured housing, and multifamily. This was further disaggregated to
consider the difference between owner-occupied units versus renter occupied units as well as for
new construction versus existing construction. The NAHB calculated the numbers indicated in
Chart 4 using the U.S. Census Bureau’s 2015 American Community Survey.
Chart 4
Average number of children in new and existing construction by residential development per 100
units
(From HousingEconomics.com study by Carmel Ford, NAHB)
Chart 4 indicates the comparison for the number of children from new and existing
construction. For example, from new single-family detached homes the district could expect9
61.5 children for every 100 units. From existing construction, in the same category, the district
could expect 62.4 children for every 100 units. As the district considers how to estimate the
number of children coming from new construction as it continues to grow, this study used these
calculations to understand the potential impact on the elementary schools affected.
Chart 5
North Greenbush Residential Projects
Project Location Number of Status Elem. Potential Current
Name units School # of # of
Students Students
MJSR “The Mammoth 14 Lot Major Pending Bell Top 9 0
Gables Springs/Morner Rd. Subdivision
Noel Mammoth 4 Lot Minor Approved Bell Top 2 0
Springs/Morner Rd. Subdivision
Reynolds Farm Synders Lake Rd. 3 Lot Minor Approved Bell Top 2 0
Subdivision
Greenbush North/Buckbee Rd. 14 Lot Major Approved Bell Top 9 0
Estates Subdivision
Van Allen Washington 244 Units Almost Red Mill 53 4
Apartments Avenue/California Complete
Ave.
Haywood Farms Snyders Lake Rd. 68 single family Almost Bell Top 41 23
homes full
buildout
Birchwood Hills North Road 61 single family Almost Bell Top 38 9
homes full
buildout
Berkley Estates Morner Road 31 Lot Approved 19
subdivision; 5 2015, No
lots done activity
Forest Hill Route 43 Continued
Estates development
Kohler South Waldron Lane 3 Lot Minor Lots for 2 0
subdivision sale
At the April, September and October meeting of the BRAC, representatives from the
towns of East Greenbush, North Greenbush and Schodack provided an update regarding
residential and commercial development. One of the most important pieces of data regarding10
new residential construction is the potential number of students that the district should anticipate
from these various projects. The data from Chart 4 above was used to calculate the number of
potential students in Charts 5, 6 and 7.
As indicated in the chart in Chart 5 on page 9 and Chart 6 below, these projects are in
various stages of completion or are still pending approval. The rows highlighted in blue are
almost complete or in various stages of completion.
Chart 6
East Greenbush Residential Projects
Project Location Number of Status Elem. Potential Current
Name units School # of # of
Students Students
Rysedorph Olcott Lane 26 single family Almost Red Mill 16 2
Subdivision homes complete
Witbeck Cluster Phillips Road 54 single family Substantially Citizen 33 0
Subdivision homes complete Genet
Deer Pond Off Elliot 60 single family Conditional Citizen 40 0
Estates Road homes approval – Genet
not started
Town Center Columbia 300 Apartments Application Citizen 0
Planned Turnpike 50% 1 bedroom Under Genet 10
Development 50% 2 bedrooms Review 33
District
Amedore Senior Newkirk 93 Units Application 0 0
Housing Road under
review
Pheasant 2670 Phillips 9 single family Application Citizen 6 0
Hollow Road homes under Genet
review
Carver Court Upper Mannix 110 single Application Citizen 68 0
Road family homes under Genet
review
Witbeck Corner of 36 single family Application Red Mill 22 0
Hampton Manor Summit and homes under
Madison review
Avenue East
McCullough 250 136 single Application Red Mill 84 0
Place McCullough family homes under
Place review11
Impact on elementary schools
Map 1
Bell Top Attendance Zone
The projects that are currently affecting these schools include Greenbush Estates and
Haywood Farms in North Greenbush for a potential of 50 students for Bell Top; the Rysedorph
subdivision on Olcott Lane and Van Allen Apartments off Washington Avenue for a potential of
59 students for Red Mill; and the Witbeck Cluster on Phillips Road for 33 students for Genet and
Deer Pond Estates off of Elliot Road where construction has not begun, but could represent 4012
new students for Genet Elementary. As four of these projects are almost complete, many of
these students may already be enrolled.
Map 1 indicates the current Bell Top attendance zone which indicates two of the major
new residential construction sites; Birchwood Hills and Haywood Farms. Both of these
communities are almost complete and could potentially provide an additional 79 students.
Currently 23 students are coming from the Haywood Farms development and 9 students from the
Birchwood Hills development. Five students are enrolled from Birch Court.
Map 2 on page 13 is the current attendance zone for Red Mill Elementary which indicates
one major new residential construction site on Olcott Lane off Red Mill Road. This development
calls for 26 single family homes with the potential of 16 students.
Map 3 on page 14 is the current attendance zone for Citizen Genet Elementary which
indicates two major new residential construction sites. Witbeck Estates off Phillips Road has 4
homes with certificates of occupancy and 12 more are almost complete. A total of 54 homes are
planned on the site with a potential for 33 students. Currently, there are no students from the
Witbeck Estates attending Genet Elementary. The second development is Deer Pond off Elliot
Road which is designated to have 60 single family homes. There is a potential for 40 students
from this neighborhood.13 Map 2 Red Mill Elementary Attendance Zone
14

Map 3
Citizen Genet Attendance Zone
15

Commercial growth in the district
Chart 7
North Greenbush Commercial Projects

 Project Name            Location                      Size/No. of        Status
                                                       units
 Van Rensselaer Sq.      North side of Rt. 43          252,000 sq. ft.    Almost complete
 Tech Valley Plaza       South side of Rt. 43          193,000 sq. ft.    No current activity
 Quackenderry            Route 4                       240,000 sq. ft.    No current activity
 Commons
 Agway Drive             Route 4                       4 commercial       No plans submitted
 Commercial                                            lots
 Subdivision
 Urgent Care Facility    573 North Greenbush Rd.                          Approved
 Revised Site Plan       315 North Greenbush Rd.                          Approved
 Bank
 Food Service            480 North Greenbush Rd.                          Approved for
 Distribution                                                             commercial
                                                                          occupancy
 Medical Building        604 Bloomingrove Dr.          40,000 sq. ft.     Pending
 Car Wash and            531 North Greenbush Rd.                          Approved for Car
 Commercial                                                               Wash
 development of
 existing building
 Commercial Building     422-424 North Greenbush       Revised Site –     Pending
                         Rd.                           Add Building
 Route 4 Improvement                                                      Planned for
 Project                                                                  winter/spring 2020

Regeneron and Amazon

       At the September 16th meeting of the BRAC committee, Schodack Town Supervisor
Harris discussed the building of the Amazon Distribution Center on along Route 9 in the town.
He indicated that this is a 1.3 million square feet facility. Once completed, Amazon is expected
to hire 800-1000 people, which could spur residential development in the town.
       The other large commercial property currently under construction is the Regeneron
facility on Temple Lane. Once completed, Regeneron is expected to hire between 1000 to 1500
new employees.
16
This could have a major impact on the school district 3-5 years in the future and must be
continuously monitored.
Sales of existing homes within the district
According to Karen Westman of Berkshire-Hathaway Realtors, there is little to no
current inventory of existing homes within the district. If a home comes on the market, it is sold
quickly. For example, the average number of days on the market for a home over $300,000 is
31. If a home is priced below $300,000 it is on the market an average of 11 days. From January
1, 2019 through November 18, 2019, 387 existing homes were purchased within the district. For
the same period of time, 52 new homes have been purchased or are under contract. As a further
example of this phenomenon, I interviewed a person who had recently put his home on the
market within the district and it sold in one day.
Count me in campaign
Launched on September 12, 2019, the Count Me In Campaign created a district website
and circulated fliers to account for children from existing families in the district not yet enrolled
in school. According to the Count Me In overview,
Resident families with children ages birth to 5 were asked to submit a student
census form to the East Greenbush Central School District. The census form
includes the child’s name, birthdate, and address. The census information will help
the district plan for future enrollment for each school, determine class sizes,
appropriate classroom space and suitable room for all educational programs,
teacher and support staff levels and bus routing.
Families with preschool children may access this site at https://egcsd.org/countmein/.
The results of the most recent data collected are indicated in Table 3 below.17
Table 3
Total Count Me In data as of 10/21/19
Kindergarten Start Year Approximate Age Number of Students
2020-2021 4-5 years 21
2021-2022 3-4 years 26
2022-2023 2-3 years 19
2023-2024 1-2 years 30
2024-2025 Birth – 1 year 28
Total Birth-5 years 124
Table 4
New students by school and class year
Enter K Bell Citizen DPS Green Red Grand Total
Top Genet Meadow Mill
2020-21 1 3 2 6 9 21
2021-22 4 8 4 6 4 26
2022-23 3 5 4 1 6 19
2023-24 4 7 2 8 9 30
2024-25 5 4 5 5 9 28
Total 17 27 17 25 37 124
One of the most important aspects of this campaign is to have a continuous
mechanism for counting the number of preschool children residing in the district. As the
district continues to grow, it is imperative to have as much accurate data as possible. The
Count Me In campaign coupled with ongoing cohort survival methodology for projecting
future enrollment will be crucial.18
Table 5
Total students in the Count Me In system
Entering K Bell Citizen DPS Green Red Grand Total
Top Genet Meadow Mill
2020-21 35 33 26 45 57 196
2021-22 27 34 23 38 35 157
2022-23 11 22 18 17 24 92
2023-24 15 17 11 24 30 97
2024-25 7 9 5 7 12 40
Total 95 115 83 131 158 582
Recommendations for consideration
There are a number of factors that the district must consider as district enrollment begins
an upward trajectory. First is the new residential construction in process specifically in the towns
of East Greenbush and North Greenbush. Secondly, the sale of existing homes (not new
construction) is ongoing. Realtors do not have any inventory. Existing homes sell quickly once
they come on the market. Thirdly is the impact of Regeneron and Amazon. This commercial
development potentially could bring new families into the district.
Recommendations
1. For the short term, create a formal policy to address enrollment growth in order to
balance class size among the elementary schools. Other districts experiencing the same
issues have created flexible attendance zones to address this issue. (See Appendix B, C,
and D.) Given the nature of new residential construction within the district, these zones
would border each of the elementary schools.
2. The district has continued to monitor enrollment through the Cohort Survival studies
provided by the Capital District Regional Planning Commission. Their enrollment
projections are within the margin of error and are fairly accurate. These studies coupled19 with the Count Me In campaign provide an ongoing mechanism for collecting data to inform future planning. Both should continue. 3. Work with local real estate agencies to monitor the sale of existing homes. As mentioned earlier, once an existing home goes on the market it sells quickly in the district. If the district decides to formalize flexible attendance zones, real estate agents should be made aware of this information. Also, agents should be aware of the Count Me In campaign so that new families could provide this census data to the district. 4. As enrollment has declined over the past fifteen years, each of the elementary schools has utilized available space in a variety of ways including but not limited, music rooms, art rooms, computer labs, as well as rooms for occupational and physical therapy. Bell Top has gain space with the CTEP program moving to Genet elementary. Red Mill elementary school will gain space as a number of BOCES classes will move out of the district next year. An inventory of available space should be done as soon as possible again for future planning purposes. If the district was ever to consider a building project to address increasing enrollment, it would need to justify the need. 5. The Budget Review Advisory Committee (BRAC) has monitored these issues over the years. The BRAC should continue it role in monitoring these issues for the district.
20

Appendix A
21
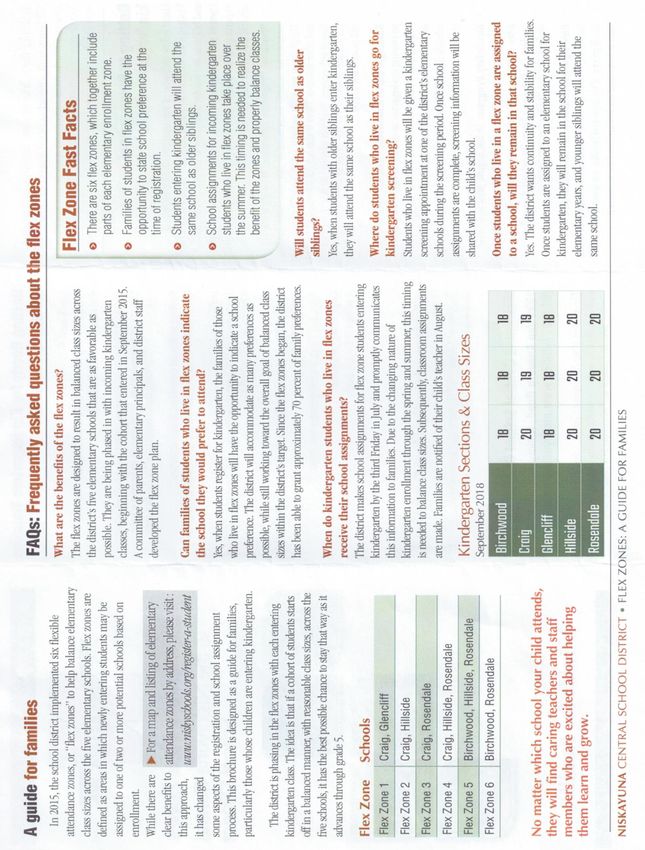
Appendix B
Neighborhood Elementary Schools
The Niskayuna Central School District shall maintain its elementary schools as neighbor schools
with attendance zones for each school, as defined in this policy. Changes in the boundaries of
the attendance shall be by resolution of the Board of Education at the recommendation of the
Superintendent of Schools.
At the recommendation of the superintendent, the board shall by resolution establish flexible
attendance zones to facilitate the management of class sizes and promote class size balance by
grade level across the district.
Definitions:
Regular attendance zone
A regular attendance zone is the geographic area of an elementary school to which students are
assigned based on their residency within the zone, such zones being the attendance zones in
existence prior to the adoption of this policy.
Dedicated attendance zone
In keeping with the concept of neighborhood schools, a dedicated attendance zone is the
geographic area for an elementary school to which students are assigned based on their residency
within the zone, such zones being the dedicated attendance zones established after the date of the
adoption of this policy.
Flexible attendance zone
A flexible attendance zone (also referred to as a “flex zone”) is a geographic area situated along
the boundaries of regular attendance zones, in which newly enrolled students may be assigned to
one of two or more designated schools.
REGULATIONS
The superintendent shall establish regulations under which procedures for assignment of students
in dedicated attendance zones and in flexible attendance zones shall be implemented, monitored
and adjusted as needed.
Such regulations may provide for a phase-in period, a voluntary transfer plan, and an enrollment
management plan to be utilized in addition to, and in conjunction with, the flexible attendance
zones for the assignment of newly enrolled students, in order to promote class size balance by
grade level across the district and optimum use of the district’s staff and facilities.
Niskayuna Board of Education Policy 5001 Adopted March 24, 201522 Appendix C
23
24

Appendix D
25
26

      Appendix E
South Glens Falls Policy
27
28

                                            References

Capital District Regional Planning Commission, Enrollment Study for the East Greenbush
       Central School District, 2018-2019
Ford, C., 2017, Only 41 children for every 100 housing units in the U.S., on average, Economics
       and Housing Policy, National Association of Home Builders.
Point2homes.com website: (https://www.point2homes.com/US/Neighborhood/NY?Rensselaer-
       County/East-Greenbush-Central-School-District-Demographics.html#Population)
You can also read