Counting Young Children in the 2020 Census The Role of Schools - Deborah Stein Partnership for America's Children www.foramericaschildren.org ...
←
→
Page content transcription
If your browser does not render page correctly, please read the page content below

Counting Young Children
  in the 2020 Census
  The Role of Schools
               Deborah Stein
      Partnership for America’s Children
        www.foramericaschildren.org
       Dstein@foramericaschildren.org
            www.countallkids.org
In A Nutshell…
• The number of young children missed in the Decennial census is
  large, growing, and the consequences are serious
• Young children are missed for different reasons than adults; we need
  to count young children differently than we count adults
• Advocates are working nationally, and in states and localities, to
  improve the count
• Schools can play a significant role in helping count young children

Being Counted Helps Young Children Thrive
• Stronger political representation: federal, state, county and school Board districts

• More funding for key kids programs: more complete Census data can increase funding for
  some programs (Medicaid, CHIP, foster care, child care)—states lost more than a half
  billion a year from just five programs

• More equitable distribution of funds: When total funding is capped, Census data often
  determines who gets it (Title 1, Special Ed, CCDBG, Head Start expansion funds)

• Better planning: school size, health facilities, private enterprise

• Better information on child well being: Census data provides 10 of 16 indicators used in
  yearly KIDS COUNT report
• Affects all Census data for a decade: Most of a young child’s childhood

                                                                                             3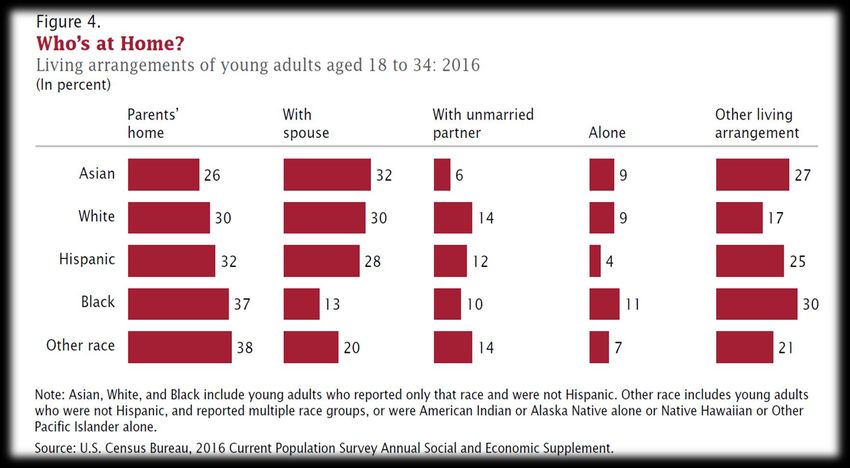
Census Undercount of Young Children
       Is Large and Growing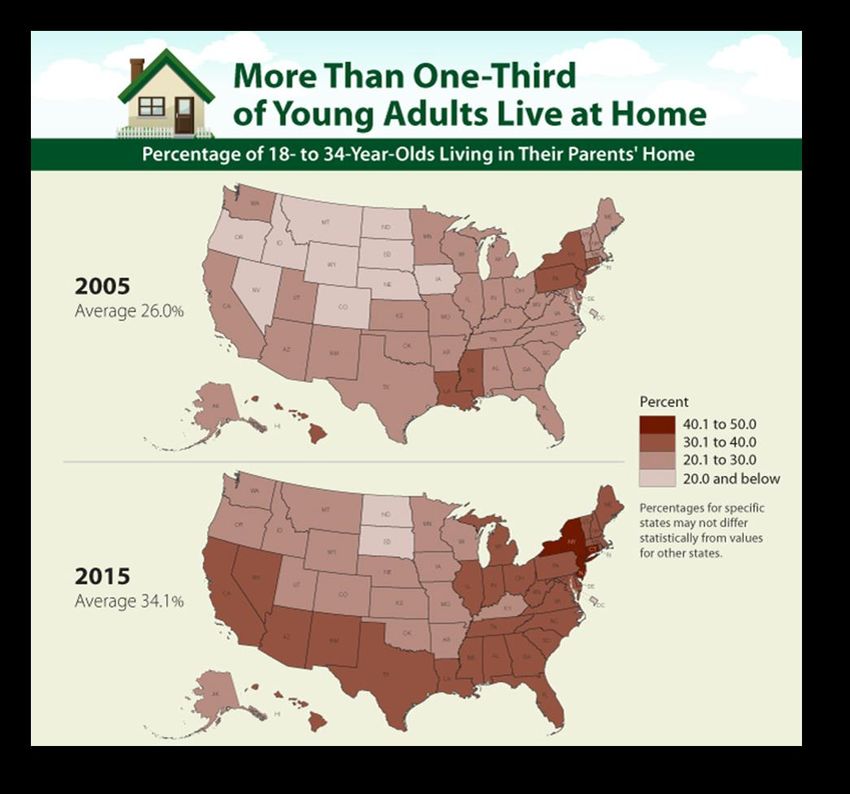
One in 10 Young Children were Missed
                in the 2010 Census
 Net Undercounts and Omissions       Net Undercounts and Omissions
Population Numbers for Age 0 to 4         Rates for Age 0 to 4
                       2,200,000
                                                          10.3%

     970,000                            4.6%

 Net Undercount       Omissions     Net Undercount       Omissions

                                                                           5
                                                      Source: Hogan and Griffin 2016
Young Children Had a Higher Net Undercount
                             (by far) Than Any Other Age Group in the 2010 Census

                      3.0                                                                                                  2.5                             2.6
                                                    2.0                                                                            1.8             2.0
Net Undercount Rate

                      2.0                                                                                           1.4
                                                            1.3
                                                                                                            0.9                            1.0
                      1.0

                      0.0
                                            -0.3                    -0.1           -0.2    -0.1    -0.3
                      -1.0                                                                                                                                          -0.5
                                                                           -0.7
                      -2.0
                                     -2.2
                      -3.0

                      -4.0

                      -5.0    -4.6
                              0-4    5-9    10-14 15 - 19 20 - 24 25 - 29 30 - 34 35 - 39 40 - 44 45 - 49 50 - 54 55 - 59 60 - 64 65 - 69 70 - 74 75 - 79 80 - 84   85+

                                                                                              Age

                                                                                                                   Source: U.S. Census Bureau, May 2012 DA release6
2010 Census Net Undercount Rates for Children Age 0 to 4 by
                  Race and Hispanic Origin

Total       Black Alone or in     Hispanic        Proxy for Non-
              Combination                         Hispanic White

                                                            -2.7

-4.6

                  -6.3

                                    -7.5
                                              Source: U.S. Census Bureau,
                                              May 2012 DA Release

                                                                            7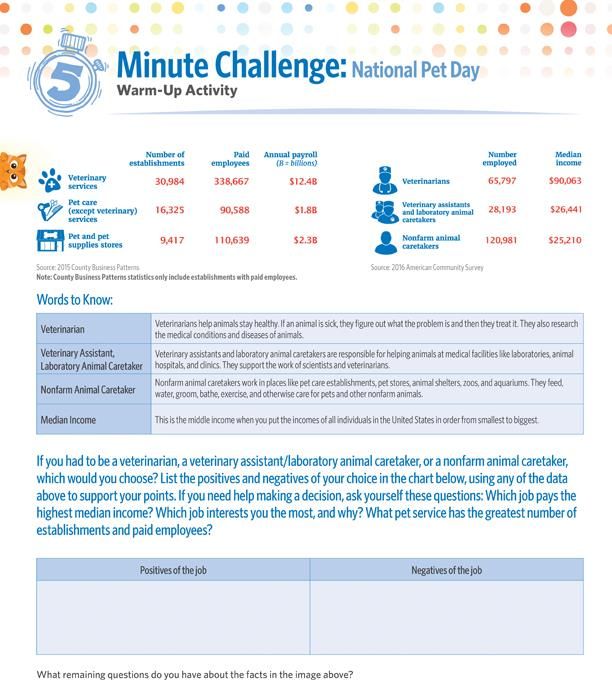
Net Undercount Rates* for Children Age 0 to 4 In the 2010
        Census Were Higher in Larger Counties
    5.0

                    1.3
                                   0.3

                                                  -1.3             -1.1
                                                                          -2.3
                                                                                     -4.0

                                                                                                        -7.8

                                                                                 Source: O'Hare 2017, International
                                                                                 Journal of Social Science Studies
  * Rate = Census counts minus Vintage 2010 population estimates                                          8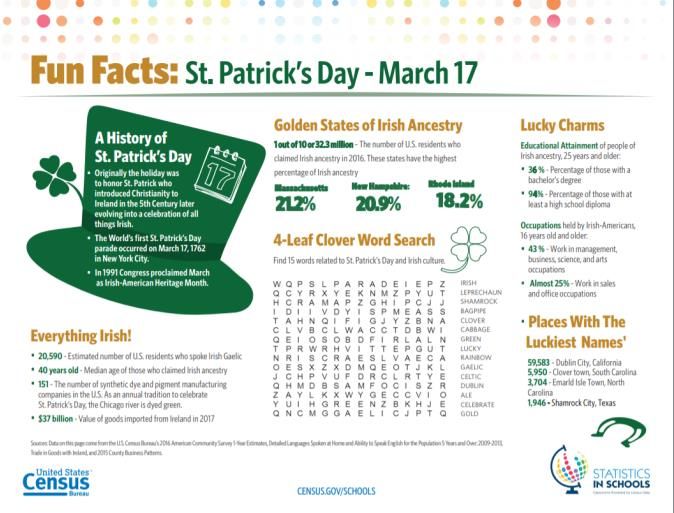
Since 1980, the Net Undercount of Young Children in the
             Census has Worsened While the Coverage of Adults has
                                   Improved
        1
N
e                                                                         Ages 0-4
t
        0
              1950   1960    1970   1980   1990    2000      2010
U       -1                                                                Adults age 18+
n   R
d   a
e   t
        -2
r   e
c       -3
o
u
n
        -4
t
        -5
                                                                                          9
                                                          Source: O’Hare 2015, Chapter4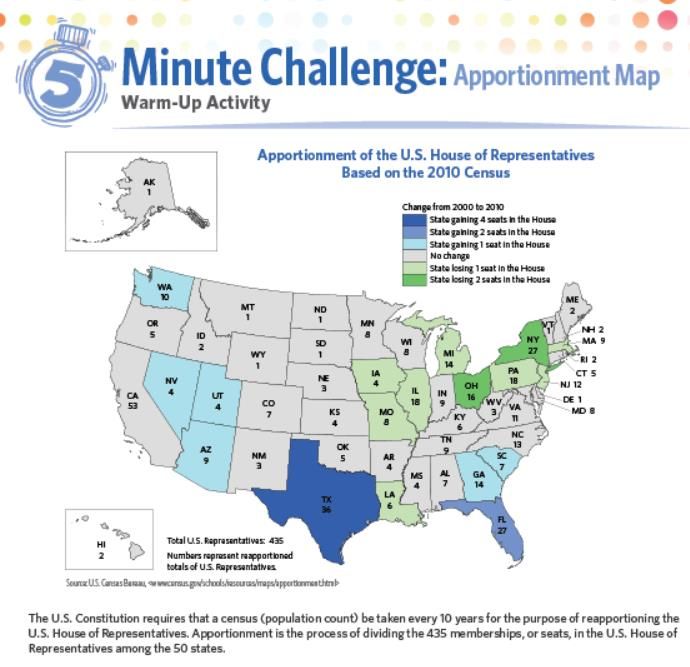
What Do We Know About Large Cities?
• Larger counties are at more risk of a young child undercount
• So are faster growing counties
• Cities with high level of immigrants face an additional challenge
  (citizenship status question makes it worse, but it’s there in any case)
• Unless we reverse this trend, it will get worse in 2020
Why Are Young Children
Missed In The Census?
Family Structure: Two out of Three Children
Missed Lived in Complex Households
• Missed kids:
   • 16% lived in an address that wasn’t included in the census
   • 16% the only person missing in a housing unit that was “enumerated”
     (counted)
   • 68% missed along with some other members of a household
• Much more likely to be missed when the person filling out the form
  isn’t their biological or adopted parent
• Complex households can be
   • Multi-generation households
   • Extended families
   • Multi-family households

                                                                           12
Fear and Confusion
• Some respondents may not want to report their child to the government
• General distrust of government
• 1.8 million children age 0-4 (6.4 million age 0 to 17) are living with at least one
undocumented parent and the addition of citizenship question may be a problem
• Some young children are living with a grandparent in restricted housing unit
• Some respondents think the Census Bureau does not want children included in the Census
• 15 percent of people in a NALEO study said they would not include their young child or
didn’t know if they would
13Other Factors: Many Have Hard-To-Count
Characteristics
Young Children Are More Concentrated in Hard-to-Count Situations Than Older Children
Difference (0 to 4
Age 0-4 Age 10-17 minus 10 to 17)
Age of householder is 18-29 29 3 26
Living in rental housing unit 44 32 12
Living in a multi-unit structure 38 26 12
Different address one year ago 15 8 7
Living in a complex household 40 33 7
Below poverty 25 19 6
Enumerator completed response 31 27 4
Grandparent responsible for grandchild 5 3 2
Living with one parent or two unmarried parents 36 34 2
Source: U. S. Census BureauHow Do We Find Kids At Risk of Being Missed? New research suggests four factors particularly important in identifying areas • Percent of racial/ethnic minorities. • Percent of households that are linguistically isolated. • Percent of young children living with grandparent householders. • Percent of young children living with nonrelative householders or in group quarters.
National Efforts to Count All Kids
         Count All Kids Committee
         Count All Kids Campaign
Counting Young Children: What Works
• Young children are missed for different reasons than adults
• We need to count young children differently than we count adults
• Adults are usually missed because they don’t return the form
• Census Bureau targets low response areas
• Messaging around returning the form
• Young children are usually missed when they are left off the form
• How do we find them?
• What messages work to get them included? How do we get nonparents to count young kids?
• Count All Kids is developing
• A score to locate areas where many young children may be missed (PRB, Dr. O’Hare)
• Message research on why families leave their children off and what messages work to get
families, especially in complex households, to count young children
• Outreach materials to persuade families to count their young childrenCount All Kids Committee: National Complete Count Committee For Young Children • Working with the Census Bureau to improve their strategies and connect them with key partners • Coordinating national awareness efforts • Engaging national networks that work with families of young children
Count All Kids Campaign
Supports state and local advocacy efforts to
• Form Complete Count Committees, including priority on counting
  young children
• Work with Complete Count Committees to
   • build effective plans,
   • give them tool to locate areas with lots of kids who may be missed and
   • outreach materials specifically for families with young children
• Encourage providers to use our outreach materials with families with
  young children
Who Should be Engaged in Direct Outreach to
Families
  •   Schools
  •   Child care centers
  •   Faith communities
  •   Medical providers (including hospitals)
  •   Government agencies
  •   Services such as WIC
  •   Libraries
  •   Businesses
  •   ?
What Can Schools and School Boards Do to
Prepare in 2019?
• Push for Complete Count Committees in states and communities to
  be formed, funded, and have young kids as a top priority
• Sit on or advise Complete Count Committees; help draft plans
  targeting families with young children using the Count All Kids
  Campaign tools
• Prepare to use the Statistics in Schools materials
• Watch for those materials!
What Can Schools and School Boards Do In
2020?
• Use Count All Kids materials for outreach to families: flyers, posters, emails,
  social media
• Host community events explaining how the Census brings federal funds to
  their community and school district, and answering questions (toolkits
  available)
• Address language differences and low literacy
   • Translation services at community events
   • Identify volunteers who speak languages other than English and Spanish to help
     answer parent questions
   • Suggest they respond by phone
• Provide internet access for parents in March-June 2020
• Use phone alert systems to update parents about any Census problems and
  how to get counted despite them
Resources • www.countallkids.org (Sign up for the campaign), on Facebook at Count All Kids, Twitter @CountAllKids • www.censuscounts.org • https://www.census.gov/library/visualizations/2018/comm/counting- children-2020.html • https://www.census.gov/programs-surveys/decennial-census/2020- census/research-testing/undercount-of-young-children.html
Questions?
• Email: census@countallkids.org
Statistics in Schools
       and the 2020 Census

      Vicki Glasier
  Statistics in Schools
  U.S. Census Bureau
www.census.gov/schools
Census in Schools 2000 and 2010
K-12 program in the U.S., Puerto Rico, and the Island Areas (Guam,
American Samoa, the Northern Mariana Islands, and the U.S. Virgin
Islands)
▪ Printed maps
▪ Kits and lessons
▪ CIS Week materials
▪ Family take-home pages
26Statistics in Schools Overview
• A free program (www.census.gov/schools) offering real census data,
tools, and activities for K-12 classrooms.
• Incorporates statistics and
data analysis in a variety of subjects.
• Designed to supplement,
not replace, teachers’ lesson plans.
• Increase statistical literacy and educate students and their families
about the importance of answering the census.
27Subject Matter Experts
• American Statistical Association
• Association of Teachers of Social Studies, United Federation of Teachers
• Boston University School of Education
• Marquette University’s Educational Opportunity Program
• National Council for Geographic Education
• National Council of Supervisors of Mathematics
• National Council of Teachers of Mathematics
• Partnership for Assessment of Readiness for College and Careers
• Women and Mathematics Education
28English Activities
• Elementary
Narratives and Names: To provide context for this activity, teachers will give
students an overview of the Census Bureau. Then, students will complete a
Quickwrite about their name and its history.
• Middle
Numbers That Tell a Story: Using State Facts for Students, a data access tool
from the U.S. Census Bureau, students will explore data about their state
and voice their opinions on how the population has changed over time.
• High School
"To Kill a Mockingbird": An Introduction to 1930s America: This activity
teaches students about the setting of Harper Lee’s famous novel “To Kill a
Mockingbird,” which takes place during 3 years (1933–1935) of the Great
Depression.
29How is Young Adulthood Changing?
30Living Arrangements by Race
31History Activities
• Elementary
"I Have a Dream" – Learning About Martin Luther King Jr.: Students will
analyze census data and graphs that demonstrate how certain aspects of the
lives of African-Americans have changed since civil rights leader Martin Luther
King Jr. delivered his “I Have a Dream” speech in 1963.
• Middle
Examining Changes in Data - African Americans' Education Levels Through
the Years: Students will analyze and compare census data on the education
levels of African-Americans in 1850 and in 1880.
• High
The Progressives and the 1920 Census: Students will interpret
and analyze a political cartoon about the 1920 Census to better understand
how the census was related to the Progressive movement of the early 20th
century.
32The History of the Telephone
33Percentage of U.S. Households with
Landline Telephone Service
34Math Activities
• Elementary
Changes in My State: Students will learn about their state as they collect
and organize business information using State Facts for Students, a U.S.
Census Bureau data tool.
• Middle
Fitting a Line to Data - Earnings and Educational Attainment: Students
will investigate the relationship between earnings and different levels of
educational attainment by creating a scatter plot, adding an approximate
line of best fit to the plot, and judging the line’s accuracy.
• High
Analyzing Relationships: Marriage, Divorce, and Linear Regression:
Students will examine census data on marriage and divorce rates for
women and men in each state and the District of Columbia.
35Differences in Earnings Across Sex and
Educational Attainment
36Distribution of U.S. State Median Earnings for Men and Women Whose
Highest Level of Education Is a High School Diploma or Equivalent
37Distribution of U.S. State Median Earnings for Men and Women Whose
Highest Level of Education Is a Bachelor’s Degree
38Sociology Activities
The Modern Family: Changes in Structure and Living Arrangements
in the United States: Students will learn why families are important
social institutions and how family structures, household sizes, and
living arrangements have changed substantially since the 1970s.
An Investigation Into Immigration and Migration in the United
States: Students will use tables and visualizations of data about
geographic mobility to explore rates and patterns of migration
within, and immigration to, the United States.
Poverty In America: Students will explore census data, including
infographics and reports, to better understand rates of poverty in
the nation.
39An Analysis of the Millennial Generation
40An Analysis of the Millennial Generation
• The percentage of young adults today who are foreign born has more
than doubled since 1980 (15 percent versus 6 percent).
• Prior generations of young adults were more likely to have ever
served in the armed services: 9 percent were veterans in 1980,
compared with 2 percent today.
• Only about three in 10 young adults have ever been married, down
from six in 10 in 1980.
41Geography Activities
• Elementary/Middle
Getting to Know Your Neighbor: Students will create a
population pyramid and examine data about their school’s
county.
Scavenger Hunt: Where is Gina the Geographer: Students will
participate in an online scavenger hunt based on a story that a
geographer named Gina, who loves to travel, has escaped to an
undisclosed location.
• High
Mapping and Analyzing Race and Ethnicity: Students will use
the Census Data Mapper data access tool to map, visualize, and
analyze the geographic distribution of various races and
ethnicities in the United States.
42Examining Changes to the Environment
Through Pictures and Data
43Examining Changes to the Environment
Through Pictures and Data
Category Historical Data Current Data
Number of houses 249,991 (1900) 3,371,062 (2010)
Number of businesses 39,776* (1900) 1,050,911 (2012)
Population 3,437,202 (1900) 8,175,133 (2010)
*Business data in 1900 count only manufacturers (companies who create products), not all retail or service businesses.
44Statistics in Schools Resources
• Monthly Fun Facts
• Warm-Up Activities
• Videos
• Primary Resources
• Monthly Newsletter
45State Facts for Students
4647
5 Minute Challenges

                      48
Partnerships
“Empowering students to be educated consumers of data.”
49Key Messages
1. There is a need for greater statistics knowledge in today’s data-
driven economy.
2. Statistics in Schools introduces statistics beyond math classes.
3. All Statistics in Schools activities were created by teachers, for
teachers.
4. Statistics in Schools is a product of the U.S. Census Bureau.
“It’s becoming increasingly difficult to define who is and is not included in America’s modern
STEM – or science, technology, engineering and math – workforce, simply because technical
proficiency is becoming mandatory in a diverse body of occupations.”
– Andrew Soergel, U.S. News & World Report
50SIS Program Goals
• Educate the public, specifically by improving statistical literacy of students
• Demonstrate applicability and utility of statistics and statistical concepts in
educational activities
• Increase the Census Bureau’s brand recognition
• Improve the public’s familiarity with the work of the Census Bureau
• Encourage public cooperation in Census Bureau surveys and censuses
5152
Statistics in Schools and the 2020 Census
March 2019    New material development (K-12; new Pre-K and
              ELL/ESL programs)

Summer 2019   New 2020 worksheets (Pre-K − 12) posted to
              SIS website (www.census.gov/schools)

Fall 2019     Kits sent to principals and superintendents

Winter 2019   Videos and webisodes available

March 2020    SIS Week

                                                              53
Households with school age children
in 2010… over 30% reported seeing
Census In Schools content.
54Help Shape the Future for Students and Schools
The 2020 count will drive decisions on the annual allocation of $675
billion in federal funding to states and communities, which includes
funding for school programs and services.
• Title I funds distributed nationwide each year.
• Federal funding for special education, school lunches, Head Start
programs, and much more.
55Encourage Teachers to Use Statistics in Schools
Resources
Sign up to receive monthly updates about new
activities and resources.
www.census.gov/schools
Click on “About”
Click on “Newsletters”
56How Can Schools and School Boards Help?
• Partner with the Census Bureau at the national and local level
• Look out for the SIS materials that will be arriving in
September/October 2019
• Encourage teachers to use SIS 2020 materials
• Communicate SIS messages to parents through email blasts, etc.
• Encourage school participation in Statistics in Schools Week (March
2020)
• Have students take home materials to share the message with their
families
57Contact Statistics in Schools
Email: victoria.r.glasier@census.gov
or
statsinschools@census.gov
Telephone: (301) 763-4030
58You can also read