A Note on the Level of Customer Support by State Governments: A Mystery-Shopping Approach - Oeindrila Dube, Sendhil Mullainathan, and Devin G. Pope
←
→
Page content transcription
If your browser does not render page correctly, please read the page content below
WORKING PAPER · NO. 2021-89

A Note on the Level of Customer Support by State
Governments: A Mystery-Shopping Approach
Oeindrila Dube, Sendhil Mullainathan, and Devin G. Pope
JULY 2021

                                                          5757 S. University Ave.
                                                              Chicago, IL 60637
                                                             Main: 773.702.5599
                                                               bfi.uchicago.edu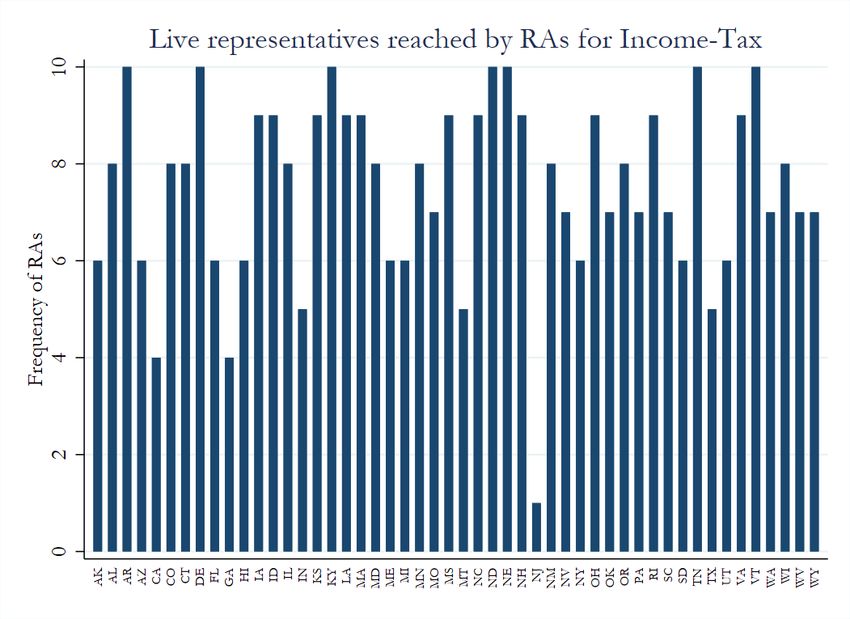
A NOTE ON THE LEVEL OF CUSTOMER SUPPORT BY STATE GOVERNMENTS:
                    A MYSTERY-SHOPPING APPROACH

                                      Oeindrila Dube
                                    Sendhil Mullainathan
                                       Devin G. Pope

                                         July 2021

© 2021 by Oeindrila Dube, Sendhil Mullainathan, and Devin G. Pope. All rights reserved. Short
sections of text, not to exceed two paragraphs, may be quoted without explicit permission
provided that full credit, including © notice, is given to the source.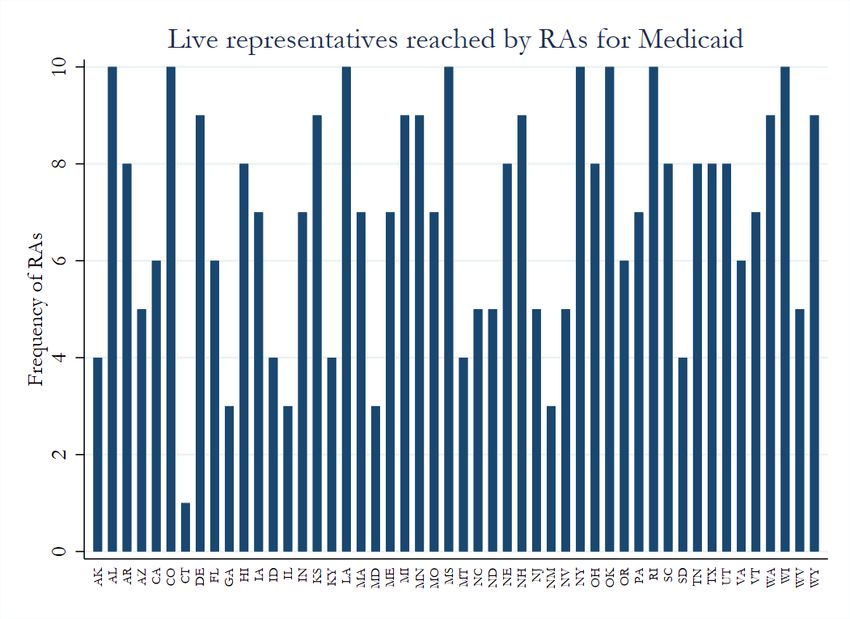
A Note on the Level of Customer Support by State Governments: A Mystery-Shopping Approach
Oeindrila Dube, Sendhil Mullainathan, and Devin G. Pope
July 2021
JEL No. H0,I38

                                           ABSTRACT

Many government services are provided at the state level such as unemployment insurance,
Medicaid, and SNAP. Given the lack of competition, a natural worry is that customer support
provided by states for these services is less than adequate. While there are many different
measures of how a state can support beneficiaries, we focus on just one in this short and applied
report: the ability to get a live representative on the phone to help with an application question. To
do this, we take a “mystery shopping” approach and make 2,000 phone calls to state government
offices. We find substantial heterogeneity in the availability of live phone representatives across
states and types of service (UI, Medicaid, etc.). For example, live representatives in New Jersey
and Georgia were reached less than 20% of the time while representatives in New Hampshire and
Wisconsin were reached more than 80% of the time. We hope that this report provides a simple
example for how academics, investigative reporters, and watch groups can help states be more
accountable for their customer support systems.

Oeindrila Dube                                    Devin G. Pope
University of Chicago                             Booth School of Business
Harris School of Public Policy                    University of Chicago
1307 E 60th St                                    5807 South Woodlawn Avenue
Chicago, IL 60637                                 Chicago, IL 60637
and NBER                                          and NBER
odube@uchicago.edu                                devin.pope@chicagobooth.edu

Sendhil Mullainathan
Booth School of Business
University of Chicago
5807 South Woodlawn Avenue
Chicago, IL 60637
and NBER
Sendhil.Mullainathan@chicagobooth.edu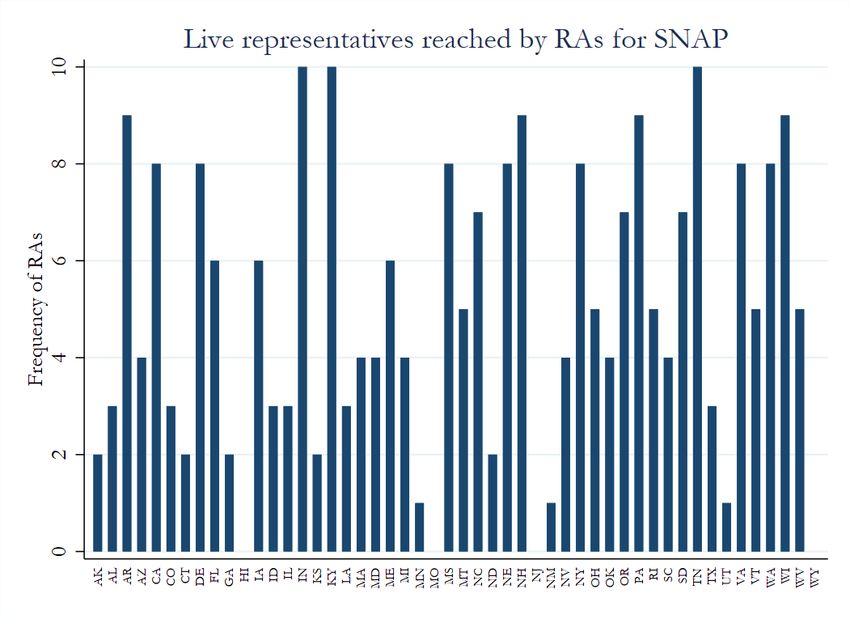
1        Introduction
Since the beginning of the COVID-19 lockdowns, more than 68 million people1 have applied for
unemployment benefits for the period ranging from March 15, 2020 to December 26, 2020. Many
discussions have suggested that the unemployment insurance (UI) application process is too onerous
and lacks customer support.234 In contrast to businesses, which often face strong competitive pressures
to provide quality customer support, states have very little oversight and incentive to make sure that
their call systems are efficient. Consequently, already vulnerable populations will face additional
hurdles because of the faulty nature of the system.
         There are many potential measures for how functional a state is when providing customer
support for UI and other government services (Medicaid, SNAP, etc). In this paper, we focus on just
one measure: the ability to get a live representative on the phone to help with an application question.
We use a mystery shopping approach and make 2,000 phone calls to states around the country and
document the probability of reaching a live representative with each call. We find significant variation
across states and government programs. For example, in Georgia and New Jersey, less than 20% of
phone calls resulted in reaching a live representative whereas in New Hampshire and Wisconsin over
80% of calls were answered. On average across all states, live representatives were easier to reach when
looking for help with Medicaid or Income tax filing relative to SNAP or UI.
         Importantly, we find that states where a live representative was more likely to be reached when
looking for help with a UI application were the same states where a live representative was more likely
to be reached for other government services. This suggests that the provision of customer support
does not randomly vary from agency to agency, but that some states are better or worse across all
agencies. We do not find evidence that states compensated for lack of live phone representatives by
having better websites or online chat features.
         Our hope is that this research can provide more accountability for state governments to
improve the customer support that they provide to their residents.

1
  U.S. Department of Labor data
2
  Unemployment Insurance Reform
3
  How to Improve Unemployment Insurance Administration
4
  How to Improve the Unemployment Insurance (UI) Application Process

                                                           2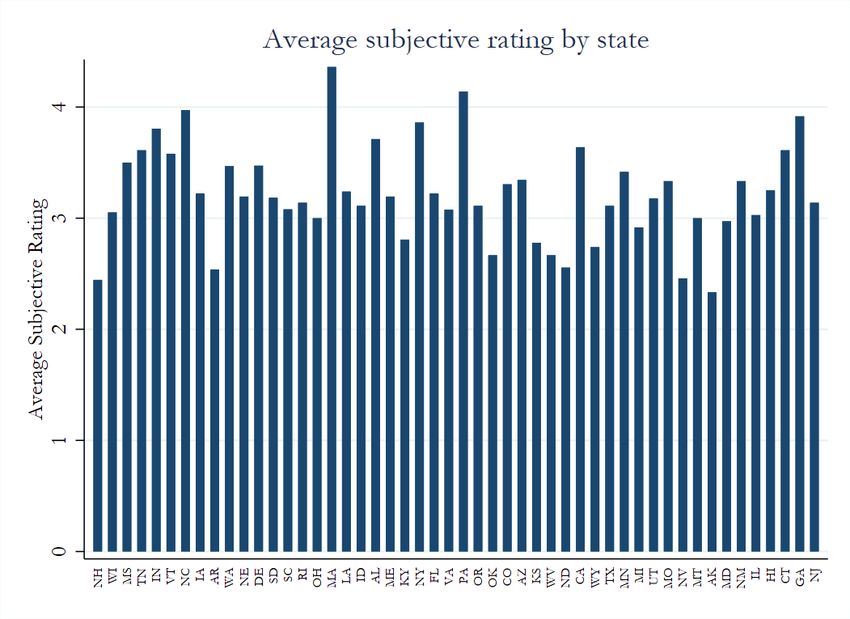
2       Methodology
We hired ten research assistants (RAs) and had each of them independently make and report the
results of 200 phone calls (50 states x 4 government offices per state). The exact steps that they were
asked to follow included:
    ● Find the phone number for each of the four government offices (UI, income tax, Medicaid,
        and SNAP) for each state.
    ● Call each phone number during local business hours.
    ● Record the number of steps needed before a live representative could be reached (e.g. if any
        buttons needed to be pressed to redirect to the relevant office).
    ● Spend as long as 45 minutes per phone call to try and reach a live representative. For example,
        a message is provided that indicates, “no representatives are available at this time” then the
        task is done for that state and “no representative was reached” should be recorded. However,
        if put on hold, the RAs were asked to stay on hold for 45 minutes before disconnecting and
        reporting “no representative was reached”.
    ● Keep track of how long exactly it took until a live representative was reached (where
        applicable).
    ● After reaching a live representative, politely disengage and hang up so as not to interfere with
        real callers and waste representatives’ time.
    ● Provide a subjective rating of the program website and record whether the program had a live
        chat feature or not.

    The phone calls were made between September 2020 and March 2021. The data for all 2,000
phone calls were then collated and are available upon request. Several checks were conducted to make
sure that RAs did not collude with each other to create their data files and that no RA had results that
fell too outside of what the other RAs were finding for each state.

3       Results
Figure 1a illustrates the number of RAs who were able to reach a live representative for UI claims by
state. As can be seen in the figure below, 8 out of 50 states were able to be reached by at least 8 RAs.

                                                    3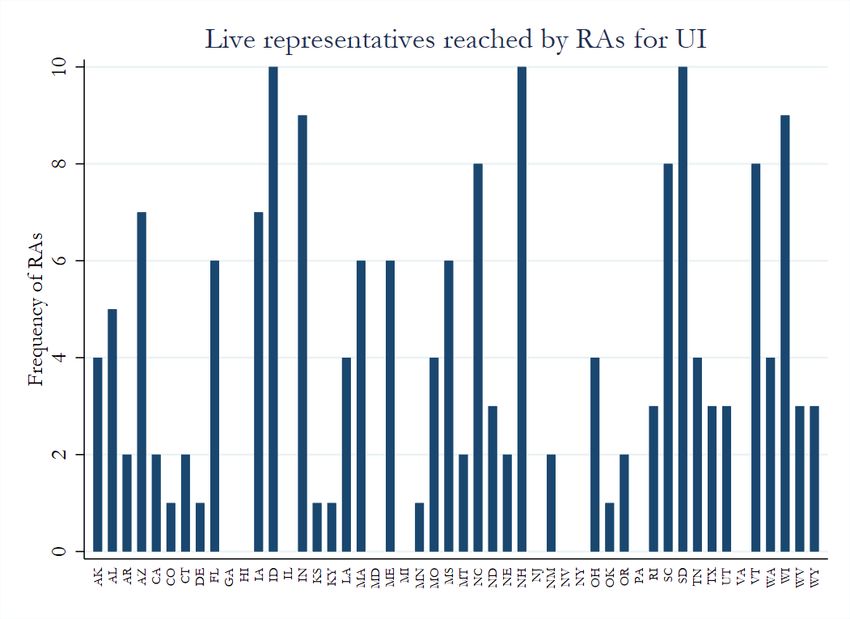
16 states were only able to be reached by 1 or fewer RAs. The results for the other three government
programs (income tax, Medicaid, and SNAP) are shown in Figures 1b-d.

Figure 1a

Figure 1b

                                                 4
Figure 1c

Figure 1d

       The figures above show that RAs were more likely to reach a live representative for some
government services relative to others. To make this more concrete, Figure 2 documents the fraction

                                                5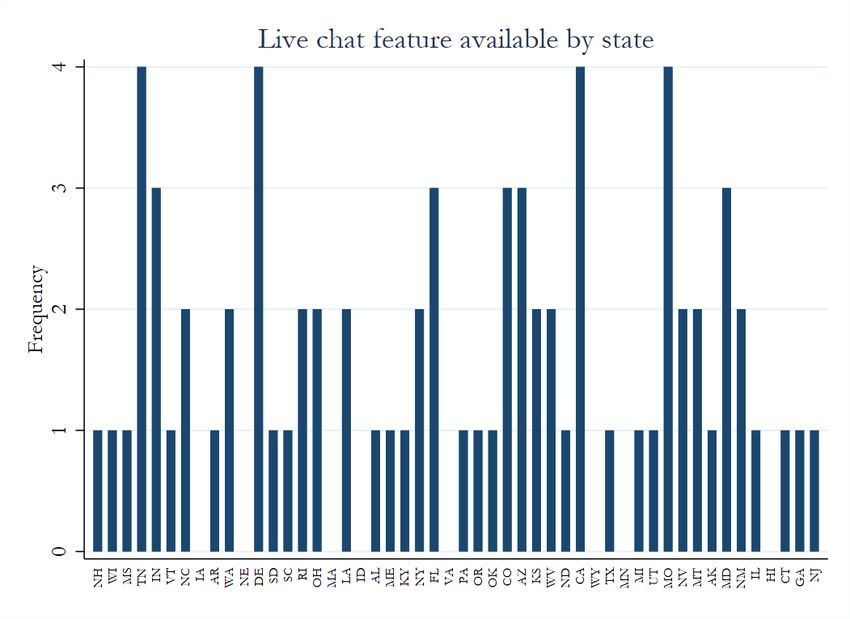
of calls that ended with a live representative for the four different government services. Income tax
help was the easiest to reach followed by Medicaid, Snap, and then UI.
Figure 2
If it is easier to reach a live representative for one service (e.g. UI) in a given state, a natural question
would be if it is easier to reach a live representative for another service (e.g. SNAP) within the state.
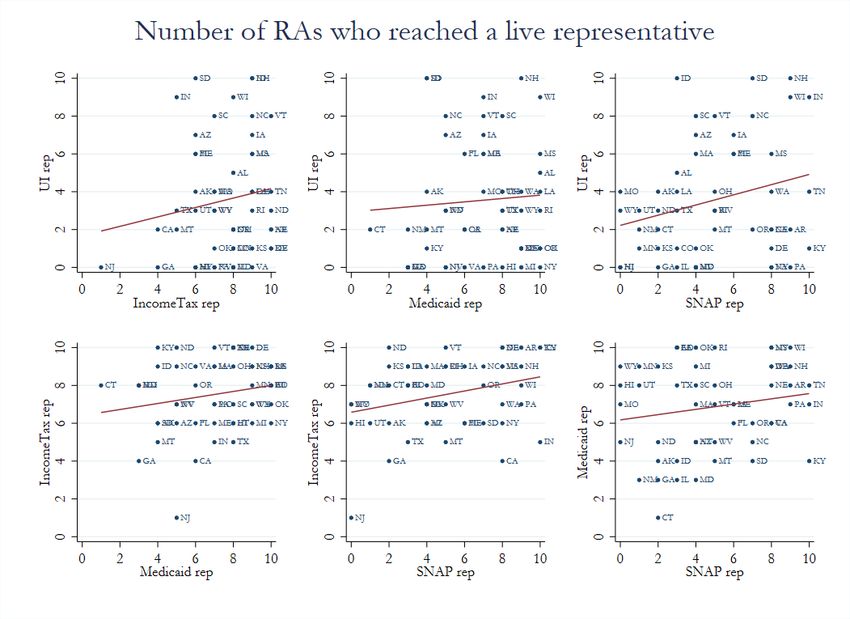
In Figure 3 below, we show scatter plots for the number of RAs who reached a live representative for
all possible combinations of government services. The positive slope of the fitted line in these scatter
plots indicates that there does exist a state-specific component. Some states do better than other states
across the board rather than it being completely random across agencies within a state.
6Figure 3
Aggregating the above results together, Figure 4 shows the total number of live representatives
reached for each state across the 40 calls that were made (10 to each of the 4 government services).
This graph highlights the variation that exists in the ability to reach live representatives across the
states. The highest performing states (New Hampshire and Wisconsin) yielded higher than an 80%
call answer rate while the lowest performing states (Georgia and New Jersey) yielded a call answer rate
that was less than 20%.
7Figure 4
One potential concern with this analysis is that reaching a live help representative is not a good
measure for the level of customer support that a state provides to program applicants. This is a
legitimate concern that we are unable to completely address. Ideally, we would want to know not only
whether a live representative was able to be reached, but how useful are the live representatives when
answering questions, how simple the process is to begin with, etc. In fact, a state could argue that
instead of having a helpful phone line, perhaps the state instead chooses to invest resources into
creating a helpful website or having a live chat feature on their website.
We asked the same 10 RAs who made the phone calls to visit the website for each state-service
and report a subjective rating of how useful/professional the website was and whether or not a live
chat feature was obviously available and functional. In Figures 5a and 5b below, we show the results
of the live chat feature and average subjective ratings of the websites. We report these results with the
states in the same order as Figure 4 (going from the states with the most available live representative
availability to the least).
8Figure 5 shows that there is certainly variability in the availability of a live chat feature and the
quality of websites, but that this does not seem to correlate with the ordering of states shown in Figure
4. For example, it is not the case that states with low ability to reach a live representative such as
Georgia and New Jersey compensate by having helpful live chats and a professional website.
Figure 5a
Figure 5b
94 Conclusion
A significant number of Americans have filed UI claims since the start of the pandemic, struggling
with inefficient call systems that place additional obstacles to receiving timely aid. We look at how
easy it is to reach a live representative in each state for UI claims, as well as for income tax, Medicaid,
and SNAP programs. Our results show that there is significant variation across states in the ability to
reach live representatives for UI claims as well as for the other three programs; states that have
inefficient UI call systems also struggle with call systems for the other programs. Improving the
efficiency of these call systems would be an important first step in reforming the UI claims system.
10You can also read