A preliminary hydrogeological investigation of the Natal Group Sandstone, South Africa.
←
→
Page content transcription
If your browser does not render page correctly, please read the page content below
A preliminary hydrogeological investigation of the Natal Group Sandstone,
                             South Africa.

                        Molla Demlie1, Rian Titus2, and Kimantha Moodely1
  1
      University of KwaZulu-Natal, School of Agricultural, Earth and Environmental Sciences.Private
                       Bag, X54001, Durban, 4000. Email: demliem@ukzn.ac.za
      2
          SLR Consulting (South Africa)(Pty)Ltd., Pentagon House, 669 Plettenberg Road, Faerie Glen,
                                  Pretoria. Email: riantitus@mweb.co.Za

Abstract

The Paleozoicage Natal Group Sandstone (NGS) that outcrops from Hlabisa (in the north) to
Port Shepstone (in the south) and Greytown (west) to Stanger (east) in the Province of
KwaZulu-Natal (South Africa) is investigated in terms of its hydrogeological
characteristics.Thissandstone Group, which comprises a lower Durban and an upper
Marrianhill Formations, is a secondary/fractured aquifer system that has variable but good
productivity across its Members. It is characterized by variable borehole blow yields ranging
from 0.2 l/s to as high as 20 l/s, with more than 50% of the boreholes having blow yield > 3
l/s. Preliminary analysis of these boreholes yields indicates that, higher yielding boreholes are
associated with a network of intersecting fractures and faults, andare recommended targets
for future water well siting in the area. Groundwater in the NGS is ofgood quality interms of
major and trace element composition and it has a total dissolved solids (TDS) composition of
< 450 mg/l. It was observed that the specific electrical conductivity (EC), TDS and major
ions composition of groundwater within the sandstonedecrease from north to south, which
appears to be controlled by geochemical composition of the aquifer material and anincrease
in the rate of recharge. Depth to groundwater is also found to decrease southwards because
ofan increase in the rate of recharge. Groundwater hydrochemical facies are generally either
Na-HCO3or Na-HCO3– Cl and environmental isotope data (2H, 18O, Tritium) indicatesthat
the groundwater gets recharge from modern precipitation. Furthermore, the EC increases
from inland to the coastal zone, indicating maritime influences and the general direction of
groundwater flow is eastwards, to the Indian Ocean.

Key words/Phrases: Natal Group Sandstone, Secondary aquifer, Rainfall recharge, Yield
                   variability, South Africa

      1. Introduction

Groundwater is an important source of water supply, especially in rural areas of South Africa
where the costs of constructing surface water schemes are very high and in some instances
not feasible due to the scattered nature of the rural population. In areas where surface supplies
are inadequate, developing groundwater through boreholes with sufficient and permanent
supplies is important over large parts of rural South Africa(Lurie, 1987). These groundwater
supplies have to come from one of the three types of aquifers found in South Africa, namely;
dolomitic, primary and secondary aquifers depending on their area of occurrence. According

                                                     1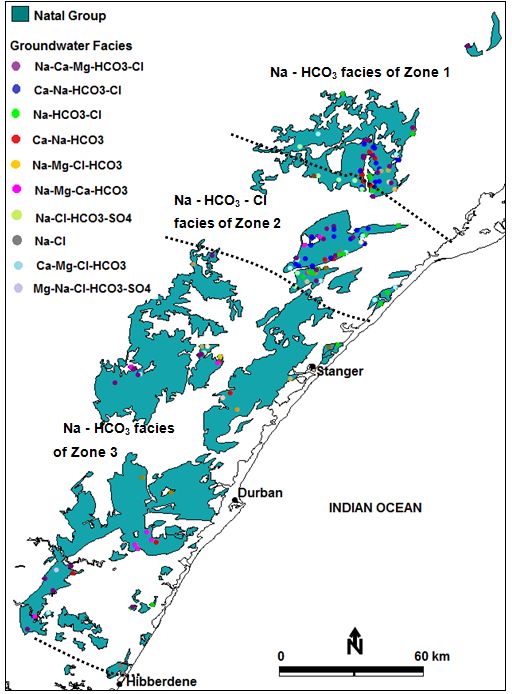
to Thompson (2006), groundwater in secondary aquifers occurs in more than 80% of the land
area of South Africa. These secondary aquifers occur in hard rock formations close to the
surface of the earth where the water bearing properties are a result of fracturing, weathering
or fracturing and weathering of an otherwise impermeable rock material having no primary
porosity and permeability.Since these rocksdon’t have primary openings, their water-bearing
properties are a result of secondary structures such as folding, fracturing, faulting, joints and
weathering. The Natal Group sandstonewhich outcrops in eastern KwaZulu-Natal (KZN)
province of South Africa is an example of a secondary aquifer. The Natal Group sandstone
which is called variously in literature; namely, Palaeozoic Sandstone Formation (Sutherland,
1868), the Table Mountain Sandstone (Anderson, 1904) and the Table Mountain Series
(Krige, 1933), is Ordovician to Silurian in age and consists of conglomerates, sandstones,
siltstones and mudrocks (Marshall, 2006). According to many reports (for instance Bell and
Maud,2000; Groundwater Development Services, 1995; E. Martinelli and Associates, 1994;
Davies Lynn and partners, 1995; Groundwater Consulting Services, 1995; VSA
Geoconsulting Group, 2009),the Paleozoic age Natal Group sandstone represents a secondary
aquifer where its porosity and permeability are results of mainly the abundant joints, faults,
and bedding plane partings.Groundwater in the large number of boreholes drilled within the
Group comes from intensively jointed and faulted rock mass.

The Natal Group sandstone is very interesting from hydrological perspective, as it is one of
the most productive aquifers in the region (Bell and Maud, 2000; Davies Lynn and Partners
(1995); VSA Geoconsulting Group, 2009. However, the variation in the hydrogeological and
hydrochemical characteristics across the entire Natal Group is lacking which has motivated
this research. The research project required regional hydrogeological investigation based on
selected representative locations where the Natal Group sandstone is outcropping. Since the
extent of the study area is very large, data generated in this study has been complemented by
data from various sources including data from the Groundwater Resources information
Project of KwaZulu-Natal (GRIP) and data from the National Groundwater Archive (NGA).
This preliminary study will assist in selecting target areas for groundwater resources
development, sitting productive boreholes and to initiate a more detailed hydrogeological
study of this fractured aquifer.

   2. General overview of the study area

2.1 Location

The distribution of the Natal Group sandstone which constitutes the study area is
locatedwithin the province of KwaZulu-Natal (South Africa) and outcrops from Hlabisa (in
northern KwaZulu-Natal) to Port Shepstone (southern KwaZulu-Natal) almost parallel to the
coast (Figure 1).

                                               2
Figure 1. Location map of the study are showing the distribution of the Natal Group
          sandstone

2.2 Climate and Drainage

The region under study has a warm sub-tropical climate where, summer is hot, humid and it
is the main rainy season, while winter is cold and dry. The temperature is variable, decreasing
from east to west and north to south. The average summer and winter temperature is 28 and
23oC respectively. Like the temperature, the rainfall is found to vary across the entire study
area, generally higher in the east along the cost and lower in the north and west, however it is

                                               3
strongly controlled by orographic effects. The Natal Group sandstone that outcrops north of
Eshowe receives relatively the lowest rainfall (450 mm - 800 mm) and has the highest
temperature.
The Natal Group sandstone is drained by major rivers and their tributaries that flow to the
Indian Ocean. The main rivers that drain and flow across the Natal Group outcrop areas are
Mfolozi, Mvoti, Mgeni, Mlazi, and Mkomazi rivers (Figure 2).
Figure 2. Drainage map of the study area along with groundwater sampling points
2.3 Geological setting
Regionally, granite and gneiss form the basement rocks in eastern South Africa. These
basement rocks comprise the Archaean rocks of the KaapvaalCraton and Mesoproterozoic
rocks of the Namaqua-Natal Metamorphic Province (Cornell et al., 2006). These basement
4rocks are overlain unconformably by the Palaeozoic rocks of the Natal Group and in turn the
Natal Group is overlain unconformably by the late Carboniferous to Early Permian Dwyka
Group and the Permian Ecca Group rocks of the Karoo Supergroup (Liu and Cooper, 1998
and Marshall, 2006).
The Palaeozoic Natal Group consists of a succession of red to brown and grey, cross-bedded
quartz-arenites, arkoses, grits and conglomerates (Bell and Lindsay, 1999). Most of the
sediments of the Natal Group are fluviatile and they were deposited by an extensive braided
river system with a northeast to southwest trending lowland trough or rift-basin (SACS, 1980;
Marshall, 1989; Bell and Lindsay, 1999; Liu, 2002; Shone and Booth, 2005).
The thickness varies considerably and SASC (1980) put the maximum thickness of the Natal
Group to 530 meters. However, Marshall (2006) estimates the maximum thickness between
500-600 m, while Hicks (2010) estimated an approximate average thickness of 600 m.
According to Trustwell (1970), the inland side outcrop of the Natal Group is almost flat
lying, while on the seaward side it dips up to 30º towards the southeast (Thomas, 1988). The
eastward dip is related to the Gondwana breakup (Marshall, 2006).
The Natal Group is subdivided into a lower Durban and an upper Mariannhill Formations
(Marshall, 1994, 2002). The Durban and Marianhill Formations are further subdivided into
five and three members respectively (Figure 3). The Durban Formation is characterised by an
upward-fining sequence with conglomerate at the base, followed by arkosic sandstones and
ends with quartz arenite (Marshall, 2002). It encompasses five members: Ulundi Member,
Eshowe Member, Kranskloof Member, Situndu Member and the Dassenhoek Member
(Marshall and Von Brunn, 1999). The succession (with the exception of the Ulundi Member)
is well represented around Durban (Marshall and Von Brunn, 1999). The Ulundi Member is a
conglomerate unit located at the base of the Natal Group (Marshall and Von Brunn, 1999). It
consists mainly of quartzite boulder to pebble conglomerate with interbedded sandstone and
mudrock (Marshall, 2006).
The Mariannhill Formation occurs throughout the Natal Group depositional basin and
comprises three members, namely; Tulini Member, Newspaper Member and the Westville
Member (Marshall and Von Brunn, 1999). The Tulini member overlies the Eshowe Member
directly in the north, and it progressively oversteps into the Kranskloof, Situndu and
Dassenhoek Members southwards (Marshall and Von Brunn, 1999). The Newspaper Member
overlies the Tulini Member and is by far the thickest member in the Natal Group (Bell and
Lindsay, 1999). It consists of arkosic to subarkosic sandstones and interbeddedargillites
(Marshall, 2002). The Westville Member consists of matrix supported, polymict
conglomerate and pebbly grit. It occurs sporadically throughout the basin, but is virtually
absent south of Durban (Marshall, 2006).
5Figure 3. Simplified geological map of the study area along with estimated limits of the
different members of the Natal group (modified from Council for Geoscience,
1998)
6Figure 4. Stratigraphic subdivision for the Cape Suergroup, Natal Group and Msikaba
Formation (adapted from Shone and Booth, 2005).
There have been limited petrographic studies carried out for the Natal Group sandstone.
However, Liu (2002) identified six types of interstitial material and cement in the Natal
Group, i.e. recrystallized primary mud matrix, hematite rims, authigenic clay minerals,
intergranular quartz, albite and calcite. The mud matrix is composed of derital clays and
quartz silt partially recrystallized to illite (Liu, 2002). Bell and Lindsay (1999) identified the
minerals quartz, K-feldspar (orthoclase), plagioclase, calcite and silica (cement) and clay
minerals (including chlorite) within sandstone samples of the Newspaper Member. These
minerals may control to some extent, among other factors, the hydrochemical characteristics
of groundwater within the Natal group. Furthermore, The thickness and occurrence of arkosic
sandstones, mudrocks and siltstones of the Natal Group show a general decrease from
northern to southern KwaZulu-Natal. Therefore, a decrease in feldspars, cement and clay
minerals, within these rocks, from north to south in the Natal Group is expected. This
decrease may influence the concentration of various ions in the groundwater.
The complex faulting observed within the Natal Group sandstone (Figure 1) is associated
with crustal extension related to the breakup of Gondwana during the Mesozoic Era (Watkeys
and Sokoutis, 1998). The outcrops of the Natal Group in the southern sector around Port
Shepstone have a consistent proximity to faults and many of the outcrops in the greater
Durban area are fault bounded (Bell and Maud, 2000). Bell and Maud (1999) described the
sandstones in the greater Durban area, as having frequent jointing, giving rise to a blocky
appearance. The structure in the greater Durban area is mainly one of tilted fault-bounded
blocks. The intense faulting as well as frequent jointing affecting the Natal Group sandstone
7gives rise to secondary porosity within the Group and this may affect its water bearing
properties, perhaps resulting in increased secondary permeability.
3. Methods and materials
The research started by reviewing existing data and literature on the Natal Group Sandstone.
Groundwater data that complimented the new data collected was obtained from the National
Groundwater Archive (NGA) of the Department of Water Affairs (DWA) and various
specialist reports. Rainfall and temperature data were obtained from the South African
Weather Service. A fieldwork involving appraisal of the geology and hydrogeology of the
Natal Group Sandstone, measuring the depth to water, on site measurement of
physiochemical parameters and sampling for hydrochemical and environmental isotope
analysis at selected locations (Figure 2) were carried out from 28 April to 21 May 2011.
Depth to groundwater was measured, where access was possible, using a dip-meter (Solinist-
Model 107). Measurement of temperature, pH, Electrical Conductivity (EC), Total Dissolved
Solids (TDS), Dissolved Oxygen (DO) and Redox Potential (Eh) was done using a Hanna
multi-parameter pH/ORP/EC/DO meter (Model H19828). Total alkalinity, HCO3- and CO32-
concentrations were determined on site by titration. Groundwater samples were taken for
hydrochemical and environmental isotopes analysis. Hydrochemical samples were filtered
through a 0.45 µm filter and major cation and trace element samples were later acidified
using nitric acid to a pH below 2, while environmental isotope samples were taken directly
from each water point and kept cool to avoid any evaporation and exchange with the
surrounding environment. Laboratory hydrochemical analysis was carried out at the
University of KwaZulu-Natal, School of Geological Sciences using ELAN 6100 Inductively
Coupled Plasma Mass Spectrometer (ICP-MS) for trace element analysis and ion
chromatograph (IC) for major ion analysis. Environmental isotope samples were analysed at
the iThemba Environmental Isotopes Labs in Gauteng following standard procedures.
Primary and secondary data collected were collated, analysed and interpreted using a number
of software.
4. Results and Discussion
4.1 Hydrogeological Characteristics
Previous hydrogeological research on the Natal Group sandstone is very limited. However,
localized studies that have been conducted indicate that the sandstone of the Natal Group is
relatively the most productive aquifer (high borehole yield and very low percentage of dry
boreholes) compared to other rock units. This may be attributed to the presence of extensive
faulting and fracturing which have enhanced the permeability of an otherwise low
permeability rock mass which in turn provided favourable condition for the storage and
movement of groundwater. This groundwater movement and storage characteristic makes the
entire Natal Group a fractured secondary aquifer system.
8Bell and Maud (2000) reported that the sandstone aquifer of the Natal Groupin the greater
Durban area has a storativity of 0.001, which istypical for confined aquifers. An average
transmissivity (T)of about 1.5 m2/day and hydraulic conductivity (K) of 2.8 m/day is reported
for the same area by Groundwater Development Services (1995). However, more than 60
m2/day transmissivity values are commonly reported in areas that are characterized by faults,
fractures and joint systems with borehole yields greater than 5 l/s.
Analysis of 48 borehole data drilled within the Natal Group sandstone gave a yield that
ranges from 0.2 to 20 l/s with an overall median yield of 3 l/s (Table 1). The spatial
distribution of the yield appears to be without any clear trend. However, boreholes drilled
within the vicinity of major faults along with high recharge areas appear to have consistently
higher yields. Similar observation has been reported by VSA Geoconsultant Group (2009). It
was documented that boreholes tapping the Natal Group aquifer east of Greytown yield as
high as 30 l/swhich were drilled in proximity to two major cross cutting faults.
Table 1. Borehole yield summary for the Natal Group sandstone based only on 48 data points
(Data from NGA).
Borehole yield No. of % Minimum Maximum Mean Yield Median Stdv
(l/s) boreholes yield (l/s) Yield (l/s) (l/S) Yield (l/s)
> 3 l/s 24 51
> 0.5 l/s ≤3 l/s 19 40
> 0.1 l/s ≤ 0.5 l/s 5 9 0.2 20 4.4 3 3.7
4.2 Groundwater recharge, depth to groundwater and flow direction
According to Vegter (1995) and DWAF (2006) Groundwater Resources Assessment Project
II (GRAII) recharge estimate, the northern outcrops of the Natal Group sandstone receive the
lowest recharge followed by the western outcrops. Areas in proximity and parallel to the
coast and the southern sector receive relatively the highest recharge rates. These values are in
line with average areal average precipitation rates for the region. Due to the poor spatial
coverage of depth to groundwater data distribution, it is difficult to give a conclusive
interpretation. However, the preliminary interpretation suggests that depth to ground water
increases towards the northern (around Melmoth and Eshowe) and western part of the study
area and decreases towards the coast which appears to be influenced by mean annual recharge
and topography. The regional groundwater flow direction is towards the Indian Ocean
starting from the western boundary of the Natal Group; however, the local flow directions are
very complex.
94.3 Hydrochemical characteristics of the Natal Group sandstone
Based on field and laboratory results, data from the KZN GRIP and information from
different specialist reports, the general hydrochemical quality of groundwater within the
Natal Group sandstone is good except in areas east of Melmoth where groundwater having an
EC as high as 449 mS/m and a TDS of 2791 mg/l is reported. The EC decreases generally
from the coast in land and from north to south. Figure 5 shows the distribution of TDS across
the Natal Group sandstone.
Figure 5. Map showing the variation of TDS (mg/l) across the Natal Group sandstone.
All major ions show a decreasing trend from north to south, similar to the trend of the TDS.
This trend appears to be a result of the lithological variations within the Natal Group from
north to south and as a result of variations in groundwater recharge. Based on variation in
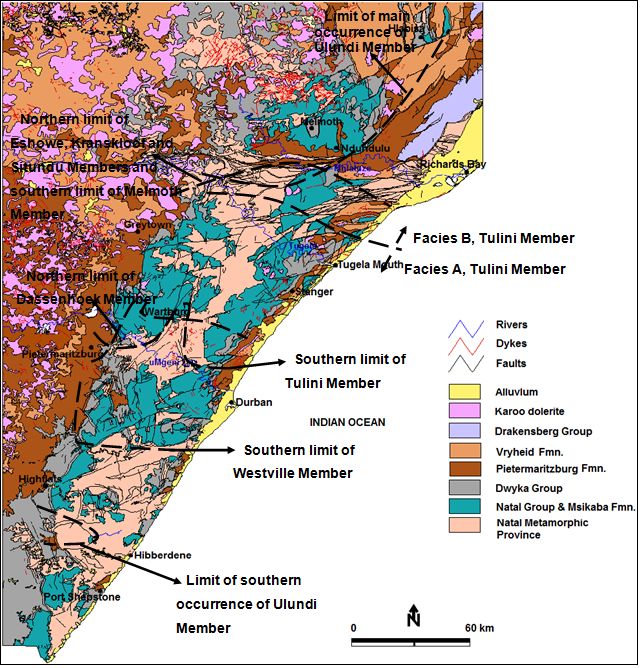
dominant hydrochemical facies, groundwaters within the Natal Group sandstone are
subdivided into three regional hydrochemical Zones (Figure 6 and 7). The dominant
hydrochemical facies in Zone-1 (Figure 7) is sodium-bicarbonate, whereas for zone-2, the
dominant facies is sodium-bicarbonate-chloride. Zone-3 is dominated by again a sodium-
bicarbonate facies groundwater. Except for high iron and nitrate content which is a problem
in groundwaters of parts of KwaZulu-Natal, all the minor and trace element concentrations
are within permissible limits of national and international drinking water quality standards.
10Figure 6. Piper diagram of (a) Zone-1 with dominant sodium-bicarbonate hydrochemical
water type; (b) Zone-2 with dominant sodium-bicarbonate-chloride water type and
(c) Zone – 3 with a predominant sodium-bicarbonate water type, refer to figure 7
for the three different zones.
11Figure 7. Subdivision of the Natal Group sandstone based on hydrochemicalfacies variation.
4.4 Environmental Isotopes
Results of environmental isotope analysis (δD, δ18O and tritium)for areas investigated during
the course of this research are presented in table 2 and figure 8. The stable isotope plot on
figure 8 along with the local and global meteoric water lines indicates that groundwater in
these areas are derived from local rainfall without much evaporation. Samples taken in the
northern sector of the Natal Group have a relatively enriched isotopic signal, plot above the
local meteoric water line (LMWL) and have measurable amounts of tritium, while the central
and southern sector samples have a relatively depleted isotopic signal, plot below the LMWL
and have low to dead tritium values. Despite the limitation in the number of data points, these
isotope results support the fact that the northern and southern Natal Group groundwaters have
characteristic variations in terms of recharge, borehole yield, depth to groundwater,
hydrochemistry and other hydrogeological properties.
12Table 2.Results of environmental isotope analysis for selected groundwater points within the
Natal group sandstone.
Sample Altitude EC TDS δD δ18O Tritium
Latitude Longitude pH
no. (m) (μs/cm) (ppm) [‰] [‰] (TU)
NLS 1 -29.78865 30.6758 508 6.35 259 130 -17.2 -3.86 0.6
NLS 2 -29.41133 30.64105 960 7.04 322 161 -22.5 -4.66 0
NLS 3 -29.45306 30.52556 809 5.97 187 92 -16.0 -3.65 -
NLS 4 -30.01707 30.79569 312 6.75 187 94 -10.7 -3.41 1.2
NLS 5 -28.91433 31.43128 542 5.66 244 122 -11.1 -3.38 1.1
NLS 6 -28.85904 31.32319 818 7.08 121 60 -12.9 -3.55 0
NLS 7 -28.67896 31.50996 580 6.25 171 85 -11.4 -3.34 0.5
NLS8 -29.38523 30.96114 554 6.1 165 82 -14.1 -3.38 1.5
Figure 8. Groundwater 18-Oxygen and Deuterium plot for the Natal Group along with the
local and Global meteoric water lines.
5. Conclusions and Recommendation
Based on interpretation of existing literature, data and new data generated in the framework
of this research, the following preliminary conclusions are drawn:
• Groundwater recharge is lowest in the outcrops north of the study area (Melmoth) and
in the western outcrop areas of the Natal Group sandstone. The outcrops in the south
including the area of Umbumbulu receive relatively the highest recharge with the
remaining outcrops receive moderate recharge rate.
• Borehole yields within the Natal Group sandstone is a function of mainly proximity to
cross cutting faults and fractures followed by recharge rate. The depth to water in the
north is relatively high and may be the result of the low recharge received by these
outcrops. Depth to water shows a general decrease from inland to the coast (excluding
13the outcrops near Melmoth and Eshowe). The regional groundwater flow direction is
towards the coast.
• The EC shows a general decrease from the coastal zone to inland. The high EC along
the coast is most likely attributed to the close proximity of the ocean. The TDS and
major ions (Na, Ca and Mg) decrease from north to south within the study area, with
the highest concentrations observed east of Melmoth. This trend is possibly due to the
decrease in occurrence of arkosic sandstone, siltstone and mudrock of the Natal
Group from north to south in addition to recharge variations. The dominant
hydrochemicalfacies of the groundwater within the Natal Group sandstone are Na-
HCO3 and Na-HCO3-Cl.
• Environmental isotope signatures have supported the hydrogeological and
hydrochemical variations across the Natal Group sandstone.
This preliminary hydrogeological study will hopefully pave the way for future more detailed
research towards understanding the hydrogeology of this important fractured aquifer system
which contains strategic groundwater resource for rural water supply schemes.
References
Anderson, W.A. (1904). Second Report of the Geological Survey of Natal and Zululand.
West, Newman and Co., London, 169 pp.
Bell, F.G. and Lindsay, P. (1999). The petrographic and geochemical properties of some
sandstones from the Newspaper Member of the Natal Group near Durban, South
Africa. Engineering Geology, 53, 57-81 pp.
Bell, F.G. and Maud, R.R. (1999). Landslides associated with the colluvial soils overlying the
Natal Group in the greater Durban region of Natal, South Africa. Environmental
Geology, 39 (9), 1029-1038 pp.
Bell, F.G. and Maud, R.R. (2000).A groundwater survey of the greater Durban area and
environs, Natal, South Africa.Environmental Geology, 39 (8), 925-936 pp.
Cornell, D. H., Thomas, R. J., Moen, H. F. G., Reid, D. L., Moore, J. M. and Gibson, R. L.
(2006). The Namaqua-Natal Province.In: Johnson, M.R., Anhaeusser, C. R. and
Thomas, R. J. (Eds), The Geology of South Africa. Geological Society of South
Africa, Johannesburg, 325-379 pp.
Council for Geoscience.(1998). 1: 250 000 Geological Map of KwaZulu-Natal.
Davies Lynn and Partners (1995).Characterization and Mapping of the Groundwater
Resources of the KwaZulu-Natal Province Mapping Unit 4.Department of Water
Affairs and Forestry.
Department of Water Affairs and Forestry (DWAF).(2006). Groundwater Resource
Assessment 2- Task 3Ae Recharge, unpublished report.
E. martinelli and Associates (1994).Hydrogeological Characterisation and Mapping of the
Groundwater resources of Mapping Unit 1 of the KwaZulu-Natal
Province.Department of Water Affairs and Forestry.
14Gammons, C. (2001).Water Chemistry Sampling.In: Weight, W.D. (Ed.), Hydrogeology
Field Manual. 2nd ed. McGraw Hill, New York, 287-320 pp.
Groundwater Consulting Services (1995). Characterization and Mapping of the Groundwater
resources of Mapping Unit 2 of the KwaZulu-Natal Province.Department of
Water Affairs and Forestry.
Groundwater development Services (1995).Hydrogeological Characterisation of the
KwaZulu-Natal Province.Mapping Unit-3, Department of Water Affairs and
Forestry.
Hicks, N. (2010).Extended distribution of Natal Group within southern KwaZulu-Natal,
South Africa: implications for sediment sources and basin structure.Council for
Geoscience.
Kingsley, C.S. (1975). A new stratigraphic classification implying a lithofacies change in the
Table Mountain Sandstone in southern Natal.Transactions of the Geological
Society of South Africa, 78, 43-55 pp.
Krige, L.J. (1933). The geology of Durban.Transactions of the Geological Society of South
Africa, 35, 37-67 pp.
Liu, K.W., Cooper, M.R., 1998. Tidalites in the Natal Group. South African Journal of
Geology 101, 307–312.
Liu, K.W. (2002). Deep-burial Diagenesis of the Siliciclastic Ordovician Natal Group, South
Africa. Sedimentary Geology (154) 177-189.
Lurie, J. (1987). South African Geology: for Mining, Metallurgical, Hydrological and Civil
Engineering. Lexicon Publishers, Johannesburg, 160-163 pp.
Marshall, C.G.A. (1989). Stratigraphy and sedimentology of the Natal group in the Melmoth
and Hlabisa areas. Annual technical report of the Geological Survey of South
Africa, 101-103.
Marshall, C.G.A. (1994). The stratigraphy of the Natal Group.Unpublished M.Sc. thesis,
University of Natal, Pietermaritzburg.
Marshall, C.G.A. (2002). The stratigraphy, sedimentology and basin evolution of the Natal
Group.Mem.Council of Geoscience, 91, 176 pp.
Marshall, C.G.A. (2006). The Natal Group.In:Anhaeusser, C.R., Johnson, M.R., and Thomas,
R.J. (Eds), The Geology of South Africa. The Geological Society of South Africa,
Johannesburg, 433-441 pp.
Marshall, C.G.A. and Von Brunn, V. (1999).The stratigraphy and origin of the Natal
Group.South African Journal of Geology, 102 (1), 15-25 pp.
Rhodes, R.C. and Leith, M.J. (1967).Lithostratigraphic zones in the Table Mountain Series of
Natal. Transactions of Geological Society of South Africa, 70, 15-28 pp.
SACS (South African Committee for Stratigraphy), 1980.Stratigraphy ofSouth Africa.Part
1.(Compiled by L.E. Kent).Lithostratigraphy ofthe Republic of South Africa, South
West Africa/Namibia, and theRepublics of Bophuthatswana, Transkei and
Venda.Handbook 8,Geological Survey, South Africa, 690p.
15Shone, R.W., Booth, P.W.K. (2006). The Cape Basin, South Africa: A review. Journal of
African Earth Sciences (43)196-210.
Tankard, A.J., Eriksson, K.A., Hunter, D.R., Jackson, M.P.A., Hobday, D.K. and Minter,
W.E.L. (1982). Crustal Evolution of Southern Africa: 3.8 Billion Years of Earth
History. Springer, New York, 384-351 pp.
Thomas, R.J. (1988). The Geology of the Port Shepstone Area.Geological Survey, South
Africa, 99-123 pp.
Thomas, R.J., Marshall, C.G.A., Watkeys, M.K., Fitch, F.J., Miller, J.A. (1992). K-Ar and
40
Ar/39Ar dating of the Natal Group, south east Africa: a post-pan-African
molasse? Journal of African Earth Science, 15, 453-471 pp.
Trustwell, J.F. (1970). An Introduction to the Historical Geology of South Africa.Purnell and
Sons, Cape Town, 112-114 pp.
Vegter, J. (1995). An explanation of a set of National Groundwater Maps.Water Research
Commission. Report No. TT 74/95.
VSA Geoconsultant Group (Pty) Ltd. (2009). Groundwater Resource Potential of an Airborne
Geophysical Survey Area near Greytown. Pretoria, 1-12 pp.
Watkeys, M.K. and Sokoutis, D. (1998).Transtension in southeastern Africa associated with
Gondwana break-up. In: Holdsworth, R.E., Strachan, R.A. and Dewey, J.F. (Eds)
(1998). Continental Transpressional and Transtensional Tectonics.Geological
Society, London, Special Publications, 135, 203-214 pp.
16You can also read