A stormy year - TOPICS Geo Natural catastrophes 2017 Analyses, assessments, positions - Munich Re
←
→
Page content transcription
If your browser does not render page correctly, please read the page content below
A stormy year

TOPICS Geo
Natural catastrophes
2017
Analyses, assessments, positions

Editorial
Dear Reader,
2017 was a wake-up call. After a number of relatively benign years, natural
disasters in 2017 caused overall losses of US$ 340bn. Insurers had to pay out a
record US$ 138bn in losses.
It is crucial that insurers and reinsurers take account of statistically rare loss events
in their risk management calculations. One such rare event was the torrential
rainfall and severe flooding that Hurricane Harvey brought to the Houston area in
August. The series of three powerful hurricanes that struck within the space of just
a few weeks – Harvey, Irma and Maria – is also rare but by no means impossible,
especially as experts predict that certain types of extreme weather events are likely
to become more frequent in the future as a result of climate change. 2017 therefore
gave us a foretaste of what we can expect in the future. Once again, significantly
less than half the losses were covered by risk transfer solutions.
These facts and figures not only highlight the business opportunities available to
insurers. They also show the enormous economic challenges that people, companies
and public institutions face in tackling the consequences of disasters. Given these
circumstances, insurers are almost obliged to develop new covers that better meet
clients’ needs. The use of data from sensors or satellites and systems incorporating
elements of artificial intelligence now make it possible to offer entirely new insurance
concepts. One positive effect of such a system is faster payouts by insurers, which
help victims to get back on their feet sooner following a disaster. Studies have
shown that emerging countries in particular are able to recover more quickly after
catastrophes if insurance density is high.
In order to develop new types of cover, we need in-depth knowledge of the risks
and how they are changing. Currently top of our agenda is to achieve a better
understanding of which regions and weather hazards are already subject to changed
risk patterns due to global warming. And we are also looking at ways in which risk
prevention can help limit losses.
This latest issue of Topics Geo analyses the natural disasters of 2017 and discusses
the conclusions drawn. I hope you find the articles both interesting and informative.
Munich, March 2018
Dr. Torsten Jeworrek
Member of the Munich Re Board of Management
and Chairman of the Reinsurance Committee
Munich Re Topics Geo 2017 1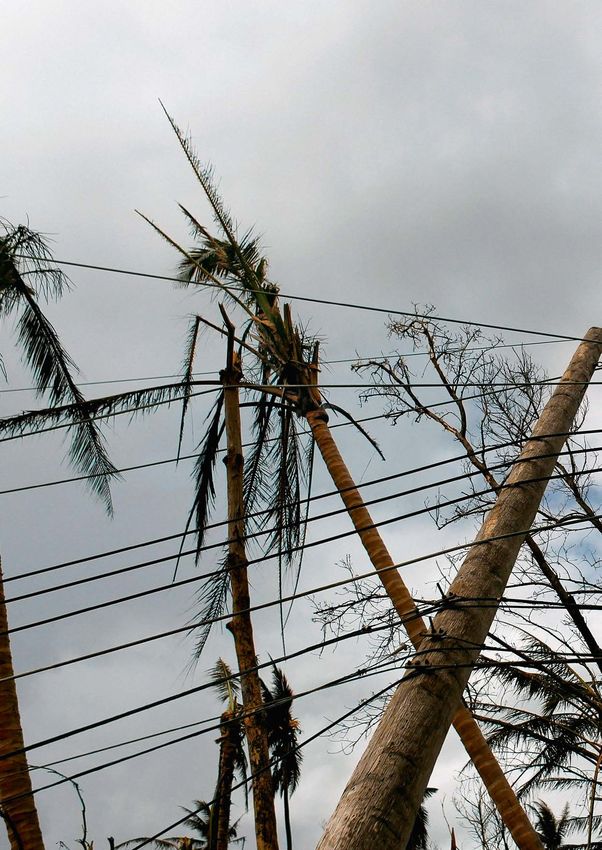
Contents
In focus
4 Record hurricane season
Highest-ever hurricane losses in a single
year
10 Harvey – The Houston deluge
More than 1,000 mm rainfall in just a
few days
14 Irma – A sigh of relief in Florida
Monster storm changes course from
most destructive path
18 Maria – Lights out in Puerto Rico
Islands in the Caribbean devastated and
without power for weeks on end
22 Tilting at windmills
Comment by Peter Höppe on the frustra-
tingly slow progress of climate protection
After several years without major hurricane losses, North Atlantic
storms hit back with a vengeance in 2017. Countries in the
region and the insurance industry were given a timely reminder
that the combination of high return periods and massive losses
make the Gulf of Mexico a disaster hotspot.
4
2 Munich Re Topics Geo 2017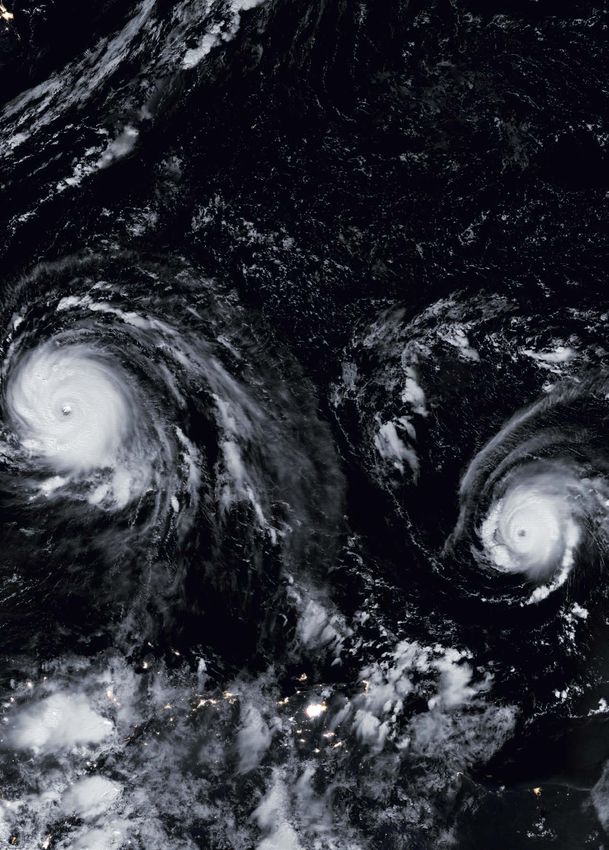
Catastrophe portraits
24 Spring frosts
Cold spring weather causes poor berry,
fruit and wine harvests throughout much
of Europe
24
24
30 Floods in South Asia
Disasters hit poorer regions particularly
hard
Catastrophe portraits: Hurricanes were not the 36 Preventing water disasters
Losses
only frominnatural
major disasters 2017. Other weather-related Interview with Dr. Han Seung-soo,
events such as wildfires, frost and floods caused Special Envoy of the UN for Disaster Risk
catastrophes
billions of dollars in damage, as did earthquakes. The Reduction
2017 moderate level of insured disaster losses
continued
remains a concern, with less than half insured, even 38 Earthquake strikes on anniversary
US$ 340bn
in developed countries. The share of insured losses 32 years after the 1985 catastrophe, the
in poorer countries is much lower. ground in Mexico City shook again
42 California burning
8,000 wildfires in the Golden State bring
record losses
48 Underinsured
Ernst Rauch addresses the insurance gap
in rich and poor countries
Less than half of the
losses insured
NatCatSERVICE and Research
50 The year in figures
US$ 138bn
The natural disaster statistics and pictures
of 2017
(41%) 58 Another hot year
2017 joins the list of warmest-ever years
50 62 Risk Management Partners
Service tools to improve management of
natural hazard risks
NatCatSERVICE and Research: With over 700 loss
Floods in South Asia:
events, 2017 ranks among the top five years in terms
of number of events. Munich Re’s NatCatSERVICE
a(http://natcatservice.munichre.com/)
tool humanitarian disaster contains 1 Editorial
a wealth of annual and long-term statistics at the 64 Contacts
touch of a button. Imprint
2,700 people
killed
Costliest hurricane
season on record
Munich Re Topics Geo 2017 3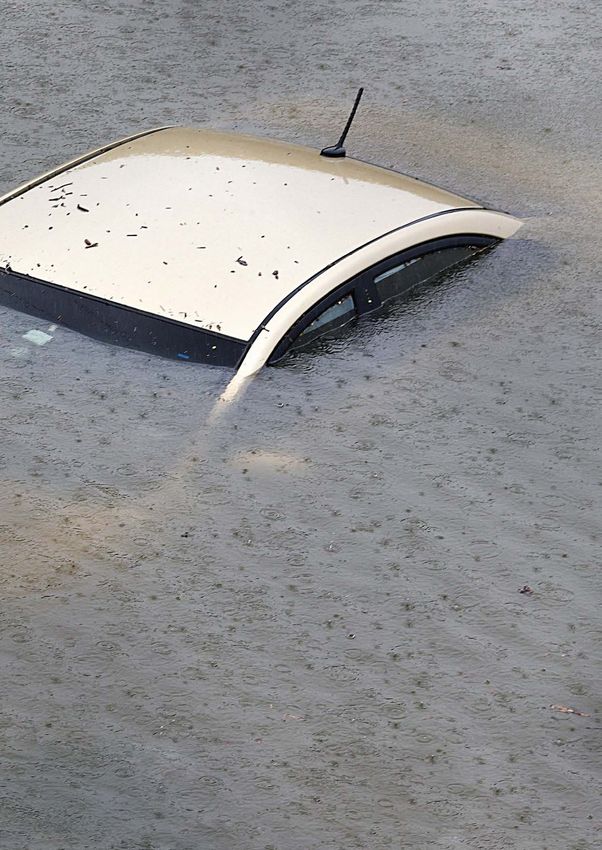
In focus

                    Within a span of four weeks, the
                    hurricane trio of Harvey, Irma and Maria
                    made the 2017 hurricane season
                    in the North Atlantic the costliest ever.

4       Munich Re Topics Geo 2017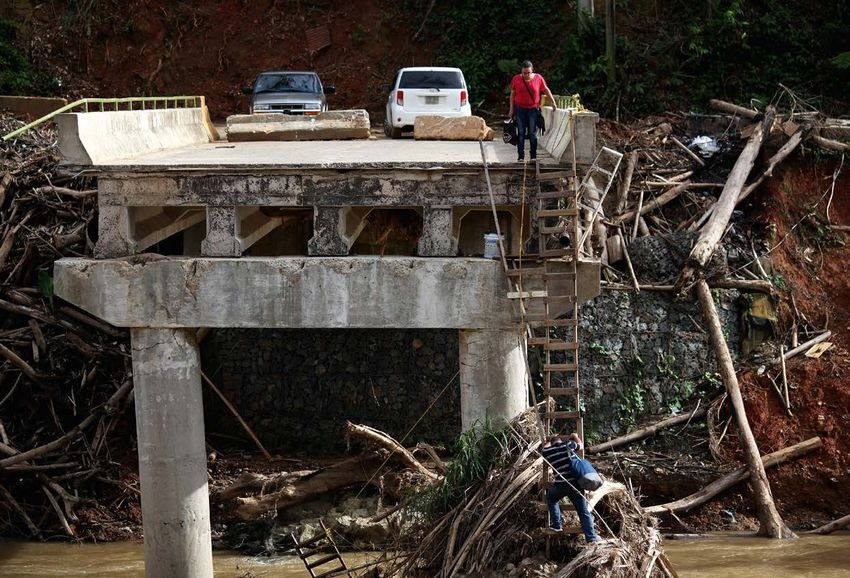
Overall losses reached around
US$ 220bn and insured losses
almost US$ 90bn.
The image shows, from left to right, hurricanes Katia, Irma and Jose on 8 September 2017.

                                                                                      Munich Re Topics Geo 2017   5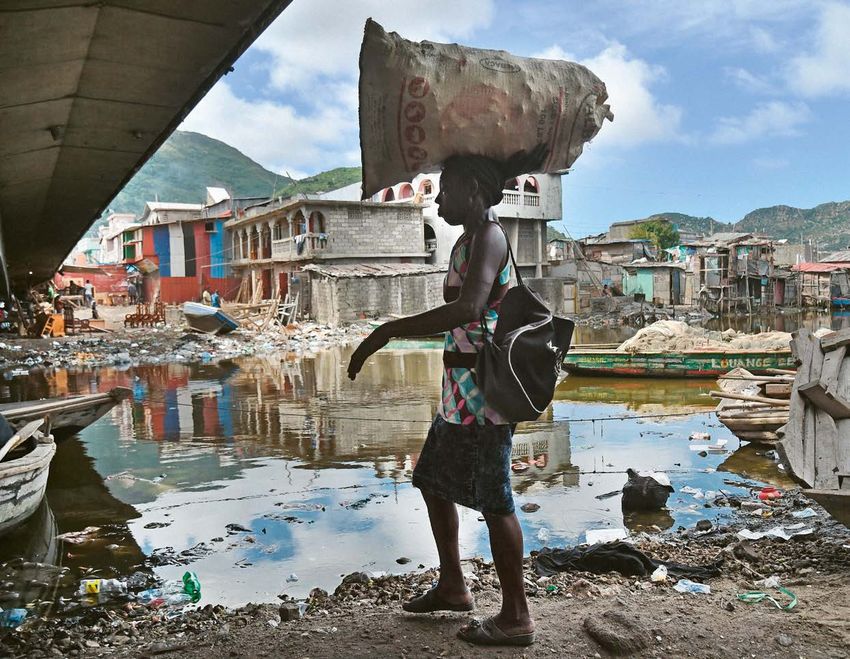
In focus

                             The hurricane season 2017

                            A cluster
                            of extreme
                            storms

                             Eberhard Faust and Mark Bove

6       Munich Re Topics Geo 2017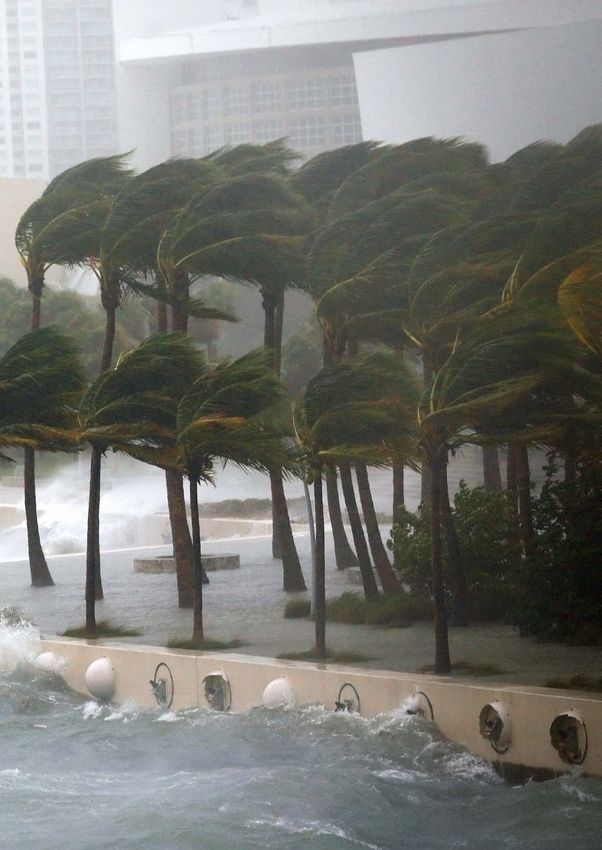
Munich Re Topics Geo 2017 7

In focus

                    In terms of original values, the 2017
                    hurricane losses were higher than in the
                    previous record year of 2005 that included
                    hurricanes Katrina, Rita and Wilma (overall
                    losses US$ 163bn, insured losses US$ 83bn).
                    The question implicitly raised by the events
                    of 2017: What are the causal factors that make
                    a record-breaking loss year?

8       Munich Re Topics Geo 2017
Only a portion of the 2017 hurricane season was Meteorological conditions definitely had an influence on
extremely active – the second half of August through last year’s activity. Although the northern North Atlantic
early October. During this period, several meteorological saw a period of remarkable surface cooling between 2014
preconditions for above-normal activity were met, such as and 2016, this cooling signal never reached the tropical
sea surface temperatures in the tropical main develop- North Atlantic. Hence, the level of enhanced sea surface
ment region substantially above average, very low levels temperatures since the onset of the current warm phase
of difference in winds at low levels and aloft, an active in the mid-1990s has remained unabated in the tropics,
West African monsoon producing tropical cyclone seed- although the last few hurricane seasons before 2017
lings, and – last but not least – sufficient moisture levels were not very active. In fact, the August–October 2017 sea
in the mid to upper troposphere. Given the confluence surface temperature anomaly in the main development
of such conducive conditions, the season “turned on” and region of the tropical North Atlantic in 2017 was the
produced a cluster of exceedingly strong storms. third-highest since 1995.
The favourable conditions led to six major hurricanes
(cat 3–5) out of an overall ten hurricanes (cat 1–5), and This, together with the other conducive meteorological
17 named storms in total. In comparison, note that the settings, rendered 2017 another season of the current
period of elevated activity since 1995 averaged 3.4 major active era in the tropical Atlantic. This means that
hurricanes per year. The Accumulated Cyclone Energy high-activity periods reveal a temporal structure
(ACE)released by the storms approximately tied the totals of high season-to-season variability with occasional
of 2004 and 1995, with only 2005 having been stronger extremely active seasons which are characterised
since 1950. All of these high-activity years fall into the period by a cluster of very intense storms. Hence, one of the
of elevated levels of tropical North Atlantic sea surface important outcomes of the 2017 season should be
temperatures since 1995. to make sure that the risk models employed by the
insurance industry improve their capability to simulate
It is noteworthy that major hurricanes Harvey, Irma, and seasonal clusters of strong storms.
Maria of 2017 all underwent rapid intensification, reached
record or near-record intensities, produced record rainfalls
and – in the case of Irma – maintained extreme intensity Besides the influences from natural multidecadal climate
for a record-breaking amount of time. variability such as warm and cold phases, climate change
may also have already played a role, most likely regarding
Similar tracks of Irma and Maria through the Caribbean the extreme precipitation involved. Current projections
of future conditions expect almost unchanged or stagnating
A broad spectrum of mechanisms accounted for the overall tropical cyclone numbers in most ocean regions
widespread destruction stretching from the Texas Gulf for the mid-21st and end-21st century. By contrast, the
coast to Florida to the northeast Caribbean: in the case frequency of the extreme storms (cat 4–5) is projected to
of Harvey, high pressure blocked the storm’s path and increase in most areas given continued climate change.
reduced its forward speed, resulting in days of torrential Also, maximum wind speeds will on average rise a little,
rainfall over roughly the same region in eastern Texas and and rainfall rates within 100 km of the storm’s centre will
Louisiana. increase due to higher evaporation rates. Recent research
has found that over the last 140 years climate change has
With the other storms, high winds and storm surge caused significantly increased the probability of extreme three-
most of the damage in the Caribbean and Florida. Due to day rainfall on the Gulf Coast, such as that associated
the similar tracks of Irma and Maria through the Caribbean, with Harvey (van Oldenborgh et al.: Attribution of extreme
some islands were hit twice, with Maria destroying what rainfall from Hurricane Harvey, Environ. Res. Lett., 12, 2017).
Irma had left standing.
Against the background of these findings and projections,
Many settlements and coastal stretches in the region the 2017 season does appear to be a foretaste of the future.
were severely affected, with some places experiencing We expect there to be a higher frequency of exceptional
significant long-term outages of essential infrastructure hurricane seasons like 2004, 2005 and 2017.
such as electricity and communications. These conditions
challenged governmental budgets. Specialised labour
was needed to carry out repairs, causing a shortage of
skilled tradesmen. The time taken to repair these systems
further exacerbated damage levels, drove prices up,
and triggered an economic downturn and emigration from
some locales.
A billboard in Miami is ripped apart by high
winds as Hurricane Irma passes
Munich Re Topics Geo 2017 9In focus
Hurricane Harvey
Record-breaking
floods inundate
Houston
Tobias Ellenrieder
10 Munich Re Topics Geo 2017Harvey was the wettest tropical cyclone ever to hit
the USA. In parts of Texas, unprecedented flooding
occurred. The direct economic losses are likely to
be as much as US$ 95bn, which would make Harvey
the second-costliest hurricane on record after
Katrina. Many private households face a sizeable
insurance gap.
Munich Re Topics Geo 2017 11In focus
Freeways in Houston submerged under water
following Hurricane Harvey
The eighth named storm of the 2017 Atlantic hurricane Explosive
The storm intensification
second-costliest tropical storm ever
season developed from a tropical wave on 17 August east Hurricane
HurricaneHarvey
Harvey
of Barbados. Harvey traversed the Lesser Antilles as a
tropical storm, but weakened to a tropical depression Wind speed (gusts) in km/h
Windspeed (Gusts) km/h
thanks to unfavourable conditions in the Caribbean. After
crossing the Yucatán Peninsula, it began to be influenced 76 142 185 213 252
by a warm-water area in the Bay of Campeche. This
Harvey caused massive
had separated from what is known as the “loop current”, flooding in the Houston area.
a warm ocean current between Yucatán and Cuba. The
resulting increase in convection quickly fed Harvey with
new energy, allowing it to develop to a category 4 hurricane
within 48 hours.
TheThe
second-costliest tropical storm ever
second-costliest tropical cyclone
Hurricane Harvey
Hurricane Harvey
Overall losses
˜ US$ 95bn
˜ US$ 30bn
Insured losses
Source:
Munich Re Munich Re, based on National Hurricane Center/NOAA
Source: Munich Re, National Hurricane Center/NOAA
Sources: PCS, Munich Re NatCatSERVICE
Munich Re Source: PCS, Munich Re NatCatSERVICE Cyclone with extreme precipitation
On 25 August, Harvey made landfall near Rockport in Texas. Following landfall in Texas, parts of Harvey’s circulation
The scale of storm damage was relatively low because of remained over the warm waters of the Gulf of Mexico,
the comparatively limited spread of the strongest winds bringing large quantities of moisture to the mainland. In
and the sparse population in the landfall region. Also, no many parts of southern Texas, the aggregate rainfall
particularly strong storm surge was able to build up because exceeded 1,000 mm. The peak value was measured at
of the very rapid development of the storm just before over 1,500 mm near Beaumont, roughly 120 km east of
landfall. During its further course, however, the cyclone Houston. But the Lone Star State’s largest city also saw
was sandwiched between two high pressure systems, rainfall of more than 750 mm over a wide area. This made
with the result that its forward progression was brought to Harvey the wettest tropical cyclone in the USA since
a virtual standstill. On 28 August, the centre of Harvey records began. In some cases, the return periods for the
moved back over the sea, before the storm made landfall quantities of rain experienced were in the 1,000-year
for a second time on 29 August in Louisiana, after which it range. Much of Harris County recorded rain exceeding the
weakened rapidly and finally dissipated. 1-in-100-year amount.
12 Munich Re Topics Geo 2017While the amounts of rain were exceptional, the situation Insurance cover limited
was compounded by local conditions. The area of the
Texas coast where Harvey hit is extremely flat: there is Flooding in the USA is not covered in standard private-
only a 15–20 metre difference in elevation between residence policies. But this is where the National Flood
Houston and the coast 40 km away at Galveston Bay. Insurance Program (NFIP) comes in. It provides private
The rivers in the district around Houston have only a individuals with government insurance cover – albeit
gentle slope and a low discharge capacity. Houston is also with limitations. The programme is only compulsory
built on alluvial soil, and as the result of groundwater for properties with a mortgage that are located within a
abstraction, the ground there is sinking – by up to 6 cm 1-in-100-year flood zone. The premiums are relatively
per year in places. high for what is a limited scope of cover. For example,
payments are capped at US$ 250,000 for buildings, and
US$ 100,000 for contents, and basements are not covered
Strong
A veryand
wet extremely
storm wet under the policy.
HurricaneHarvey
Hurricane Harvey
Due to these somewhat unattractive conditions, the
Total precipitation in mm
Total rainfall in mm
number of NFIP policies has fallen in recent years. In Harris
County around Houston, only one in six homeowners has
100 400 700 ≥ 1,000 insurance cover for flooding. In addition, the flood zones
for which NFIP protection is compulsory relate to river
flooding only. But the floods triggered by Harvey mainly
Return period for precipitation
above 1,000 years in places.
affected areas far from any body of water. Lax building
regulations did the rest: houses do not have to be built at
Baton Rouge higher levels, and insufficient consideration was given to
the flood risk when planning residential developments.
New Orleans
Beaumont In the course of the construction boom in Houston, large
Austin areas have been sealed in the last few years that could
otherwise have helped in soaking up and discharging water,
Houston
thus reducing the flooding hazard.
Better models needed for flood risks
Corpus Christi Hurricane Harvey demonstrated once again that floods
not only account for a significant proportion of total losses
from tropical cyclones, but can actually make up the bulk
Source:
Munich Re Munich Re, based on National Hurricane Center/NOAA
Source: Munich Re based on National Weather Service of such losses. Up until now, these have only played a
minor role for the insurance industry in the USA because
the risk – where applicable – was covered by the federally
All this set the scene for a “perfect rainstorm”. In the run NFIP. This is also reflected in the options for modelling
days after landfall, more than 80 gauge stations around this risk. Numerous solutions and tools delivering an
Houston reported flooding, 42 of them severe flooding. improved risk assessment have only been developed over
Record levels were measured at a large number of river the last few years. These range from zoning solely for
gauges. The floods were exacerbated by the fact that floods that can be used for risk selection and rating, to
water had to be released from several reservoirs to prevent fully probabilistic models to calculate loss accumulations
dams bursting. Approximately 25–30% of Harris County and reinsurance requirements. However, hurricane models
was under water. only simulate losses from wind and storm surge – but
not flooding losses due to torrential rain. They are thus not
Harvey was the second-costliest hurricane after Katrina suited for mapping the interaction between these three
risks. On the other hand, pure flood models generally do not
The deadly combination of severe and extensive flooding map tropical cyclones, which means that one component
in a highly developed economic region – with 6.6 million of the risk is missing.
residents Houston is the fourth-largest city in the USA –
resulted in enormous losses. More than 200,000 homes If the insurance industry is to expand flood insurance in the
were damaged or destroyed, and over 250,000 vehicles USA and tap into the new business potential this will bring,
were damaged. Harvey flooded 800 sewage plants. At it will need to include flooding in its hurricane models.
least 88 people were killed. Production of oil and gas in
the region had to be cut back by about 25%.
With direct losses of US$ 95bn, Harvey is the second-
costliest cyclone in US history after Hurricane Katrina in
2005. Texas anticipates costs of US$ 180bn to repair
the damage and prevent such disasters in the future. This
compares with insured losses of US$ 30bn. Particularly
in private households, there is a substantial gap between
insured and actual losses.
Munich Re Topics Geo 2017 13In focus
Hurricane Irma
A close
shave for
Florida
Doris Anwender
With wind speeds of up to 300 km/h,
Hurricane Irma will go down in history as
a storm of superlatives. What is more,
if its track had shifted only slightly, losses
in Florida would have been substantially
higher. The unexpectedly low level of
damage in the state may also have been
due to improved building regulations. Even
so, initial estimates put overall losses at
US$ 57bn and insured losses at US$ 29bn,
making Irma the fifth-costliest hurricane
of all time.
14 Munich Re Topics Geo 2017Munich Re Topics Geo 2017 15
In focus
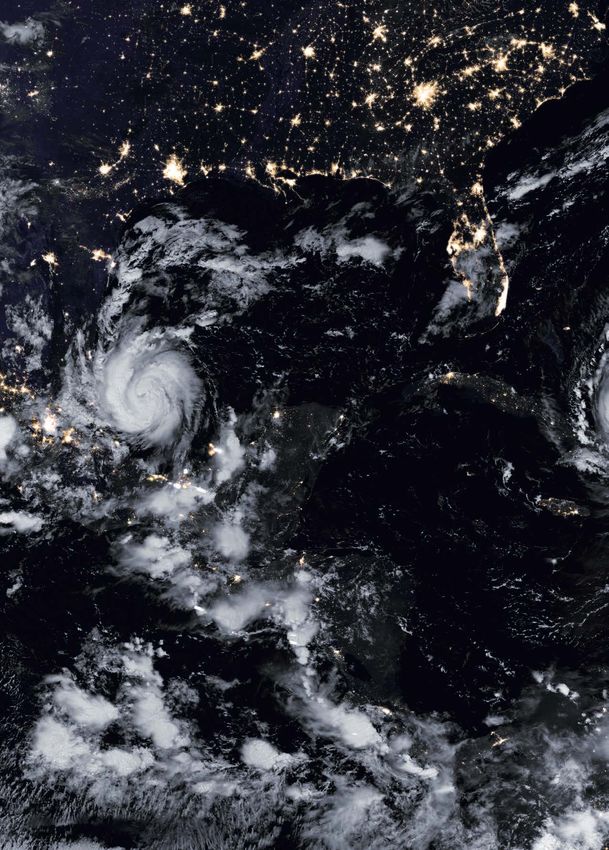
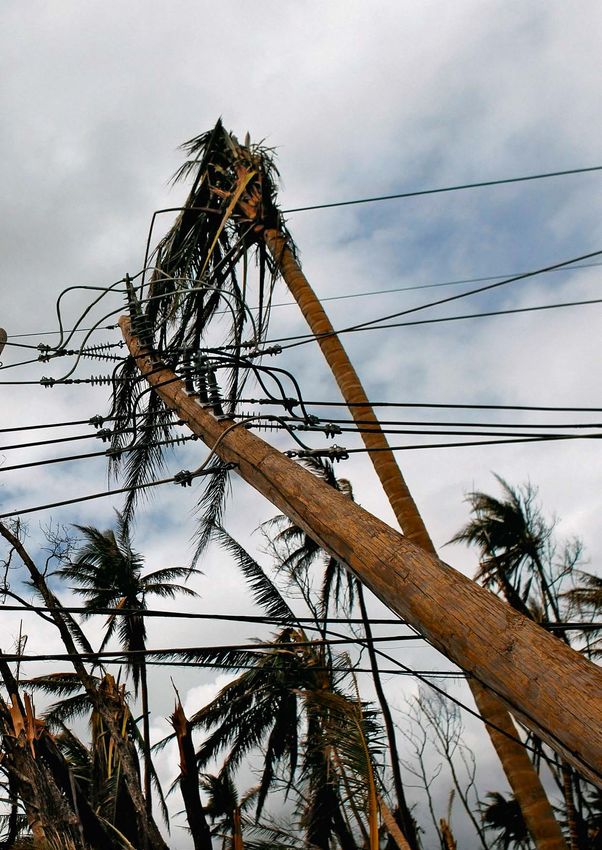
Scene of destruction in the north of Haiti ahead
of Hurricane Irma
Tropical cyclone Irma developed on 28 August 2017 from Storm of superlatives
a tropical wave in the Atlantic that originated in Africa. As
it moved west, it intensified with the help of exceptionally After making initial landfall on 6 September in the Lesser
warm ocean waters to become a category 5 hurricane Antilles at peak strength, Irma proceeded to devastate
on the Saffir-Simpson scale, with peak wind speeds of numerous islands in the Caribbean. Later, as it tracked
300 km/h. Irma thus holds the record for the most powerful westwards, the storm passed over extremely warm ocean
cyclone ever measured over the Atlantic, not including the waters with temperatures of up to 34°C. Because of its
Caribbean and the Gulf of Mexico. relatively high forward speed, the storm quickly crossed a
large area with high ocean temperatures, helping it to
intensify rapidly. Hurricanes that track more slowly restrict
Building
Floridacodes helped
spared the worst contain
losses in Florida their intensity more because they remain longer over sea
Hurricane
HurricaneIrma
Irma surfaces that have been mixed by the storm and are thus
cooler.
Overall losses
Irma next grazed the coast of Cuba before veering north
˜ US$ 57bn and hitting the Florida Keys as a category 4 hurricane.
˜ US$ 29bn Several hours later, when it finally struck Marco Island on
the southwest coast of Florida, it had weakened slightly
Insured losses to a category 3 hurricane.
Sources: PCS, Munich Re NatCatSERVICE
Munich Re Source: PCS, Munich Re NatCatSERVICE
16 Munich Re Topics Geo 2017Irma was an unusual storm in many respects. To begin the west coast. Uncertainty among those responsible for
with, its centre, where the highest wind speeds occur disaster management and among the general population
around the calm eye, was exceptionally large for such an of Florida was correspondingly high.
intense storm. This meant that the path with its maximum
speeds was also unusually wide. Furthermore, the hurricane The actual track the storm finally took was somewhat
maintained these maximum speeds for more than three fortunate in as much as it released its greatest power over
consecutive days, then weakened briefly to a category 4, the sparsely populated interior of Florida, where it was also
before intensifying again to category 5. As a result, a large cut off from its source of energy, the warm ocean.
number of Caribbean islands were exposed to extreme
wind speeds. Owing to the size of the storm over its life Damage and impact
cycle, regions like Miami Beach, which under normal
circumstances would only have felt the outer edges of the Photos and satellite images showed severe devastation
hurricane force winds, were affected by storm surges. on Barbuda, on the French/Dutch Caribbean island of
Saint Martin/Sint Maarten, on Anguilla, and throughout
the British Virgin Islands and the two US Virgin Islands of
Blessing in disguise
An extreme storm for Florida St. Thomas and St. John. Irma’s impact was also felt on
Hurricane
HurricaneIrma
Irma Puerto Rico, Turks and Caicos, in the Dominican Republic
and Haiti, on the southern Bahamas and in Cuba. Even
Wind speed (gusts) in km/h though a strip of the Florida Keys was devastated by the
Windspeed (Gusts) km/h
storm and storm surge, there were unexpectedly few
76 142 185 213 252 ≥300 reports of damage from the mainland and from most of the
Florida Keys. In all probability, this is due to a tightening
of building regulations after Hurricane Andrew. In 1992,
Andrew made landfall in Florida near Miami as a category
5 hurricane, and moved across the southern part of the
state with devastating wind speeds.
Irma made landfall at
Marco Island on the Despite the relatively low level of damage, extensive
west coast of Florida.
The cities on the east evacuation measures in Florida led to chaotic conditions
coast remained unscathed. on the peninsula. Most of the population responded
to the official call to evacuate, alarmed by the potentially
record-breaking size and intensity of the hurricane, and by
media reports on the devastation it had caused on islands
in the Caribbean. This led to overcrowded airports, grid-
locked roads, long queues at filling stations, fuel shortages,
and looting in cities that were virtually deserted.
Source:
Munich Re Munich Re, based on National Hurricane Center/NOAA
Source: Munich Re, National Hurricane Center/NOAA
The fact that Irma’s landfall in Florida was forecast
more than five days in advance reflects the high
Destructive path difficult to predict quality of the weather forecast. But even in the future,
it will remain impossible to predict the track of hurri-
The track a hurricane takes is mainly determined by the canes precisely, so those responsible for disaster
wind direction in the surrounding area. Irma moved in a management will need to weigh up whether or not to
westerly direction at the southern edge of a subtropical order an evacuation each time an extreme event occurs.
area of high pressure rotating in a clockwise direction. At The probabilities of alternative scenarios provided by
the western edge of the high, Irma came under the influence meteorologists in so-called ensemble forecasts can
of a trough approaching from the west, whose (counter- help decision-making here.
clockwise) winds steered it northwards towards Florida.
The predicted track is based on the high and low pressure
areas and their projected intensity. Even small deviations
can have serious consequences when a cyclone makes
landfall on a narrow landmass such as Florida. For example,
a cyclone along the east coast of Florida, with the enormous
concentration of values in Miami, Cape Canaveral and
Jacksonville, could have produced many times the losses
of a storm further west. But in the west of Florida there
are also sizeable cities like Fort Myers, Naples and Tampa.
These centres would potentially be affected by the right,
strong-wind side of a cyclone moving over the sea along
Munich Re Topics Geo 2017 17In focus
Hurricane Maria
More damage
with each
passing day
Peter Miesen
Hurricane Maria caused extreme damage
on Puerto Rico and other islands in the
Caribbean and was the most destructive
natural disaster ever for Dominica. On many
islands it took several weeks before the
infrastructure for the supply of electricity
and water was operating reasonably
efficiently again. Loss estimates proved
extremely difficult to arrive at.
18 Munich Re Topics Geo 2017Munich Re Topics Geo 2017 19
In focus
Bridge in Puerto Rico after Hurricane Maria hit the
area in September 2017
The storm system developed on 16 September some Compact system with extreme winds
800 km east of Barbados. Within 24 hours it had become
a category 1 hurricane moving westwards. In the space In contrast to the enormous Hurricane Irma, which had
of 15 hours over the course of 18 September, the system devastated the Lesser Antilles somewhat further north
strengthened to a category 5 storm with wind speeds only two weeks earlier, Maria was a relatively small but
above 250 km/h, shortly before the eye passed directly extremely intense system. The highest wind speeds
over Dominica, leaving catastrophic damage in its wake. occurred in a ten-kilometre radius around the eye. During
its rapid crossing of Dominica, Maria weakened to a cat
egory 4 storm. On its continued path, the system touched
Extreme
Extremedamage in Puerto
damage especially Rico
in Puerto Rico the southwest regions of Guadeloupe. As the eye of the
Hurricane
HurricaneMaria
Maria storm found itself over water again, Maria rapidly returned
to a storm of the highest category. On 20 September,
Overall losses as it passed close to St. Croix, the most southerly of
the three largest US Virgin Islands and home to roughly
˜ US$ 68bn 50% of the population, gusts are estimated to have
˜ US$ 30bn peaked at around 300 km/h. After Irma had struck the
islands of St. Thomas and St. John in the northern part
Insured losses
of the US Virgin Islands, the last island in the group was
now exposed to severe squalls.
Sources: PCS, Munich Re NatCatSERVICE
Munich Re Source: PCS, Munich Re NatCatSERVICE At this point, the storm system was already undergoing
what is known as an “eyewall replacement cycle”, where
a new ring of convective air flow forms outside the centre.
This cuts off the inner ring with the highest wind speed
from its supply of energy, causing it to dissipate. As a
result, the intensity of the system is reduced – for some
time at least – while the radius of the highest wind speeds
expands. Maria then struck Puerto Rico as a category 4
hurricane on 20 September. The wind field was now large
enough to cover almost the entire island.
20 Munich Re Topics Geo 2017Maria took less than twelve hours to traverse the island, to take advantage of tax incentives. These ship their
weakening in the process to a category 2 storm before products from the island to the US mainland and abroad.
undergoing renewed intensification over water to cat In 2016, the island state, which is an unincorporated
egory 3. The remnants of the storm caused damage in the territory of the USA, exported pharmaceutical and medical
Dominican Republic, on the Turks and Caicos Islands, products worth US$ 14.5bn, equivalent to more than 72%
and on some sparsely populated islands in the Bahamas. of Puerto Rico’s total exports.
The storm next tracked over the Atlantic in a north-easterly
direction. Furthermore, the final extent of Maria’s losses, and also
that of the other hurricanes of the season, was significantly
influenced by what is known as post-loss amplification.
Small
Small butvery
but verystrong
strong For example, as the number of claims increases, so too
Hurricane
Hurricane Maria
Maria does the demand for building materials and labour, and
thus the costs for these services. This phenomenon was
Wind speed (gusts) in km/h more pronounced in a year like 2017, when several severe
Windspeed (Gusts) km/h
hurricanes passed over the region. On the other hand,
76 142 185 213 252 ≥300 the economic crisis and the high rate of unemployment on
Puerto Rico may avoid a massive increase in labour costs.
Put plainly, we can say that, months after Hurricane Maria
hit, the loss development is still incomplete.
Consequential losses from destroyed infrastructure
Maria was one the ten
costliest hurricanes of The relatively sluggish aid efforts and the heavily damaged
all time despite not even infrastructure had an adverse effect on loss development
reaching the US mainland.
in Puerto Rico. More than a month after the event, roughly
80% of customers had still not been reconnected to the
power grid. But the necessary infrastructure needs to be
relatively intact before repairs can even begin. And the
longer it takes to commence repairs, the higher the conse-
quential losses that occur, for example from rainwater
entering buildings. Not having an electricity supply
impacted the entire economy on the island, which led to
Source:
Munich Re Munich Re, based on National Hurricane Center/NOAA
Source: Munich Re, National Hurricane Center/NOAA
massive losses from business interruption insurance.
Even by the end of the year, it had not been possible to
High level of uncertainty in estimating losses finally determine the loss amounts from Maria. The esti-
mate for overall losses is around US$ 68bn, with insured
At between US$ 15bn and US$ 85bn for the entire event, losses of around US$ 30bn. It will only be possible to
there were significant variations in the estimates for make more precise loss estimates once we can predict
insured market losses that were published in the first few how long reconstruction will take. For the future, the
weeks after Maria. This wide range stems from a series of events of this hurricane season, and Hurricane Maria in
uncertainty factors. A major role in this context is played particular, will provide new evidence of the degree to
by the extent and estimation of the wind field and the which post-loss amplification can affect the loss amount.
storm surge area derived from it. Local floods cannot be
determined through simulations alone because rain data is
much too coarse in terms of spatial and temporal resolution. In contrast to the long-lasting loss adjustment
There is also generally no information on the degree of process, Hurricane Maria also showed the role insur-
the soil’s saturation. The already soaked soil from Irma’s ance can play in financing emergency and recovery
precipitation certainly played a role in the flooding during operations. CRIFF SPC, an insurance pool that has
Maria. Similarly, the terrain models are too coarse for locally been operating for the last ten years with the aim of
differentiated estimates. And lastly, there is little information providing Caribbean and Latin American states with
on where, and to what extent, protective structures such as prompt financial assistance after hurricanes and
dykes failed. earthquakes, announced just days after the storm hit
the island that it would pay US$ 19m to the govern-
Pharmaceutical industry highly concentrated in ment of Dominica.
Puerto Rico
A further source of uncertainties in loss simulations lies kündigte nur Tage nach dem Sturm die Auszahlung von
in the vulnerability curves used. For example, the storm 19 Mio. US$ an die Regierung von Dominica an.
reached wind speeds on Puerto Rico that were above the
ranges validated with loss data. In addition, Puerto Rico
in particular involves pharmaceutical industry risks for
which there is little loss experience. A large number of
American and international pharmaceutical companies
have relocated their production facilities to Puerto Rico
Munich Re Topics Geo 2017 21Column
Climate
protection
or tilting at
windmills
Professor Peter Höppe,
Former Head of Munich Re’s Geo Risks Research/Corporate
Climate Centre
22 Munich Re Topics Geo 2017Unlike the windmills in Cervantes’ classic Don Quixote, considered a developing or industrialised country. In fact,
the threat of climate change is a real giant to contend ten years ago, China overtook the USA as the biggest
with. But, in spite of the urgency and significance of the emitter of greenhouse gases. Yet it is heartening to see
topic, progress remains far too slow. The Bonn climate that renewable energies are being rolled out very quickly
summit in November 2017 – though it was constructive in China, leading to the reduced use of coal there in recent
and resolved a number of points of detail – has done little years.
to reverse this trend. Two points are especially worthy
of mention, however. For the first time ever, cities and The top priority for the next few years and decades must
regions from around the world were able to actively be for societies around the world to adapt to the now
participate in the negotiations. Secondly, the summit saw already inevitable impact of climate change. Science
the official launch of the InsuResilience Global Partnership, offers increasingly precise information about the areas in
which sees representatives of G20 and V20 countries, which climate change is influencing weather extremes.
civil society, insurers, scientists and academics working Munich Re, for instance, supports a research project which
together to help make the most vulnerable people more uses models to investigate the extent to which specific
resilient. severe weather events have become more probable since
pre-industrial times as a result of climate change. Should
The fact is the global temperature continues to rise. After this research continue to produce good results, measures
the previous three record-breaking years, 2017 became to prevent and adapt to the effects of climate change
the warmest non-El Niño year on record. According to can be tailored further to better protect people and goods.
the Intergovernmental Panel on Climate Change (IPCC),
the increase in temperature that has principally occurred Munich Re’s loss statistics also demonstrate the plausibility
since the second half of the last century is primarily caused of climate change already influencing some types of
by humans and is influencing natural disasters. Following event in a number of regions. By way of example, losses
a number of years with low losses, 2017 brought with it caused by severe thunderstorms in North America and
a series of devastating hurricanes that reminded us of the Europe have increased significantly – even after past loss
incredible damage that natural catastrophes can cause. amounts have been adjusted to today’s higher values.
Given that meteorologists have also observed changes in
But such individual events cannot be definitively attributed such weather patterns, it stands to reason that climate
to climate change. The research community expects change has played a role in the increased losses. Our data
climate change to result in a greater number of very severe also illustrates that prevention works. Protective measures
storms, even if the actual number of hurricanes does not such as flood control for rivers and more stringent building
increase overall. As it were, 2017 has given us a taste of regulations help to reduce losses.
what could be in store for us in the future.
And significant progress has been achieved thanks to
I do not by any means want to trivialise the progress made innovations in financial risk prevention, for example by
at previous climate summits. Indeed, great successes way of new coverage concepts. Thanks to insurance,
achieved include the 1997 Kyoto Protocol with its Frame- poor island states in the Caribbean now receive millions
work Convention on Climate Change; the Copenhagen in payouts no later than two weeks after a hurricane. This
Accord to limit global warming to two degrees; and the money can be used for emergency relief efforts and to
2010 launch of the Loss and Damage work programme rebuild infrastructure. Similar insurance pools to the
with the Green Climate Fund (GCF) in Cancún, which Caribbean’s CCRIF exist in Africa and the Pacific. Munich Re
aims to provide non-industrialised countries with support was already thinking along these lines back in 2005 when
for climate finance and climate change adaptation. it founded the ”Munich Climate Insurance Initiative”
Climate insurance can go a long way to helping develop- (MCII) think tank. The MCII has been hugely successful:
ing countries in this regard, and the resolution passed at the Bonn Climate Change Conference, the UNFCCC
at the G7 summit in Elmau in 2015, namely to initiate a presented it with the Momentum for Change Award for its
project for the insurance of climate risks, aims at just that. microinsurance pilot project in the Caribbean.
By 2020, an additional 400 million people in developing
countries are to be given basic insurance cover against I am optimistic about the future: not about progress in
weather extremes. The InsuResilience partnership launched climate protection, as clearly too little is being done,
in Bonn is the logical next step. but because I see how people, societies and companies
are developing creative solutions to counter the risks of a
Politicians are now more aware of the acuteness of the changing climate. And also because insurers like Munich Re
problem than ever before, and commitments to reduce are willing to assume more risk and, in so doing, offer
emissions have never been so significant. But almost victims of disasters what they need – including financial
nothing is being done to prevent further climate change. assistance – to get them back on their feet. Of course, this
It is true that CO2 emissions have stagnated over the will not allow us to conquer the scourge of climate change
past few years. But they should have fallen. And it is likely – but it certainly helps us to mitigate its impact.
that they actually increased again in 2017. Meanwhile, we
continue to argue over how much industrialised countries
should assist developing countries in dealing with the
effects of climate change. And whether China should be
Munich Re Topics Geo 2017 23Catastrophe portraits
Spring frost
losses and climate
change – Not a
contradiction in
terms
Eberhard Faust and Joachim Herbold
Between 17 April and 10 May 2017, large
parts of Europe were hit by a cold snap that
brought a series of overnight frosts.
24 Munich Re Topics Geo 2017As the budding process was already In the second and third ten-day ussia. Repeated low pressure areas
R
well advanced due to an exceptionally periods of April, and in some cases move along this corridor towards
warm spring, losses reached historic even over the first ten days of May Europe, bringing moist and cold air
levels – particularly for fruit and 2017, western, central, southern and masses behind their cold fronts from
wine growers: economic losses are eastern Europe experienced a series Greenland and Iceland. Occasionally,
estimated at €3.3bn (US$ 3.6bn), of frosty nights, with catastrophic the high pressure area can extend
with around €600m (US$ 650m) of consequences in many places for far over the continent in an easterly
this insured. fruit growing and viticulture. The direction. The flow then brings dry,
worst-affected countries were Italy, cold air to central Europe from high
France, Germany, Poland, Spain and continental latitudes moving in a
Switzerland. Losses were so high clockwise direction around the high.
because vegetation was already well
advanced following an exceptionally It was precisely this set of weather
warm spell of weather in March that conditions with its higher probability
continued into the early part of April. of overnight frost that dominated from
mid-April to the end of the month.
For example, the average date of There were frosts with temperatures
apple flowering in 2017 for Germany falling below –5°C, in particular from
as a whole was 20 April, seven days 17 to 24 April, and even into the first
earlier than the average for the period ten-day period of May in eastern
1992 to 2016. In many parts of Ger- Europe. The map in Fig. 2 shows the
many, including the Lake Constance areas that experienced night-time
fruit-growing region, it even began temperatures of –2°C and below in
before 15 April. In the case of cherry April/May.
trees – whose average flowering date
in Germany in 2017 was 6 April – it High losses in fruit and wine
was as much as twelve days earlier
growing
than the long-term average (Fig. 1).
The frost had a devastating impact Frost damage to plants comes from
because of the early start of the intracellular ice formation. The cell
growing season in many parts of walls collapse and the plant mass
Europe. In the second half of April, then dries out. The loss pattern is
it affected the sensitive blossoms, therefore similar to what is seen after
the initial fruiting stages and the first a drought. Agricultural crops are at
frost-susceptible shoots on vines. varying risk from frost in the different
phases of growth. They are especially
Meteorological conditions sensitive during flowering and shortly
after budding, as was the case with
The weather conditions that fruit and vines in April 2017 due to
accounted for the frosty nights are a the early onset of the growing season.
typical feature of April, and also That was why the losses were so
the reason for the month’s proverbial exceptionally high in this instance.
reputation for changeable weather. In Spain, the cold snap also affected
The corridor of fast-moving upper air cereals, which were already flowering
flow, also known as the polar front, by this date.
Spring frost Europe
forms in such a way that the air
moves in over central Europe from Even risk experts were surprised at
About
northwesterly directions near Ice- the geographic extent and scale of the
20 countries land. This north or northwest pattern losses (overall losses: €3.3bn, insured
affected frequently occurs if there is high air losses: approximately €600m). Overall
Up to 80% pressure over the eastern part of the losses were highest in Italy and France,
fruit crop losses North Atlantic, and lower air pressure with figures of approximately a billion
over the Baltic and the northwest of euros recorded in each country.
Munich Re Topics Geo 2017 25Catastrophe portraits
Two basic concepts for frost these methods prove to be will In most countries, the government
depend on meteorological conditions, subsidises insurance premiums, which
insurance
which is precisely why risk transfer means that insurance penetration is
As frost has always been considered is so important in this sector. There higher. In Germany, where premiums
a destructive natural peril for fruit are significant differences between are not subsidised and frost insurance
and wine growing and horticulture, one country and the next in terms of density is low, individual federal states
preventive measures are widespread. insurability and insurance solutions. like Bavaria and Baden-Württemberg
In horticulture, for example, plants But essentially there are two basic have committed to providing aid to
are cultivated in greenhouses or concepts available for frost insurance: farms that have suffered losses –
under covers, while in fruit growing, including aid for insurable crops such
frost-protection measures include −−indemnity insurance, where hail as wine grapes and strawberries.
the use of sprinkler irrigation as well cover is extended to include frost or
as wind machines or helicopters to other perils
mix the air layers. Just how effective −−yield guarantee insurance covering
all natural perils
Agricultural losses from the frost events of April/May 2017
Non- Share of
Overall insured Insured insured
losses losses losses losses Most-affected crops
€m €m €m
Apples, wine grapes, pears, peaches,
Italy 1,040 800 240 23% cherries, plums
France 980 750 230 23% Wine grapes
Germany 345 330 15 4% Apples, wine grapes, pears, cherries, plums
Poland 330 328 2 1% Apples, pears, cherries, plums
Spain 253 181 72 28% Wine grapes, arable crops, fruit
Switzerland 175 175 – 0% Wine grapes, fruit
Austria 86 50 36 42% Apples, wine grapes
Belgium 55 54 1 2% Apples, pears
Netherlands 26 26 – 0% Apples
Other affected countries 50 48 2 4%
Total 3,340 2,742 598 18%
Source: Munich Re Agro
26 Munich Re Topics Geo 2017Beginning of sweet cherry flowering
Averaged over Germany, 1992–2017
Fig. 1: Beginning of sweet cherry flowering
Averaged over Germany, 1992–2017
30 April Deviation from long-term average in days 12
28 10
26 8
24 6
22 4
20 2
18 0
16 –2
14 –4
12 –6
10 –8
8 Trend shows ever-earlier –10
6 beginning of flowering
–12
4 –14
2 –16
1992 1996 2000 2004 2008 2012 2016
Source: Munich Re, German Meteorological Service, Phenological Statistics, 2017
Munich Re Source: German Meteorological Office, phenological statistics, 2017
LateFig.
frost following
2: Late a warm
frost following a warmspring
spring in Europe
April–May 2017
Large areas of Europe affected
Areas with
Areas withlowest
overnight lows under
temperatures –2°C,
below –2˚C,
11
11 April–10
April–10May
May2017
2017
Widespread spring
frost in Europe
Munich Re Data source: Joint Research Centre of the European Commission, MARS Explorer
Source: Munich Re, based on JRC MARS Explorer of the European Commission
Munich Re Topics Geo 2017 27Catastrophe portraits
Earlier apple flowering and last spring frost in Germany
Fig. 3: Earlier apple flowering and last spring frost in Germany
Illustration
Illustration of the
of the risk
risk
Beginning of apple flowering
Date of last frost
1960 1980 2000 2020 2040 2060 2080 2100
March
Shift in beginning of
flowering and late frost
determines the risk
April
May
Source: Munich Re, illustration not based on actual data
Munich Re, illustration not based on actual data
28 Munich Re Topics Geo 2017Late frosts and climate change Outlook
There are very clear indications that The spring frost in 2017 illustrated
climate change is bringing forward the scale that such an event can
both the start of the vegetation period assume, and just how high losses
and the date of the last spring frost. in fruit growing and viticulture can
Whether the spring frost hazard be. Because the period of vegeta-
increases or decreases with climate tion is starting earlier and earlier
change depends on which of the two in the year as a result of climate
occurs earlier. There is thus a race change, spring frost losses could
between these two processes: if the increase in the future, assuming
vegetation period in any given region the last spring frost is not similarly
begins increasingly earlier compared early. It is reasonable to assume
with the date of the last spring frost, that these developments will be
the hazard will increase over the long highly localised, depending on
term. If the opposite is the case, the whether the climate is continental
hazard diminishes. or maritime, and whether a location
is at altitude or in a valley.
Because of the different climate
zones in Europe, the race between Regional studies with projections
these processes is likely to vary based on climate models are still
considerably. Whereas the east is more in short supply and at an early
heavily influenced by the continental stage of research. However, one
climate, regions close to the Atlantic first important finding is that the
coastline in the west enjoy a much projected decrease in days with
milder spring. A study has shown that spring frost does not in any way
climate change is likely to significantly imply a reduction in the agricul-
reduce the spring frost risk in viticulture tural spring frost risk for a region.
in Luxembourg along the River Moselle1, So spring frosts could well result
where the number of years with spring in greater fluctuations in agricul-
frost between 2021 and 2050 is tural yields. In addition to preven-
expected to be 40% lower than in tive measures, such as the use
the period 1961 to 1990. of fleece covers at night, sprinkler
irrigation and the deployment
By contrast, a study on fruit-growing of wind machines, it will therefore
regions in Germany2 concluded that be essential to supplement risk
all areas will see an increase in the management in fruit growing and
number of days with spring frost, viticulture with crop insurance that
especially the Lake Constance region, covers all natural perils.
where reduced yields are projected
until the end of this century. At the
same time, however, only a few pre-
liminary studies have been carried out
on this subject, so uncertainty prevails.
1 Molitor et al. (2014): Late frost damage risk for
viticulture under future climate conditions: a
case study for the Luxembourgish winegrowing
region. Journal of Grape and Wine Research, 20,
160–168
2 Chmielewski et al. (2010): Climate change and
possible late frost damages to apple trees in
Germany. In Matzarakis et al.: Proceedings of
the 7th Conference on Biometeorology, 50–56
Munich Re Topics Geo 2017 29Catastrophe portraits
Asian floods
overshadowed by
Houston deluge
Wolfgang Kron
In late August 2017, while the global media’s
attention was focused on the floods in
Houston, people on the other side of the world
were experiencing even worse misery from
torrential rainfall. An exceptionally powerful
monsoon in South Asia claimed the lives of
almost 2,700 people and caused severe
damage to the region’s agriculture.
30 Munich Re Topics Geo 2017Each year in late May, the summer Worst floods for 15 years time extended over a much larger
monsoon starts at the southern tip area. Mumbai may now be better
of India and spreads northwards. The 2017 monsoon was exceptional, equipped to deal with flooding than
Over the course of the following four both in terms of its duration and it was in 2005, but flood alerts are
months, enormous quantities of impact. In Nepal, the rainy season still being issued too late. There are
rain – roughly three quarters of the lasted from 12 June to 16 October, no emergency plans in place and,
annual precipitation – fall on the instead of until around 23 September most importantly, unrestricted and
subcontinent. This rain brings flood- as it normally does. The 127 days made uncontrolled development is taking
ing and destruction – and not just in it 20% longer than normal and almost place on natural drainage paths.
areas that experience extreme rain- as long as in the record year of 2008
fall. Normal life also grinds to a halt (130 days). On the other hand, the In West Bengal and Bangladesh, the
along the Ganges, Brahmaputra total amount of rain was not excep- extensive flooding resulted less from
and other rivers, along which huge tional: an average of 1,330 mm of rain local rainfall than from the waters
masses of water roll for hundreds of fell across all of Nepal, equivalent to carried down by rivers flowing from
kilometres down towards the Indian 92% of the usual amount. the north.
Ocean.
However, a local and time-resolved Almost no damage insured
analysis presents a different picture.
Due to orographic lift, the largest More than 40 million people were
amount of rain falls in regions close affected by the floods in India, Nepal
to the Himalayas – with extreme and Bangladesh between the start
temporal variations in intensity. The of June and mid-October. At least
areas worst affected in 2017 included 2,670 people died (2,170 in India,
the Indian provinces of Assam, 160 in Nepal, 340 in Bangladesh),
Uttar Pradesh – India’s most densely with dozens of lives being claimed by
populated province and home to landslides in the mountains of Nepal.
220 million people – and Bihar, as
well as the Terai plains in Nepal. The bulk of the losses were incurred
in the northeastern part of South
Terai is a lowland region between 25 Asia. Of the overall losses of around
and 100 kilometres wide running for US$ 3.5bn, some 2.5bn occurred in
some 800 kilometres along the border India, 600m in Nepal and 350m in
with India. It makes up 17% of the area Bangladesh. The percentage of
of Nepal, is home to half of the coun- insured losses was negligible in
try’s population, and includes 53% all three countries. While these may
of the arable land area. In the twelve be small amounts in comparison
districts affected, three quarters of with the hurricane losses in North
the land was under water. According America, they affect countries where
to the United Nations, these were the people’s livelihoods are already
worst floods for 15 years. extremely vulnerable and unstable.
There was also flooding in other In Nepal, agriculture and livestock
regions triggered by torrential rain. farming was badly hit: 40 million
Twelve years after the 2005 disaster, hectares of land was flooded and
the west coast megacity of Mumbai 70,000 domestic and farm animals
was again hit by floods, with 315 mm perished. Virtually nothing was insured.
Flood South Asia 2017
of rain falling in the space of twelve Farmers are generally reluctant to take
hours on 29 August. Even though out insurance, and are also unwilling
2m houses this was only one third of the 24-hour or unable to make other provisions.
damaged/destroyed rainfall experienced on 26 July 2005, A survey carried out by the United
40m people affected the city once again found itself sub- Nations in Terai in October 2017 found
merged in the floodwaters, which this that only one third of respondents
Munich Re Topics Geo 2017 31Catastrophe portraits
Mitigation Institute (AIDMI) have
long recognised that insurance
against flood risks – whether in its
traditional form or as microinsurance
– makes an invaluable contribution
to disaster management. Even if
cultural obstacles still exist, there is
enormous potential for change.
India, for example, has achieved
substantial improvements through
the introduction of crop insurance.
Increasing resilience
South Asia is representative for
the many poorer regions of the
world that were hit by flood dis
asters over the last year. Southern
Thailand, Peru, Colombia, Sierra
had made any provision against flood potential flood zones along the banks Leone and the Congo were also
losses, even though 56% had suffered of rivers, while in Bangladesh three affected. In absolute terms, losses
losses in previous years. quarters of the country is affected. are often one or two orders of
More than half the population of Nepal magnitude smaller than in Europe
In addition, electricity generation lives in the flood zones that make up or North America. Yet the impact
from hydropower was severely 20% of the country’s total area. on people’s lives and livelihoods in
restricted. Enormous quantities of these poorer countries is generally
sediment in the rivers blocked hydro- In addition to the direct risk of much more dramatic, given the
power intake structures, posing a drowning, there are frequent fatalities frequent lack of insurance cover
risk of damage to the turbines. There from electric shocks, particularly in that could otherwise cushion the
were also countless bridges damaged cities. Wading through heavily negative consequences. It has been
and culverts blocked by debris. In polluted water can result in bacterial shown time and again that countries
the Sauraha Safari Park in the south- infections (especially leptospirosis) with an effective insurance system
west of Nepal, 110 hotels were forced that are often fatal. House foundations against natural hazards are able to
to close. The majority of the small are undermined or weakened to the return to normal conditions after a
amount of insured losses were at point where they collapse. disaster much faster than countries
industrial facilities (warehouses), in without any such protection in place.
the construction and engineering A lack of available options is often
sectors, or affected motor vehicles. the reason that few preventive Whereas the trail of devastation in
measures are taken. People do not the flood regions of Asia and Africa
In Bangladesh, numerous rivers burst have enough financial resources, could still be seen weeks and
their banks and vast areas of this and there is insufficient help from even months after the event, life
extremely flat country were inundated. government agencies to identify and in Houston had almost returned to
Roads, bridges, railway lines and implement appropriate solutions. normal just a few days after the
over 750,000 houses were damaged, What is more, direct initiatives on the flooding. Apart from one or two
with over 100,000 destroyed. part of the state are rare. Yet it is an tell-tale signs, it was difficult to
undisputed fact that prevention find any evidence that large parts
Governments struggle to cope saves money and alleviates suffering of the city had been a metre deep
with disaster management and distress. Governments are in water a short time before. So
under an obligation to create at least the primary goal of the countries
India, Nepal and Bangladesh are rudimentary structures (and thereby affected must be to reduce the
among the countries with the highest assume a role model function), on vulnerability of their citizens and
flood risk. Some 12% of the territory which the population can then build. to make existing systems more
of India (400,000 km2) is made up of Institutions like the All India Disaster robust and resilient.
32 Munich Re Topics Geo 2017You can also read