A strategy to reduce and replace live animal transport - Towards a meat and carcasses only trade
←
→
Page content transcription
If your browser does not render page correctly, please read the page content below
A strategy to reduce and
replace live animal transport
Towards a meat and carcasses only trade

                   Towards a meat and carcasses only trade 1
Abbreviations
   • AGRI Committee – The European Parliament’s Committee on Agriculture and Rural Development
   • BSE – Bovine Spongiform Encephalopathy
   • BTSF – Better Training for Safer Food
   • CAP – The Common Agricultural Policy
   • DG SANTE – The Directorate-General for Health and Food Safety
   • EAFRD – European Agricultural Fund for Rural Development
   • EC – The European Commission
   • EFSA – The European Food Safety Authority
   • EIP-AGRI – The European Innovation in Agriculture Network
   • EP – The European Parliament
   • EU – The European Union
   • Extra-EU trade – trade with all countries except for the Member States
   • FAO – The Food and Agriculture Organization of the United Nations
   • FVE – The Federation of Veterinarians of Europe
   • Intra-EU trade – trade within the Member States
   • NSA – The National Sheep Association (United Kingdom)
   • NVWA – The Dutch Food and Consumer Product Safety Authority
   • OIE – The World Organisation for Animal Health
   • PDO/PGI – Protected Designation of Origin / Protected Geographical Indication
   • TRACES – Trade Control and Expert System (EU)
   • UECBV – The European Livestock and Meat Trading Union

   • WTO – The World Trade Organization

Published by Eurogroup for Animals.
Co-authors: Francesca Porta, based on a technical report by AgraCEAS Consulting

Eurogroup for Animals encourages the use, reproduction and dissemination of material in this information product,
provided that appropriate acknowledgement of the source and copyright holder is given.

© Eurogroup for Animals 2019
Version 1, 18th November 2019
“The European Parliament calls on the Commission to develop a
              strategy to ensure a shift from live animal transport to a mainly
              meat-and-carcass and germinal products trade, given the
              environmental and animal welfare and health impacts of live
              animal transport; considers that any such strategy must address
              the economic factors that influence the decision to transport
              live animals; calls on the Commission to include transport to
              third countries in this strategy...”
              European Parliament, 2019. Implementation Report on the transport
              of live animals both within and outside the European Union.

              “The Commission will foster a dialogue to explore possible tools
              for shifting towards trade in meat, when feasible, as well as the
              facilitation of trade in animal products”
              European Commission, 2019. Follow-up to the European Parliament
              non-legislative resolution on the protection of animals during
              transport within and outside the EU.

A strategy to reduce and
replace live animal transport
Towards a meat and carcasses only trade

                    Towards a meat and carcasses only trade 3
Table of contents
Executive Summary 5
Introduction 7
1. Mapping the long-distance trade in live animals 9
1.1. The intra-EU trade 9
1.1.1 The intra-EU trade of live cattle 10
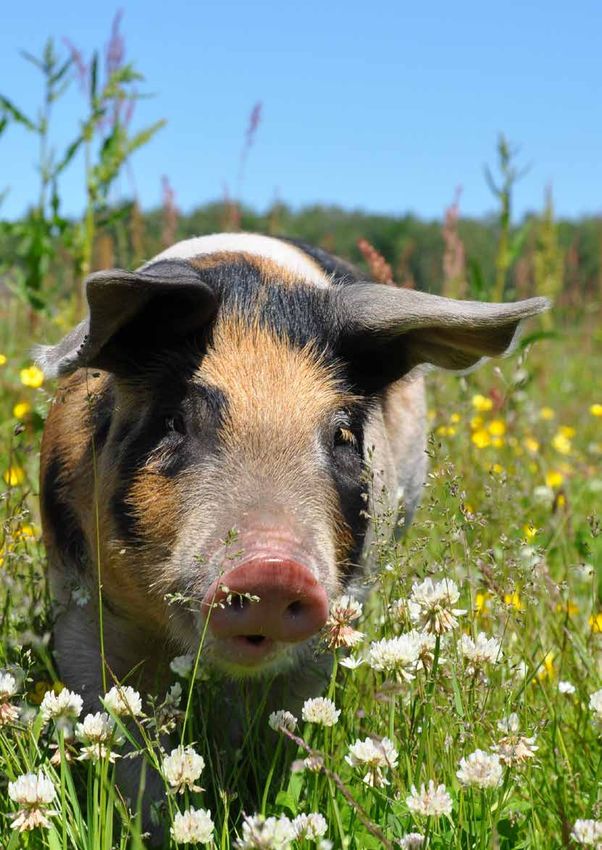
1.1.2 The intra-EU trade of pigs 11
1.1.3 The intra-EU trade of sheep/goats 12
1.2. The extra-EU trade 12
1.2.1 The extra-EU trade of live cattle 13
1.2.2 The extra-EU trade of pigs 14
1.2.3 The extra-EU trade of sheep/goats 14
2. What is driving live animal transport? 17
2.1. The driving forces behind live animal trade 17
2.2. The EU slaughter sector 18
2.2.1. Major developments in the EU slaughter sector
and their impact on live animal transport 18
2.3 Country of origin labelling 21
3. Rationale for replacing live trade with the transport of meat and carcasses;
examples of best practice in effecting this change 23
3.1. Rationale for reducing live trade 23
3.2. Why shift to a meat and carcasses only trade? 23
3.2.1 Economic considerations 23
3.2.2. Environmental considerations 24
3.2.3. Animal health and welfare considerations 24
3.2.4. Common practice 24
3.3. Examples of attempts to reduce live trade 25
4. A strategy to replace the live transport trade 29
4.1. Strategy for reducing live trade - questions to ask 29
4.2. Strategy to mitigate the driving forces of live transport 30
4.2.2 Addressing slaughterhouse availability: promoting initiatives to
develop mobile and semi-mobile slaughter options 32
Conclusion 35
Bibliography 36-37
ANNEXES 38-58
A strategy to reduce and replace live animal transport 4
Executive Summary
Over the years, leading bodies such as the World                          and embryos trade. This trade is already a reality and should
Organisation for Animal Health (OIE), The Food and                        be systematically promoted and implemented for animal
Agriculture Organization of the United Nations (FAO), The                 health and welfare, economics and environmental reasons.
European Food Safety Authority (EFSA) and the Federation                  To this end, this report highlights potential policy, structural
of Veterinarians of Europe (FVE) have been calling for a                  and financial initiatives that, by negating the drivers of live
strategy to shift to a meat and carcasses trade to gradually              trade, should be taken into account in developing a strategy
phase out live animal transport. They base the rationale of               to shift to a meat and carcasses-only trade. This is further
this transition on animal welfare and health grounds.                     substantiated by examples where live trade has been
                                                                          reduced. It recommends looking into the following initiatives:
However, despite this scientific advice, an increase in the
                                                                              • Improving slaughterhouse availability with a range
transport of live cattle, sheep/goats and pigs was registered
                                                                                 of possible solutions, including support via the
both intra-EU and extra-EU since 2005. Indeed, between
                                                                                 European Agricultural Fund for Rural Development
2014-2017 the transport of these species across the EU
                                                                                 (EAFRD) funding for the opening of local/regional
increased by 14.2%, confirming a trend that, according to
                                                                                 slaughterhouses; the development of mobile
Trade Control and Expert System (TRACES) data, started
                                                                                 slaughter facilities; and supporting the case for on-
in 2005. The same evolution affected the EU export of live
                                                                                 farm slaughtering - under appropriate biosecurity
animals. TRACES data shows that overall the number of                            and animal welfare conditions - to mitigate the lack of
live animal consignments exported from the EU increased                          availability of slaughterhouses in key areas of livestock
substantially between 2005 and 2015, with the growth                             production.
consolidating between 2012 and 2017.
                                                                               • Encouraging the use of embryos and semen rather
By analysing the trade flows and other data available, this                        than breeding animals and the use of “closed”
report provides an overview of the supply and demand                               farming systems which do not involve the separation
factors sustaining the intra- and extra-EU trade. In the case                      of the different stages of production, and in which
of the intra-EU trade, key issues are the structure of livestock                   replacement animals are bred on-farm. Support could
production, characterised by an increasing specialisation                          be available via EAFRD funding.
of production and separation into breeding and fattening                       • Providing assistance to improve cold chain capacity in
enterprises, and slaughterhouse availability, as well as                           major third country live export markets. Investment
capacity.                                                                          support could be provided under EU development aid
                                                                                   programmes.
Slaughterhouse availability is considered one of the major
reasons that live animals are still transported alive across the               • Supporting the transport of meat in carcasses or
EU. Despite the lack of systematic data on the number and                          primal cut form (rather than broken down into cuts),
structure of slaughterhouses across the EU, case studies make                      not only to address consumer demand for cutting to
it clear that the EU slaughter sector has been undergoing,                         local or traditional tastes, but also to promote EU-
and continues to undergo, a process of transition towards                          based added value activities. To this end, the industry
fewer but larger slaughterhouses. This has been driven by                          in exporting Member States can produce guidelines
                                                                                   and use standards that provide the exact specifications
the need to achieve economies of scale (a proportionate
                                                                                   of carcasses or primal cuts required in importing
saving in costs gained by an increased level of production),
                                                                                   markets in the EU and in third countries. This could be
as slaughterhouses operate on small margins and high
                                                                                   supported using export promotion funds. Investments
throughput. It also tends to be more efficient for larger
                                                                                   in the cold chain in importing countries would help to
slaughterhouses to meet the standards required by the EU’s
                                                                                   mitigate concerns over freshness, thereby improving
2006 Hygiene Package. Larger slaughterhouses inevitably
                                                                                   consumer trust in the meat and carcasses trade. This
need to source supply from a wider geographical area to
                                                                                   could be further supported by marketing campaigns.
ensure they continue operating close to the full capacity that
will enable them to achieve these economies of scale. This                     • Supporting training on ritual slaughter with reversible
has resulted in longer journey times for live animals.                             pre- slaughter stunning in the EU to reduce demand
                                                                                   for live animals in third countries. Under the EU Better
This report builds on the 2019 call by the European Parliament                     Training for Safer Food (BTSF), training for Competent
(EP) echoed by the European Commission (EC), to formulate                          Authority staff responsible for controls in this area
a strategy to shift to meat and carcasses as well as the semen                     could be provided.

                                                  Towards a meat and carcasses only trade 5
A strategy to reduce and replace live animal transport 6
Introduction
The EU has had rules governing animal welfare during                    into force, its main aim - the protection of animals during
transport since 1977 (Directive 77/489/EEC). However, it                transport - is not being met.
was with Council Directive 95/29/EC in 1995 that provisions
of animal welfare, such as maximum travelling time and                  Confronted with this evidence, the EP in the Resolution of
maximum stocking density, were introduced. Since 2007                   14 February 2019 on the implementation of the Transport
the transport of live animals has been regulated via Council            Regulation, called for replacing the transport of live animals
Regulation (EC) No 1/2005 (the Transport Regulation).                   with the trade of meat and carcasses, as well as semen and
Indeed, the EU judged it to be more appropriate to set out              embryos. This call is echoed by experts recommending to
the community rules governing live transport in a Regulation.           phase out live animal transport, including the Federation
                                                                        of Veterinarians of Europe (FVE), the World Animal Health
Today, the Transport Regulation applies to all livestock                Organisation (OIE) and The European Food Safety Authority
transport within and from the EU, regulating the rest periods,          (EFSA).
the training and authorisation of drivers, stocking densities
and general transport conditions. Unfortunately, the vast               In line with this scientific advice and the call of policy
number of derogations still allow animals to be transported             makers, this report provides an overview of the trade flows
for days on end throughout and outside Europe. Additionally,            and identifies and analyses what is driving the transport of
the enforcement of existing rules is very poor and control by           animals. It puts forward proposals on how to mitigate those
public authorities is scarce, leading to very poor compliance           drivers with the aim to facilitate the transition to a meat and
and animal suffering. Twelve years after the Regulation came            carcasses-only trade.

                                                Towards a meat and carcasses only trade 7
A strategy to reduce live animal transport 8
1 Mapping the long-distance trade
in live animals
This chapter provides an overview of the major intra-                              To some extent, this reflects the enlargement of the EU from 25
EU (within the Member States) and extra-EU (from the                               Member States in 2005 to 28 in 2013. This had implications in
Member States to non-EU countries) trade routes with                               terms of live animal transport, as the geographical expansion
regards to the transportation of cattle, pigs and sheep/                           of the EU inevitably increased the distances involved in what
goats. The definitions, the sources and the methodology                            is now intra-EU trade.
used for the data extraction are reported in Annex I Chapter
1. Maps on trade flows are presented in Annex I Chapter 2.                         The data also shows an increase in the average number
                                                                                   of animals per consignment for cattle and for pigs, but a
1.1. The intra-EU trade                                                            reduction in the average number for sheep/goats. While
                                                                                   the total number of consignments has remained stable or
                                                                                   increased only slightly for all species during this period, there
    In summary:                                                                    are differences between species in the trend of the number
    In the period 2005-2015:                                                       of animals. For cattle it has increased slightly; for pigs it has
    • Intra-EU trade flows (number of animals) have                                doubled; and for sheep/goats it has decreased.
         increased for pigs, it remained relatively stable
         for cattle, and it decreased for sheep/goats;                             The number of consignments3 involved in long-distance
         Long distance journeys (>8 and ≤24/29 hours)                              transport (of more than 8 and less than 24/29 hours)
         and very long distance journeys (>24/29 hours)                            has increased. Again, to some extent this reflects the EU’s
         have increased in absolute terms (number of                               enlargement to the east. Indeed, the biggest increase in long-
         consignments, all species), while long distance                           distance journeys (+80%) occurred between 2005 and 2009,
         journeys have also increased in relative terms (as a                      after the accession of Bulgaria and Romania to the EU (2007);
         % share of all consignments);                                             followed by a smaller increase (+15%) between 2009 and
    • The number of long-distance journeys increased                               2015. Their share of all consignments has consequently risen
         relatively more than the number of short-distance                         from 21% in 2005 to 29% in 2015.
         journeys (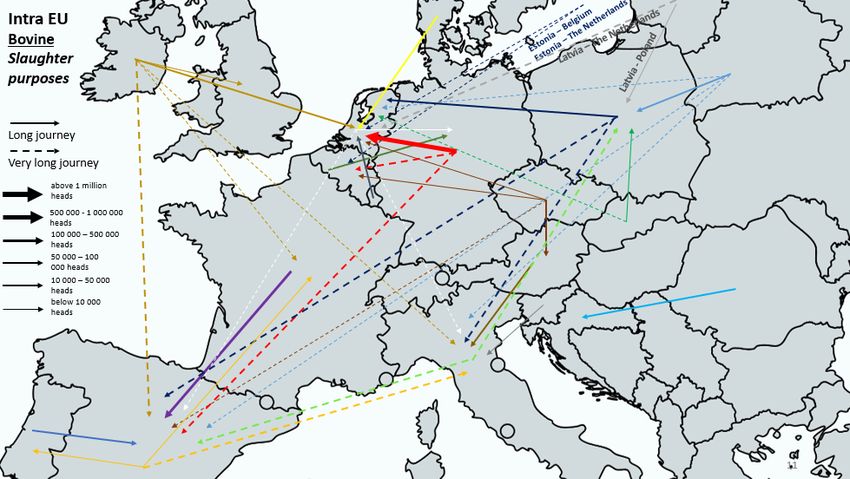
Intra-EU
                     Major trade
                     flows - all
                     species

                                                                                    Czech Republic, Belgium, and Romania. It is noted that
1.1.1 The intra-EU trade of live cattle (2014-2017)
                                                                                    French exports accounted for 35%4 of total cattle exports for
                                                                                    purposes other than slaughter, whereas Germany exported
                                                                                    35% of total cattle for slaughter exports.5
       In summary:
       Major exporters: France, Germany, the
                                                                                    Key importers of cattle within the EU include Italy, the
       Netherlands
                                                                                    Netherlands and Spain, which together accounted for 70% of
       Major destinations: Italy, the Netherlands, Spain
                                                                                    total intra-EU export destinations (2016-2017 average); their
       Live cattle intra-EU trade increased by 8.3% over the
                                                                                    share has slightly dropped, from 72% of total intra-EU export
       period 2014-2017, from 3,564,206 animals in 2014 to
                                                                                    destinations (2014-2015 average). Other major destinations
       3,860,653 in 2017.
                                                                                    within the EU include Belgium, Poland and Germany.

                                                                                    Given the significance of these destinations, the following
The increase was driven by considerable growth in exports of
                                                                                    flows are identified for intra-EU trade (the percentages shown
cattle for other purposes; that is to say, not animals meant to
                                                                                    represent the country's share of the average number of
be immediately slaughtered. These include replacements for
                                                                                    imported cattle for 2016-2017, unless otherwise indicated):
the dairy herd or animals for further fattening, for example.
Total volumes of exported cattle for other purposes rose by
                                                                                         • For slaughter: key destinations are the Netherlands
21% in 2014-2017. In contrast, exports of cattle for slaughter
                                                                                            (48%) and Spain (24%), followed by Belgium (13%).
remained relatively stable, noting only moderate growth
                                                                                            Dutch imports have been on a gradual decline, from
(+3%). Nonetheless, cattle for slaughter constitute just
                                                                                            almost 800,000 animals in 2014 to just over 660,000
over half of the total number of cattle exported to other EU
                                                                                            in 2017, while both Spanish and Belgian imports have
countries, although their share has dropped slightly over the
                                                                                            been increasing. In Spain, imports increased from
period (from 56% in 2014 to 53% in 2017).
                                                                                            over 280,000 animals in 2014 to 370,000 in 2017, and
                                                                                            in Belgium from almost 150,000 animals (2014) to
France is the major exporter of cattle to other EU countries,
                                                                                            185,000 (2017).
followed by Germany and the Netherlands. These three
main exporters accounted for 63% of total exports (2016-
2017 average); furthermore, their shares increased from
58% in 2014-2015. Other major exporters are Lithuania,

4
    Average of 2016-2017; without changes in comparison to 2014-2015 average.
5
    2016-2017 average.

                                                    A strategy to reduce and replace live animal transport 10
• For other purposes (incl. fattening): key destinations Bearing in mind these shares of trade flows, the highest
are Italy (73%), followed by Spain (19%). Both growth was recorded in exports from the Netherlands to
Italian and Spanish imports have been on a stable Germany, as the number of exported pigs grew by 42%
and continuous rise in 2014-2017. In Italy, imports (2016-2017 average was 7.4 million animals, compared
increased from 840,000 animals in 2014 to almost to 5.2 million in 2014-2015 average). The increase has not
900,000 in 2017, and in Spain from 220,000 animals in been stable; this route was characterized by a drop of 16%
2014 to 250,000 in 2017. between 2014 and 2015 and a considerable rebound in
2016, with a 50% increase.
Some Member States are both significant exporters and
importers of live cattle, for example the Netherlands, Spain,
Similarly, exports from Denmark to Poland expanded, with a
Belgium and Germany, but these simultaneous flows tend
35% increase in the number of pigs exported (the 2016-2017
to be for different purposes. For example, the Netherlands
average was almost 5.6 million animals, in comparison to 4.1
imports animals mainly for slaughter and Belgium mainly for
million in 2014-2015). Even in the last two years for which
breeding/fattening, whereas Spain imports live animals for
data are available - 2016 and 2017 - this route recorded a
both slaughter and breeding/fattening. This reflects the level
significant increase of 26% in the number of animals being
of specialisation in the EU livestock industry and livestock
transported.
products supply chain.
It should be noted that Denmark exports all its pigs to the
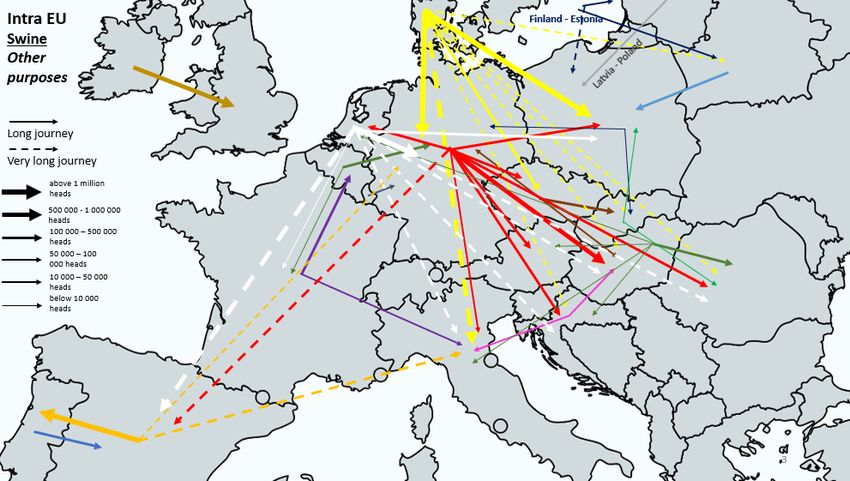
1.1.2 The intra-EU trade of pigs (2014-2017) UK as carcasses.
Although the Eurostat data set does not allow the purpose
In summary: of these trade flows to be identified, CIWF described some
Major exporters: Denmark, the Netherlands significant trade flows, for the year 2016, as follows:
Major destinations: Germany, Poland • The Netherlands exports around 1.75 million pigs a
Live pig intra-EU trade increased by 15.3% over the year to Spain, Italy and Central and Eastern Europe.
period 2014-2017, from 30,225,267 animals in 2014 to Most are young pigs going for further fattening, but
34,834,756 in 2017.6 some are being sent direct for slaughter.
• Denmark exports 4.8 million pigs a year to these
The growth in the intra-EU trade of pigs was mostly driven countries. Again, most are young pigs going for further
by the increase in exports from the Netherlands, Denmark, fattening, although some are being sent for slaughter.
Ireland and Belgium. Denmark and the Netherlands are by
far the most prominent exporters of pigs to other Member
States, accounting for 74% of total intra-EU exports (2015-
2016 average). Their shares have risen by 6% in comparison
to the 2014-2015 average. Other noteworthy exporters
(2015-2016 average) include Germany (7%, although this
represents a considerable drop in comparison to the 2014-
2015 average), Spain (4%), Belgium (3%) and Ireland (3%).
Germany and Poland are by far the most prominent
importers of pigs from other EU countries. Indeed, these
two countries accounted for 64% of total intra-EU imports
(2016-2017 average); moreover, their shares rose by 2%
in comparison to the 2014-2015 average. Other major
importers include Hungary, Italy, the Netherlands (all 5%),
followed by Belgium and Portugal (both 4%).7
6
The Eurostat data provided for pigs does not distinguish between animals for slaughter, and ‘other purposes’ (i.e. breeding, fattening, etc.). Only one data set
(“for other purposes,”) which includes slaughter and/or fattening is available.
7
In terms of 2016-2017 average.
Towards a meat and carcasses only trade 111.1.3 The intra-EU trade of sheep/goats (2014-2017) It is believed that the majority of the sheep exported across
the EU are for immediate slaughter.
In summary:
1.2 Extra-EU trade
Major exporters: Romania, Hungary, France,
Spain
Major destinations: Italy, Greece, Spain
In summary:
Live sheep/goat intra-EU trade increased by 10.8%
In the period 2005-2015:
over the period 2014-2017, from 2,886,492 animals • Extra-EU trade flows (number of
in 2014 to 3,198,881 in 2017.8 animals) have increased for cattle and sheep/
goats and decreased for pigs.
• The 87% (11,578 consignments) of the trade with
third countries are EU exports of cattle.
Romania, Hungary and France, followed by Spain, accounted
for 74% of total intra-EU exports (2016-2017 average) and In the period 2014/2015 -2016/2017:
the total share of these four countries has remained stable • The extra-EU trade flows have increased for
in comparison to 2014-2015. Romanian exports recorded a live cattle (+88.3% of animals. The period of
growth of 3%, whereas both Hungarian and French exports reference for cattle is 2012/2015-2016/2017),
declined by 2%. and sheep/goats (+17% of animals). A decrease
was registered for pigs (-42%).
Key importers of sheep/goats within the EU include Italy,
Greece and Spain, followed by France, Ireland and Germany.
The top three importers accounted for 64% of total intra-
The extra-EU trade mainly consists of exports from the EU
EU imports (2016-2017 average), although their share has
to third countries (i.e. EU imports from third countries are
dropped by 3% in comparison to the 2014-2015 average.
minor/limited). Analysis of the number of consignments9
Imports by France, Ireland and Germany accounted for
(imports and exports, for all three species) indicates that,
8%, 7% and 6% respectively (2016-2017 average), with
during the 2005 to 2015 period, exports to third countries
considerable growth in German imports (5%) and a decline
increased. This growth was driven mainly by exports of
in French imports (3%).
cattle, which rose both in absolute and relative terms.
Trade routes for intra-EU live sheep/goat flows appear to be
Although exports of cattle fluctuated significantly year-on-
stabilized and are characterized by continuous and moderate
year during the period, between the years 2005 and 2015
growth in established routes, for example: Romania–Greece;
they increased threefold. As a share of all consignments of
Romania–Italy; France–Italy; Hungary–Italy; Spain–France. It
live animals (i.e. the total for the three species), exports of
is noted that some countries are both significant exporters
cattle increased from 76% in 2005 to 92% in 2015.
and importers, for example France and Spain.
The trade of pigs and sheep/goats with third countries
Although the Eurostat data set does not allow the purpose
was low and fluctuated substantially each year. Exports
of these trade flows to be identified, CIWF described some
of pigs fell in 2014/2015 to half the 2005 volume, despite
significant trade flows for the year 2016 as follows:
annual fluctuation in the interim period. While in 2005
• Almost 850,000 lambs and sheep a year are sent
the consignments of pigs respresented 22% of the total
from Hungary, Romania, Poland and Spain to Italy
consignments of live animals for all three species, this
for slaughter.
percentage fell to 5% in 2015.
• Around 300,000 lambs and sheep a year are sent from
Hungary and Romania to Greece for slaughter. Exports of sheep/goats also increased nearly threefold
8
The Eurostat data provided for sheep/goats does not distinguish between animals for slaughter, and ‘other purposes’ (i.e. breeding, fattening, etc.). Only one
data set (“for other purposes,”) which includes slaughter and/or fattening is available.
9
TRACES data on extra-EU exports from this source were only available in terms of number of consignments, not in number of animals. Hence, for extra-EU
trade, this source cannot be directly compared to Eurostat data.
A strategy to reduce and replace live animal transport 12between 2005 and 2015, albeit from a relatively low base in France and Austria, followed (in recent years) by Hungary
relation to the other species. As a share of all consignments and the Czech Republic. The three main exporters account for
of live animals (i.e. the total for the three species), exports 54% of total EU exports (2016-2017 average), but their share
of sheep/goats remained relatively low at 2% in 2005 and has fallen (2012-2015 average: 76%). In 2016-2017 several
3% in 2015. Member States (notably Hungary, Czech Republic, Ireland,
Croatia, Bulgaria and Slovakia) started to play an increasingly
important role in cattle exports to third countries.
1.2.1 The extra-EU trade of live cattle (2015-2017)
Key destinations for EU exports of cattle to third countries
In summary: are Turkey, Israel and Lebanon. These three main destinations
Major exporters: Germany, France, Austria, receive 75% of total EU exports (2016-2017 average); their
Hungary, Czech Republic share has increased compared to 2012-2015 average (68%).
Major destinations: Turkey, Israel, Lebanon, Libya This is mainly due to the increase in exports to Turkey and
Live cattle extra-EU trade increased by 88.23% over Israel, which in 2016-2017 have more than doubled the
the period 2012/2015-2016/2017, from 425,000 average levels of 2012-2015. Exports to Lebanon, Libya
animals (2012-2015 average) to just under 800,000 and Egypt have also increased, although by relatively more
(2016-2017 average). modest amounts (in terms of the number of animals and
relative share of EU total exports to third countries).
Bearing in mind the importance of these three destinations,
Cattle exports to third countries have nearly doubled, with
the following main flows are identified for EU exports of
the latest trend in 2015 to 2017 showing a systematic
cattle (the percentages represent the share of average
increase, following a decrease in 2013-2014.
number of exported animals for 2016-2017, unless otherwise
indicated):
The increase is mainly driven by exports of cattle for
• for breeding (dairy): key destination is Turkey (66%);
breeding purposes (presumably for the dairy herd) and for
fattening, which in 2016-2017 were nearly 2-3 times the • for fattening: key destinations are Turkey (41%) and
2012 levels. By contrast, exports of cattle for slaughter fell Israel (39%);
dramatically in 2013 and have since progressively recovered
• for slaughter: key destinations are Lebanon (43%),
to slightly exceed 2012 levels in 2017. Consequently, the
Libya (22%) and Turkey (17%); several other
share of animals for slaughter has fallen in 2017 to 34% of
destinations (for example Algeria and Morocco)
total EU cattle exports to third countries, from 53% in 2012.
share the remaining 18%. In some cases (for
Key exporters of cattle to third countries are: Germany,
example Turkey), flows are not systematic over time:
Towards a meat and carcasses only trade 13both the number of animals and the exporting EU 1.2.2 The extra-EU trade of pigs (2015-2017)
countries can fluctuate enormously from year to year.
Examples of flows of EU exports of cattle for slaughter
to the most important destinations include: In summary:
Major exporters: Croatia, Hungary, Greece,
o Lebanon: major and relatively systematic Germany
flows, both in terms of the number of animals Major destinations: Albania, Serbia
and origin countries. In 2017 the EU exported Live pig extra-EU trade decreased by 42% over the
106,000 animals to Lebanon, while in previous period 2014/2015-2016/2017, from 480,000
years the number ranged from between 74,000 animals (2014-2015 average) to nearly 290,000
(2013) to 135,000 (2015). In 2017 the main EU (2016-2017 average)10.
exporters were Croatia (34%), Spain (33%) and
Slovenia (27%). These countries also accounted
for the bulk of the exports in previous years,
This decline was mainly caused by considerable falls in
when another major exporter was France,
exports from the key EU exporters in 2016 - Croatia and
supplying between 7% and 14% of the exports.
Hungary. In Croatia’s case, the number of animals exported
o Libya: important, but less systematic flows. EU plummeted by 89%, between 2015 and 2016, whereas
exports increased from 24,000 in 2012 to 53,000 Hungarian exports went down by 44% in the same period.
in 2017, despite some annual fluctuations. Both Croatian and Hungarian exports accounted for 37% of
The main EU exporter was Spain (from 50% in the total extra-EU trade of live pigs (2016-2017 average),
2014 to 97% in 2017). In previous years, other compared to a 62% share in 2014-2015. Other major
major exporters were France (up to 12-14% in exporters of pigs to non-EU countries include Greece and
2014-2015), Ireland (20-30% in 2013-2014) and Germany. The top four exporters accounted for 85% of total
Croatia (19% and 16% respectively in 2012 and extra-EU exports (2016-2017 average).
2013).
Albania and Serbia received 72% of total extra-EU exports
o Turkey: flows are not systematic. In 2012
(2016-2017 average), while in 2014-2015 Serbia alone
nearly 130,000 animals were exported from
accounted for 54% of extra-EU exports. Indeed, exports to
the EU, mainly from France (64%), Hungary
Serbia saw a decline of 58% between 2015 and 2016, with
(27%) and Slovakia (8%). Exports during 2013-
significantly fewer animals exported, notably by Croatia
2015 dropped to minor levels, and started
and, to a lesser extent, Hungary. Albanian imports, on the
peaking in 2016 to reach nearly 68,000
other hand, gradually rose, with the vast majority of animals
animals in 2017. The main EU exporters
imported from Greece.
in 2017 were Spain (47%), followed by
Hungary and Croatia (15% each), Bulgaria
1.2.3 The extra-EU trade of sheep/goats (2014-2017)
(9%), Romania (6%) and Czech Republic (5%).
In summary:
Major exporters: Romania, Spain
Major destinations: Libya, Jordan, Israel,
Lebanon
Live sheep/goats extra-EU trade increased by 17%
over the period 2014-2017, to approximately 2.5
million animals11
The growth was driven mainly by continuous increases
in exports of the key EU exporters, such as Romania and
10
See footnote 6.
A strategy to reduce and replace live animal transport 14Spain. These two countries accounted for 94% of total extra- notable destination for EU sheep/goats is Lebanon with a
EU exports (2016-2017 average), although their share has relatively stable trend, although there was a slight drop from
slightly dropped by 2% in comparison to the previous years 7% in 2014-2015 to 4% in 2016-2017.
(2014-2015 average).
Extra-EU live exports of sheep/goats is characterized by
Libya and Jordan are the most prominent third country frequent fluctuations in the numbers of animals, although the
destinations by far for EU sheep/goats exports, accounting two major destinations, Libya and Jordan, have maintained
for 83% of the total extra-EU exports (2016-2017 average). their strong positions. Export trade from Romania to Jordan
The EU exports to these countries declined by 9% as exports is the most prominent route in terms of absolute numbers
to Israel registered considerable growth in 2016; as the despite the fluctuations, ranging from 550,000 to 1.1 million
third major non-EU destination, Israel accounted for 8% of animals. Other flows, such as Romania to Libya and Spain to
the total extra-EU exports in 2016-2017 (average). Another Libya, saw continuous growth, especially during 2015-2017.
Conclusions
This introductory chapter has shown Netherlands, with the main importers the EU are sold mainly to Turkey, Israel,
that there has been growth in the being Germany and Poland. For Lebanon and Libya. The main Member
intra-EU trade in live cattle, pig and sheep/goats, the main exporters are States exporting live pigs are Croatia,
sheep/goats over the period 2014- Romania, Hungary, France and Spain, Hungary, Greece and Germany, with
2017. Analysis of TRACES data shows with the main importers being Italy, the main destinations being Albania
a substantial increase in long distance Greece and Spain. and Serbia. The main Member
live animal transport within the EU States exporting live sheep/goats are
between 2005 and 2015, partly as The EU also exports live animals Romania and Spain, with the main
a result of the accession of new to non-EU countries. The largest destinations being Libya, Jordan, Israel
Member States. number of live exports are sheep/ and Lebanon. Analysis of TRACES data
goats (2.3 million animals) with a shows that the majority of live exports
The main exporters of cattle within further 0.8 million cattle and 0.3 outside the EU (in terms of number of
the EU are France, Germany and million pigs exported alive (average consignments) are of cattle, and that
the Netherlands, with the main 2016-2017). For live cattle, the the number of consignments of cattle
importing Member States being Italy, main exporting Member States are exported alive increased substantially
the Netherlands and Spain. The main Germany, France, Austria, Hungary between 2005 and 2015.
exporters of pigs are Denmark and the and Czech Republic. Live cattle from
11
See footnote 8.
Towards a meat and carcasses only trade 15A strategy to reduce and replace live animal transport 16
2 What is driving live animal transport?
This chapter investigates the main driving forces behind                                        consolidation of slaughter facilities throughout the
the transport of live animals across the EU and from the                                        EU (see section 2.2). The country of origin labelling
EU to third countries. The issues taken into account range                                      rules, as adopted in 2013 for fresh (unprocessed)
from supply and demand considerations, and policy as                                            meat of pigs, sheep and goats (ref. leg. 1337/2013)
well as regulatory aspects. As the configuration of the                                         with application from 1 April 201513 (see section 2.3)
slaughter sector has a major impact on the transport of                                         could also be a driver. Country of origin labelling in the
live animals for slaughter purposes, section 2.2 will look                                      beef sector (ref. leg. 1760/2000) - requiring all three
into that in particular. Case studies will help to explain why                                  production stages to be labelled, i.e. born, reared and
slaughterhouse availability is one of the factors leading to                                    slaughtered - has been in place for some time.
the transport of live animals over long distances (more than
                                                                                            • Policy aspects: The Common Agricultural Policy
8h).
                                                                                                (CAP) has also had an impact on live trade by driving
                                                                                                increasing specialisation in fattening/breeding
2.1. The driving forces behind live animal trade
                                                                                                regions. For example, the EU veal and young cattle
Currently, animals are transported alive for breeding/                                          meat marketing standards of 2007 are reported to
fattening purposes or for immediate slaughter. Against                                          have led to specialisation in this segment (EC, 2014):
a background of animal welfare issues and systematic                                            the offspring of dairy cows, mainly bull calves but also
violations to the EU transport rules, live animal transport is                                  females, are exported from the main milk producing
still increasing both within and from the EU to third countries.                                Member States to countries that make use of these
A clear understanding of the driving forces behind the trade                                    calves such as the Netherlands, France, Italy (white
of live animals is key to putting forward a strategy to replace                                 and rosé veal meat,) and Spain (young cattle). The
live transport with a meat and carcasses-only trade.                                            reform of the EU dairy policy with the abolition of
                                                                                                the milk quota system (April 2015) resulted in the
The driving forces behind this trade include:                                                   slaughter of some dairy cows, some of which involved
   • Supply considerations: cost, as determined by level                                        live transport to appropriate slaughter facilities with
      of specialisation; access to raw materials (in particular                                 sufficient capacity. The reform also led to further
      feed costs); availability of slaughterhouse facilities;                                   consolidation of production in regions specialising
      cost differentials between slaughterhouses (which                                         in dairy (for example the Netherlands and northern
      are determined by scale of production, level of                                           EU, except Scandinavia), and consequent shifts from
      automation, labour costs); overall supply balance and                                     dairy to beef production in non-milk specialist regions
      self-sufficiency.                                                                         of Europe, such as the southern European countries,
                                                                                                Scandinavia and eastern Europe (JRC-IPTS, 2009).
       • Demand considerations: consumer preferences,
                                                                                                The combined effect of these policies has altered the
           including for specific types of meat/cuts and quality/
                                                                                                supply and demand balance in relation to specialist
           freshness; the country of origin of meat; ritual
                                                                                                breeding/rearing regions and regions with large-scale
           (religious) slaughter; in third countries, availability of
                                                                                                slaughter facilities, which leads to an increase in live
           cold storage.
                                                                                                transport.
       • Regulatory aspects: The high requirements set
                                                                                        Ultimately, a combination of driving forces has led to each
           by the EU Hygiene Package12 are reported to
                                                                                        live trade flow.
           have contributed, along with other factors, to the

12
      https://ec.europa.eu/food/safety/biosafety/food_hygiene/legislation_en
13
      The rules implement the requirement to indicate the ‘country of origin or place of provenance’ of fresh meat, pursuant to Article 26 of the Food Information
     for Consumers Regulation 1169/2011. For the definition of ‘country of origin’, Regulation (EU) No 1169/2011 refers to Articles 23 to 26 of Regulation (EEC) No
     2913/92 (Common Customs Code). Article 23 of this Regulation defines ‘country of origin’ as the country where live animals were born and raised. However,
     according to Article 24 of Regulation (EEC) No 2913/92 and Article 39 and Annex 11 of Commission Regulation (EC) No 2454/93, when more than one country
     is involved, the country of origin is the country where live pigs, sheep and goats were raised for two months before slaughter. Where this cannot be respected,
     the meat shall be deemed to originate in the country where the animals were reared for the longest period. 'Country' in the meaning of this Regulation is an
     individual EU Member State, the EU as a whole or a third country.

                                                               Towards a meat and carcasses only trade 17
The supply and demand considerations above also apply and specialisation, also by species, to achieve cost-cutting
as drivers of live EU exports to non-EU countries. Among and increase efficiency is key for these groups to maintain
these, key drivers are insufficient cold chain capacities14 - competitiveness.
particularly in less developed countries that are currently
major destinations for EU exports in live animals - as well The consolidation trend is particularly marked in the pig
as logistics infrastructure (road network and ports) more sector. The EU is the world’s second biggest producer of pork
generally, all of which constrains the trade in meat and after China, and also the largest world exporter. Germany,
carcasses. Other important factors include increasing Spain and France account for half of the EU’s total slaughter
specialisation of production and separation into breeding of pigs per year. The investment, as well as the mergers, made
and fattening enterprises, consolidation in the slaughter during the last ten years (2000 to 2010) have led to the creation
sector, and environmental rules on manure production. of large groups of slaughterhouses, usually multi-species, that
operate in different countries and often include processing
2.2. The EU slaughter sector
activities. The EU is currently slaughtering around 250 million
There is agreement with the actors of the food chain that pigs per year. During 2018, 38 slaughterhouse groups were
slaughterhouse location has a major impact on the intra-EU identified, with a throughput of over one million animals per
transport of live animals. year each, representing 52% of total pig slaughter in the EU.
Of these, the largest 13 abbatoirs are situated in only seven
There are no systematic data on the number and structure Member States and account for 38% of the EU total.
of slaughterhouses across the EU, but it is clear that the
EU slaughter sector has been and continues to undergo a Competition between the top companies has intensified in
process of consolidation, with a trend towards fewer and the last decade. In 2009, within the ranking of the largest
larger slaughterhouses over time. This has been driven by slaughterhouse groups, the Dutch company Vion was in first
the need to capture economies of scale, as slaughterhouses place (20.2 million pigs slaughtered per year), followed by
operate on small margins and high throughput. the company Danish Crown (18.8 million) and the German
company Tönnies Fleisch (13.9 million). Within this ranking
The trend has been continuous over the last four decades, there were also four Spanish groups (Campofrío, El Pozo,
but it has accelerated further over the last decade since Jorge SA and Grupo Vall Companys). This ranking has changed
the entry into force of the EU Hygiene Package in January in recent years. Danish Crown has reached first place recently,
2006. This imposed strict requirements that many small after acquisition of the German company D&S Fleisch. Tönnies
slaughterhouses found it difficult to meet. is close behind, with continuous expansion in Germany and
recent strategic acquisitions in France and Denmark allowing it
While it is more efficient for larger slaughterhouses to meet to reach a total slaughter capacity of 16.6 million pigs in 2017.
these high standards, they inevitably need to source supply
from a wider geographical area to ensure they continue Data on the number and structure of slaughterhouses across
operating close to the full capacity that will enable them to the EU are not available. Although lists of EU approved
achieve economies of scale. All of this has resulted in longer slaughterhouses exist, under Regulation (EC) No 853/2004 on
journey times for live animals. hygiene rules for food of animal origin, these do not provide
information on the size of the facilities, and it is not always
2.2.1. Major developments in the EU slaughter
possible to calculate the total number and capacity of facilities
sector and their impact on live animal transport
performing slaughter activities for the different species. As
The EU slaughter sector has restructured and consolidated both slaughterhouse location and size/capacity are important
into a smaller number of larger scale units. In Member to understand the structure of the sector as a driver of live
States for which some data on the slaughter sector are trade, it has therefore not been possible to map the sector in
available, the significant consolidation that occurred in the all Member States. To address this shortcoming, this report
sector in past decades continues and is indicative of the EU focuses on specific Member States for which some data exist at
trends. At EU level, a few groups control some of the largest national level (see Case Studies).
slaughterhouses on an industrial scale; increases in scale
14
FAO (2011, 2012) indicates that the lack of sufficient and efficient cold chain infrastructure is a major contributor to food losses and waste, estimated at 22%
of meats in the Near East and North Africa region and 25-30% of animal products in sub-Saharan Africa. According to the Postharvest Education Foundation
(PEF, 2013), global food losses are in the order of 25% to 50% of production volumes, caloric content and/or market values depending on the commodity.
According to the World Cold Chain Summit (2018), only about 10% of perishable foods are refrigerated worldwide, while according to a 2018 report by Global
Cold Chain Alliance (GCCA) on Global Cold Storage Capacity, capacity continues to be low in most developing countries.
A strategy to reduce and replace live animal transport 18Case study: Germany
German slaughterhouses account for a major share of total annual EU pig slaughter
volume, an equivalent of almost 58 million pigs slaughtered. Over half (57%) of the national
slaughter volume is carried out in three major slaughterhouses. These slaughterhouses
feature amongst the European ‘giants’ in terms of capacity. The Tönnies pig slaughterhouse
in Rheda (East Westphalia) has an annual output of 1.1 million tonnes. The second major producer
of pork and beef present in Germany is the Vion Group, with several locations in the country: Vion
Emstek in Oldenburger Münsterland, Vion Crailsheim and Vion Landshut in Bavaria among others;
the company slaughtered 8.5 million pigs in 2017. The third biggest company, Westfleisch, has an
annual capacity of 8.3 million pigs. It focuses on North West Germany, with nine production sites
in this region.
Case study: France
Data from national statistical sources (AGRESTE, 2017) indicates a geographical imbalance
of the slaughterhouse sector, marked by a concentration of a large number of the largest-
scale facilities in Brittany*. This region accounts for 40% of the national throughout (across
all species), with the nine largest slaughterhouses in the country having an annual throughput in
excess of 80,000 tonnes each. While this imbalance was already present in France in the 1990s,
during the period 2000-2010 the consolidation of the sector continued, with a 21% reduction in
the number of slaughterhouse facilities. Meanwhile, throughput increased in the largest facilities,
and the average capacity at national level for all species reached 12,000 tonnes.15 As a result,
France remains in an situation of overcapacity, especially in the case of Brittany’s slaughterhouses.
The concentration of slaughterhouses is also high in other regions (with the Loire valley coming
second by far), but facilities tend to be of a smaller scale. The general trend is towards more
specialised facilities, with the share of specialised slaughterhouses across the country particularly
important for pigs - 80% of national tonnage is in specialist facilities. Due to this structure, there
is significant trade within the country in live animals for slaughter, particularly in adult cattle,
which can be classified as long distance according to the methodology followed in this report (i.e.
>300 km). The situation of the French slaughterhouse sector, particularly for pigs, remains fragile
especially because of the cost of raw materials and dependence on foreign markets for the export
sector.
* Brittany’s share of the national slaughter volume is particularly high for pigs (57%), young cattle
(36%) and cattle (21%). Here there are the largest French slaughterhouses for pigs (Cooperl in
Lamballe), cattle (SVA in Vitré) and calves (Tendriade Collet in Châteaubourg). Nearly 40% of adult
cattle slaughtered in Brittany are raised in the region, while for calves this share is 60% (INSEE,
2013). While most of the non-Breton calves come from the two neighbouring regions, the adult
cattle sometimes come from further away, especially for suckler cows. As a result of these flows,
specialized cattle slaughter facilities in Brittany reach a utilisation rate of about 84%, which is
10% more than the best performers in other regions. In addition, more than 13 million pigs were
slaughtered in Brittany in 2013. Of these, 90% are bred in the region. Conversely, 9% of Breton pigs
are slaughtered elsewhere.
15
A 2016 report of the French Parliamentary Commission of inquiry on slaughterhouses, indicates that in 2015, there were 263 slaughterhouses for bovine,
equine, porcine and small ruminants, with a total throughput of 3.51 million tonnes for all these species. 42% of this total (1.46 million tonnes) was in mul-
tispecies slaughterhouses and 2.04 million tonnes (58%) in slaughterhouses specialising in one species. This represented 32 million animals slaughtered in
2015.
Towards a meat and carcasses only trade 19Case study: United Kingdom
There has been a great deal of consolidation in the slaughter/processing sectors. More
than a third of small abattoirs have closed in the past decade, leaving only 63 in England,
down from 96 in 2007. In 1970 there were about 1,900 abattoirs in the UK. According
to the Sustainable Food Trust (2018), the main reasons for the consolidation are high costs and
squeezed profit margins which put pressure on smaller slaughterhouses (despite a relatively
high demand for locally sourced meat). The UK, unlike Ireland, is only approximately 75% self-
sufficient in beef meat and must import approximately 350,000 tonnes of additional beef to
satisfy national demand; Ireland supplies 70% of total British beef imports given its proximity
to the UK market (2018). There is a more diverse range in the scale of sheep abattoirs, with 162
sites in England alone. However, following the significant consolidation trend, more than 75% of
the annual slaughter volumes now pass through just 20 high-throughput sites, owned by a small
number of large businesses (NSA).
Case study: Spain
Spain is one of the two largest pork producers in the EU, with ca. 47 million pigs
slaughtered annually. Pig production is concentrated in the North East of the country.
The top five producers account for 41% of the total national share. The facilities of the
largest pork slaughterhouse company (Vall Companys) are also mainly located in north-western
Spain (this company also handles other species). Jorge, the other notable producer in Spain, has
been expanding, noting growth of 32% in slaughtered tonnes (2016). Many Spanish companies
active in this sector have operations across the pig supply chain, including in some cases cereal
cultivation and feed manufacturing (for example Farmadesa, Piensos Costa). The sector in Spain
is characterized by strong investments being made in slaughter and processing upgrading and
modernisation (including latest automation technologies, for example), especially in the areas
of Catalonia and Aragón as well as emergence of large-scale farms and industrial slaughter/
processing sites, in line with the EU-wide trend. The pig farming sector in Spain has industrialised
very rapidly in recent years, as the number of operations in small-scale size farms plummeted
with simultaneous rapid growth of large-scale operations.
The increasing scale of industrial slaughterhouse facilities in This general evolution and trend in the EU slaughterhouse
some locations across the EU to reach mega-scale proportions, sector seems likely to increase further demand for live animal
such as the facilities controlled by Vion, Tönnies and Danish transport for slaughter. This is contrary to scientific evidence
Crown, inevitably leads to an increased need to procure live recommending to slaughter animals as close as possible to the
animals from a wider geographical radius. Slaughterhouses, place of rearing (OIE, 2009; EFSA 2011).
particularly of this scale and form and applying latest
automation technologies, require significant investment. To This potential impact on live animal trade is likely to be
ensure a return on this investment, and taking also into account supported by other major infrastructure projects, for example
that intense competition results in relatively low profit margins the “Mediterranean corridor”. This project, funded by the
in this sector, they need to operate close to full capacity. In EU, aims to connect the rest of Europe via railway lines to the
the case of Brittany, for example, large-scale slaughterhouses east of Spain, for the transport of goods from all over Europe
have run into problems when operating below full capacity, in to access the main Spanish ports by 2021. This corridor will
conjunction with other factors such as relatively high staff costs connect some of the main animal trading countries in the EU
and competition in export markets. (see routes identified in Chapter 2 Annex I). At the same time,
this corridor could present an opportunity to reverse the trend
A strategy to reduce and replace live animal transport 20if the improved infrastructure is used to expand the transport of indicating all three stages of production (i.e. the countries of
meat and carcasses. birth, rearing and slaughter).
2.3 Country of origin labelling
The evaluation of the stricter origin labelling rules for beef
The analysis of the potential regulatory drivers of live animal (ref. leg. 1760/2000) concluded that the rules had minimal
transport might include the country of origin labelling rules, impacts on trade, which is determined by other factors
as adopted in 2013 for the fresh (unprocessed) meat of pigs, (EC, 2015a). However, this rule, combined with a change
sheep and goats (ref. leg. 1337/2013). The rules require in consumption patterns, as a large number of consumers
the label to indicate the country in which the animal was preferring meat of national, or even local, origin offered
“reared” and “slaughtered”. If animals were born, raised and at the same price as ‘imported’ meat (as all studies show
slaughtered in the same country, then the label can simply that, on average, price remains the main factor driving
state the “origin” country. consumer purchasing decisions), might have an impact on
live transport.
The impact assessment commissioned by the EC (Baltussen
et al., 2013) to inform the introduction of the rules concluded
that the rules would have had a modest impact on intra-
and extra-EU trade, even under the strictest scenario of
Conclusions
The trade in live animals is driven been and continues to undergo geographical area to ensure they
by both supply and demand. Key a process of consolidation with a continue operating close to the full
factors are the structure of livestock trend towards fewer and larger capacity that will enable them to
production in relation to the availability slaughterhouses over time. This achieve economies of scale. This has
of slaughterhouse capacity. Other consolidation has been driven by the resulted in longer journey times for
important factors include increasing need to capture economies of scale, live animals. Regarding live exports
specialisation of production and as slaughterhouses operate on small to non-EU countries, a key factor is
separation into breeding and fattening margins and high throughput. The EU’s insufficient cold chain availability in
enterprises, and consolidation in 2006 Hygiene Package has also been many of the current export markets.
the slaughter sector. There are no a factor in that it tends to be more
systematic data on the number efficient for larger slaughterhouses
and structure of slaughterhouses to meet the required high standards.
across the EU; however, it is clear Larger slaughterhouses inevitably
that the EU slaughter sector has need to source supply from a wider
Towards a meat and carcasses only trade 21A strategy to reduce and replace live animal transport 22
3 Rationale for replacing live trade with the
transport of meat and carcasses; examples
of best practice in effecting this change
This chapter outlines the rationale for a shift from live                            3.2. Why shift to a meat and carcasses only trade?
trade towards a meat and carcasses only trade (sections
3.1 and 3.2) and examines what can be learned from the                               3.2.1 Economic considerations
UK experience of reducing live trade in calves, the de facto
                                                                                     Evidence indicates that transporting meat and carcasses is
ban on live exports for slaughter in New Zealand, and the
                                                                                     more cost-effective than transporting live animals. Impact
development of mobile slaughter units (section 3.3).
                                                                                     assessments focusing on certain species of farm animals
                                                                                     have analysed the feasibility of a trade of meat and carcasses
3.1 Rationale for reducing live trade
                                                                                     only:
Evidence shows that the shift from live trade to a trade in                              • In a 2009 report on the sustainability of transporting
meat and carcasses is justified by animal health and welfare                               pig and horse meat as opposed to live animals
reasons, environmental indicators, economic considerations                                 (Baltussen et al., 2009), it was concluded that:
and existing practices.                                                                   o Transporting meat instead of live pigs and piglets
                                                                                              would lower transportation costs by 29%;
Furthermore, there are new pressures justifying the shift                                 o Transporting meat as opposed to live horses would
from live trade to trade in carcasses and meat: in the last few                               cut transportation costs by about 52%.
years, increasingly prolonged periods of high temperatures
over the summer months have led some Member States to                                    • In 2017 Eurogroup for Animals, together with
the decision to suspend live trade. In 2019 during the AGRI                                  Dierenbescherming,       Dyrenesbeskyttelse,    GAIA,
Fish council (15th May) the EC urged Member States not to                                    RSPCA, and Vier Pfoten, commissioned Wageningen
allow long-distance live animal transport when temperatures                                  University to assess the costs of transporting live
of 30 degrees Celsius were forecast. Several Member States                                   lambs and spent hens versus the costs of transporting
took action, suspending transport during certain days or                                     their meat and carcasses (Baltussen et al., 2017). This
weeks over the summer months (Hungary, United Kingdom                                        study concluded that the transport of live animals
and Czech Republic), or by leaving Competent Authorities the                                 involves higher transportation costs compared to a
responsibility of approving or not any animal consignments                                   meat and carcasses trade. The assessment reported
(the Netherlands, Germany, and Austria)16.                                                   the transport costs would be lower by €0.20 per kg
                                                                                             (in the case of spent hens) and by about €0.34 per
As climate change increases the risk of periods of high                                      kg (in the case of lambs) in transporting meat and
temperatures, it will become increasingly important for                                      carcasses compared to live animals. In addition, live
meat supply chains relying on live transport to develop and                                  transport severely compromises the welfare of the
implement alternative strategies to ensure that supplies are                                 animals transported and increases the risk of animal
not interrupted. If interruptions to the live trade do become                                disease outbreaks. The study also found that some
more frequent, at some point it will become sensible for the                                 animal welfare-related costs cannot be monetised,
supply chain to move away from reliance on this trade in                                     thus potentially under-reporting the costs associated
favour of the greater certainty of the carcass trade.                                        with the transport of live animals.

16
   There are also national plans in place in some Member States to temporarily suspend live transport in extreme weather (both hot and cold). The Netherlands
has had a national plan for additional measures during extreme temperatures since 2016. It includes a ban on livestock transport at temperatures above 35
degrees which was extended to also cover pigs and sheep/goats in March 2017. However, despite this plan, work conducted by the Dutch Society for the Pro-
tection of Animals and Eyes on Animals shows that, in 2017 and 2018, despite the heat protocols during hot periods, there were still serious problems with heat
stress during slaughter pigs transportation. Some tightening up is therefore required to make the National plan for livestock transport at extreme temperatures
legally binding and for better enforcement (Eyes on Animals and Dierenbescherming, 2019). In Germany, several Bavarian Veterinary Offices refused to issue
long-distance animal transport certificates for cattle destined for third countries (Maisack, C., and A. Rabitsch, 2018). This followed the EU Court of Justice (EU
ECJ) judgment in case C-424/13 (2015), and its clarification in relation to Article 14 of the EU Regulation (EC) No 1/2005.

                                                            Towards a meat and carcasses only trade 23
You can also read