A View from the Cockpit: Exploring Pilot Reactions to Attacks on Avionic Systems
←
→
Page content transcription
If your browser does not render page correctly, please read the page content below
A View from the Cockpit: Exploring Pilot Reactions
          to Attacks on Avionic Systems

           Matthew Smith∗ , Martin Strohmeier∗† , Jonathan Harman, Vincent Lenders† and Ivan Martinovic∗
                                    ∗ Departmentof Computer Science, University of Oxford, UK,
                                                       first.last@cs.ox.ac.uk
                               † Cyber-Defence Campus, armasuisse Science + Technology, Switzerland

                                                     first.last@armasuisse.ch

    Abstract—Many wireless communications systems found in                   If these avionic systems malfunction or are not used as
aircraft lack standard security mechanisms, leaving them vulner-         intended, the consequences can be serious. One example is the
able to attack. With affordable software-defined radios readily          case of an inoperative transponder onboard a Delta Airlines
available, a novel threat has emerged which allows a wide range of       aircraft in March 2011, which remained undetected for ten
attackers to easily interfere with wireless avionic systems. Whilst      minutes [14]. During this time it flew in close proximity
these vulnerabilities are known, predicting their ultimate effect is
difficult. A major factor in this effect is how flight crew respond,
                                                                         to three aircraft—a working transponder would have helped
especially whether their extensive training in fault handling helps      avoid these unsafe situations. In extreme cases, equipment
them to manage attacks.                                                  malfunction can cause loss of life. In 2006, two aircraft
                                                                         collided in Brazil partly due to a failing transponder not
     To investigate this we conducted a user study, inviting 30          relaying collision avoidance messages [1].
Airbus A320 type-rated pilots to fly simulator scenarios in
which they were subjected to attacks on their avionics. We use               Similar to many industries with safety-critical components,
wireless attacks on three safety-related systems, based on existing      aviation is currently working on securing its infrastructure
literature: Traffic Collision Avoidance System (TCAS), Ground            against the new threat of cyber attacks. In this process, all
Proximity Warning System (GPWS) and the Instrument Landing               wireless technologies have come under scrutiny, as they almost
System (ILS). To analyze their response, we collected control
input data coupled with closed and open interview responses.
                                                                         in their entirety lack fundamental security mechanisms [49].
                                                                         A subset has been shown to be exploitable under laboratory
    We found that all three attack scenarios created significant         conditions using widely accessible software-defined radios
control impact and disruption through missed approaches, avoid-          (SDRs) and software tools (e.g. [10], [43], [46]).
ance maneuvers and diversions. They further increased workload,
distrust in the affected system, and for each attack, at least a third       Since the publication of these proof-of-concept demonstra-
of our participants switched off the system entirely—even if they        tions, the aviation sector has been discussing the severity and
were important safety systems. All pilots felt the scenarios were        reality of this threat, particularly to safety systems. Recent
useful, with 93.3% feeling that simulator training for wireless          research from the U.S. Department of Homeland Security
attacks could be valuable.                                               indicating remote compromise of a Boeing 757 aircraft was
                                                                         dismissed by the manufacturer, who claimed confidence in the
                       I.   I NTRODUCTION                                security of its aircraft [11]. Several surveys on the perspec-
   Over the past few decades, flying has become ever safer               tives of pilots and other aviation professionals indicate split
culminating in the year 2017, where not a single death was               opinions. Some believe attackers could succeed in creating
recorded for commercial passenger air travel [3]. As a whole,            ‘unsafe flight conditions’—the prominent view, however, is
the aviation industry and regulators have achieved this with             that such attacks are mitigated already through aviation’s
a meticulous focus on safety; for example having stringent               extensive safety systems and culture [2], [48].
requirements on the testing, maintenance and certification of                Unfortunately, security research into avionics, such as
an aircraft.                                                             in [10], [43], [46] and [47], has shown that the threat is
    Two key components of this all-permeating safety mindset             not addressed by safety-oriented design. Instead, this kind of
are pilot training and on board safety systems. Regular training         design deals with random mechanical, electronic, or human
and assessment of pilots using flight simulator scenarios helps          failure, rather than deliberate and targeted attempts to subvert
to prepare them in the safe handling of many flight situations.          the system. As such, an important question is whether attackers
On the other hand, the many wireless technologies onboard an             can induce failures or unintended behavior using wireless
aircraft help to increase situational awareness for pilots and air       attacks, which then go on to negatively impact the safety of
traffic control (ATC) alike.                                             an aircraft.
                                                                             A standard security assessment approach to this faces a
                                                                         number of challenges. Flight hardware is extremely expensive
Network and Distributed Systems Security (NDSS) Symposium 2020           and difficult to use in isolation, making the construction
23-26 February 2020, San Diego, CA, USA
ISBN 1-891562-61-4                                                       of a real-world testbed prohibitive for independent research.
https://dx.doi.org/10.14722/ndss.2020.23022                              Furthermore, the flight crew have ultimate authority over how
www.ndss-symposium.org                                                   an aircraft is flown, so their response to attacks can do anything
from amplifying the effects to mitigating them entirely. Hence, the potential security solutions available [47]. More recently,
understanding ow pilots in the loop manage attacks is a some other systems such as those used to assist landing were
necessary requirement to gauge the true impact of wireless shown to be vulnerable to SDR-based attacks [40]; we discuss
attacks, especially on disruption and safety of the aircraft. this work in more detail in Sec. IV.
To better assess this impact we conducted a user study, Awareness about cyber attacks varies, as demonstrated
simulating three wireless interference attacks in a cockpit envi- in [49]. The authors survey aviation professionals on their
ronment. Our work recruits 30 professional airline pilots to fly perceptions on the security of a range of different avionic
scenarios in a flight simulator during which they are subject to systems. Whilst there is awareness that the systems are not
realistic cyber attacks. Some of our attacks are based on related inherently secure, there does not appear to be significant
work, whilst others are novel and based on analysis of the- concern that attacks could affect operational capability.
oretical vulnerabilities and real-world interference incidents.
We consider three heavily used safety-related systems: the B. Simulator Training
Instrument Landing System (ILS), Traffic Collision Avoidance
System (TCAS) and the Ground Proximity Warning System Time spent in the simulator is a vital part of professional
(GPWS). pilot training. A body of research analyzes the configuration
of simulator scenarios such that they transfer most easily to
Contributions: This paper identifies how pilots respond flying the real aircraft. Early research indicated that it provides
to remote wireless attacks on avionics with the intention of notable benefit over aircraft-only training [24]. However, it is
highlighting systems requiring further attention. Our contribu- not a given that high-fidelity simulations transfer skills well,
tions are as follows: and the literature suggests that well-designed scenarios are
vital in equipping pilots effectively [39], [12].
• We implement realistic wireless attacks on avionics in
a flight simulator for three systems: collision avoid- One of the key factors in cyber attacks is that there may
ance, instrument landing and ground proximity. be no forewarning, leading to surprise and loss of capacity.
• We run experiments with 30 Airbus A320 pilots to In [29], a survey of aviation incident reports highlights that
understand how flight crew respond to these attacks. ‘normal’ events can be surprising to pilots when they occur
out of context, i.e. alerts when the conditions do not warrant it.
• We analyze in-simulator and interview debrief results The authors in [32] and [7] consider this with respect to stall
from the experiments, quantifying attack impact on recovery maneuvers, a regularly tested skill for pilots. Both
the aircraft as well as lessons learned from the study. papers find that pilots struggled to follow even well-known
We begin with background in Sec. II, before outlining our procedures when the stall occurred in unexpected conditions.
threat model in Sec. III. We discuss systems and attacks in Addressing this, the authors of [33] argue that unpre-
Sec. IV, then cover our experimental method in Sec. V. Our dictability and variability in simulator training improves per-
results are presented in Sec. VI, followed by discussion in formance when encountering surprise scenarios. While their
Sec. VII. We discuss lessons learned in Sec. VIII and conclude work uses failure scenarios instead of malicious interference,
in Sec. IX. the arguments remain valid.
II. BACKGROUND C. Simulating Cyber Attacks
Whilst cyber security in aviation is a more recent concern, Some work addressing simulation for cyber security has
investigation into the effectiveness of flight simulators for begun to emerge. In [23] the authors conduct a human factors
training is more developed. In this section we consider the focused study to assess how pilots respond to an attack on
background for both of these areas. ground-based navigation systems. They find that pilots under
attack lose some monitoring capacity, and that warnings can
A. Cyber Security in Aviation help mitigate this. The authors of [6] (and the extended [15])
conduct a more avionics-focused set of attacks, looking at six
Increasing awareness of cyber threats in aviation has variants of navigation and flight management system threats.
spurred early-stage research into attacks and countermeasures. Multiple attacks inserted over the course of one flight with
An early analysis into the vulnerability of the Automatic the intention being to assess if pilots notice the attacks. They
Dependent Surveillance-Broadcast (ADS-B) surveillance sys- found that most attacks were identified during flight, however
tem generated more widespread attention [10]. At the threat some happened without detection.
modelling level, several works assess feasible types of attack.
In [28], the highlighted threats are spoofing, exploiting, denial Our work differs in that we focus specifically on systems
of service and counterfeiting. Our study focuses on spoofing that are either entirely or partly safety-critical with the attacker
and denial of service attacks. In [37], specific threats to avia- instead aiming to cause disruption as a minimum. We also
tion security are enumerated, including possible consequences chose to explore a different set of systems and cover the
of attacks on collision avoidance systems. We directly assess principles of these attacks in technical detail.
some of these effects.
III. T HREAT M ODEL
Furthermore, technical research into the security of sec-
ondary surveillance radar (SSR) systems has assessed the We presume a moderately resourced attacker, able to buy
constraints on an attacker aiming to inject, modify or delete commercially off-the-shelf antennae, amplifiers, and SDRs.
SSR messages [43], and provided a thorough assessment of A high-end set up could cost under $15,000, including a
2Radio altimeter
scientific-level SDR (e.g. the Ettus USRP at around $6000),
announcement in cockpit 500
high-power amplifiers for VHF and UHF (likely to be bespoke
or scientific hardware but approximately $7000 in total) and
pe
eslo
directional VHF and UHF antennas, one for each attack (ap- Glid Reflected Transmitted
proximately $500-$1000 depending on the number required). pulse pulse
For lesser-equipped attackers, a more basic set up could be Runway
achieved for under $3000 by using an SDR such as the HackRF
($300), a commodity amplifier ($1000) and omnidirectional Fig. 1: Normal system operation with radio altimeter deter-
antenna (around $200 for both). This approach does have mining height above ground.
limitations though; it would not have sufficient power to carry
out attacks over long distances, so would be less effective.
We presume that the attackers in this paper have a high-end 1) System Description: Two versions of this system exist—
set up. This would enable them to transmit at sufficient power the original GPWS, and the newer Enhanced GPWS (EGPWS)
to communicate with airborne aircraft. We also presume they which incorporates GPS and a terrain database. The subsystem
have the capability to develop software, or use existing open- used in this study is the same in both. Taking a range of sensor
source tools, to interfere with aircraft systems. Our attacker inputs, GPWS provides alarms of situations leading to collision
can deploy their systems remotely or create a mobile platform with terrain [51]. It has a range of alert modes; we focus on
from which to do this. excessive closure on terrain, or Mode 2 [5]. Mode 2 GPWS
uses a radio altimeter to determine of the height above ground
Threat Actors: We consider three threat actors: ac- level (AGL) and the rate of closure on nearby terrain; one
tivists, terrorists and nation states. Activists intend to cause of the primary uses is on approach to landing. We provide a
disruption to raise the profile of their cause, usually with representation of this on approach in Fig. 1.
low resource but high levels of personnel. On the other hand,
terrorists aim to disrupt or destroy with the intent of creating a 2) Attack Description: Our attacker creates a spurious
chilling effect or fear. They can be moderately resourced and ground proximity alert when the aircraft is close to landing (i.e.
are unlikely to care about collateral damage. Most extreme is on final approach) to negatively impact situational awareness
the nation state who primarily intend to disrupt in order to and cause an unwarranted go-around. As a result, aircraft
paralyze infrastructure. They are well resourced and are likely will then have to perform a second approach or divert to a
to be concerned about attribution and collateral. different airport. During this time, the aircraft will be using
extra fuel, incurring delay and increasing workload for the
Attack Aims: We focus on attempts to cause disruption,
pilots. By transmitting specifically-crafted false radar pulses
rather than destructive impact. This is due to our work looking
on final approach, the attacker causes GPWS to believe that
to the fundamentals of the attacks, in which disruption is
the terrain closure rate is significantly higher than in reality.
likely to be the first effect, though these may have destructive
This will trigger a ‘Terrain Terrain, Pull Up’ alarm, even
variants. This can include diversions to alternative airports,
though the aircraft is close to the ground yet within a ‘safe’
excessive movement away from planned routes or go-arounds,
range. In terms of resource, the timing of this attack is likely
i.e. a missed approach to land followed by a second attempt.
to present the greatest challenge and will need appropriate
Our work intends to identify how crew handle these attacks as
software developed. Hardware requirements are simpler, as it
a base case, which is indicative of the impact they would have
requires the directional transmission of a pulse on a given
under a stronger threat model. As such, we believe that based
frequency; this aspect is similar to a DEF CON 2019 talk
on our results, future work could focus on destructive attacks.
which attacked police speed radars [50]. As such, this attack
We discuss this further in Sec. VII.
can be carried out by lower capability and resourced threats.
Furthermore, we are careful to ensure the experiment is
fair. In scenarios where the aircraft is put at risk of crashing 3) Expected Response: Whilst the response will depend on
it would be unrealistic to assess pilot response outside of their the aircraft and airline, there are common principles [45]. In
normal environment. For example, we could not accurately most conditions we expect a terrain avoidance maneuver on
assess response times if controls are slightly different to a full alarm, i.e. a steep climb to a safe altitude. In our scenario, this
simulator or real aircraft. We cover our experimental setup and will lead to a missed approach. However, below 1000 ft above
its limitations in Sec. V. aerodrome level (AAL), with full certainty of position, crew
can choose to not follow this. Due to the surprise element,
we expect the typical response to be a missed approach. On
IV. S YSTEMS AND ATTACKS
following approaches we expect participants to have identified
We now concisely describe the systems and the attacks unexpected behavior and disregard the warnings.
used in the experiment, including the expected crew responses.
More detailed technical descriptions of the attacks can be 4) Simulator Implementation: We simulate the attack by
found in App. A. triggering the GPWS ‘Terrain, Terrain, Pull Up’ alarm starting
at 500 ft AGL on approach to Runway 33 at Birmingham,
increasing by 250 ft for each subsequent attack. This emulates
A. Ground Proximity Warning System
the ability of an attacker to add some unpredictability to the
A fundamental part of an aircraft’s ‘safety net’, the Ground attack. One of the limitations of this approach is that the point
Proximity Warning System (GPWS) provides early warning of at which the attack actually triggers can vary between 450 ft
the aircraft becoming too close to terrain [5]. and 500 ft AGL, and the radio altimeter display does not show
3affect situational awareness, and cause knock-on alerts for
other aircraft. This may result in diversions or switching TCAS
off. To achieve this, the attacker generates TCAS responses for
a false intruder aircraft, which approaches the object aircraft
until it reaches the alert regions. We refer to the attacked
aircraft as target and the injected aircraft as false. Some of the
technical capabilities required for such an attack can be seen
in [4], wherein the author explores how to trick a target aircraft
to track an attacker-generated aircraft. This is a powerful attack
requiring expensive equipment and the ability to cover a large
geographic area; the threat actor most likely to be capable of
this is a nation state. However, an attack covering a smaller
region could be carried out by a less well-equipped attacker,
e.g. a terrorist group.
3) Expected Response: As following an RA is compulsory,
we expect pilots will comply with at least the first instance,
Fig. 2: Representation of TCAS display to pilots based on the follow the instructed maneuver [44]. From there, we expect
Airbus A320/330 cockpit Navigational Display (ND). some participants to doubt RAs and eventually turn the alert
level down from TA/RA to TA-Only or Standby. On average,
we expect participants to follow 3-4 RAs before reducing the
alert level or switching the system off.
the change caused by the attack on the cockpit display but just
announces the alarm. 4) Simulator Implementation: Within the simulator, we
enact a strong attacker who covers a large geographic area,
B. Traffic Collision Avoidance System attempting to trigger 10 alerts over the course of the flight.
We varied the angle and speed of approach by the false
Although ATC manage airspace with high precision, air-
aircraft. Each participant had the same sequence of false
craft may end up closer than is safe. This loss of separation
aircraft approaching in the same way. False aircraft began
can, in the worst case, result in a mid-air collision. One
to be injected when the target aircraft flew above 2000 ft,
example, mentioned above, occurred in March 2011 where a
after which the first injection began. If the participant chose
Delta aircraft took off with an inactive transponder. This was
to turn the TCAS sensitivity to TA-Only, they would still
the first in a line of errors which resulted in it becoming too
receive TAs but not RAs. This attack was undertaken by using
close to three other aircraft before resolving the issue [14]. If
an invisible aircraft model which travelled towards the target
active, Traffic Collision Avoidance System (TCAS) provides
aircraft. Further work would improve the realism of this, such
a technical means to avoid this, and has been mandated on
as more realistic flight patterns to avoid tipping off participants
aircraft with more than 30 seats since 1993 [17], [25].
to the attack.
1) System Description: TCAS makes use of an aircraft’s
transponders to interrogate nearby aircraft [17]. Analyzing the
responses to these interrogations allows the object aircraft to C. Instrument Landing System
calculate whether those aircraft will become too close [18]. The Instrument Landing System (ILS) allows precision
Based on lateral and vertical proximity to nearby aircraft, landings even in poor weather conditions. Since aircraft must
visual representation and alerts are given to crew similar to follow specific arrival routes into an airport, ILS is an im-
that in Fig. 2. These come in two steps; first is a traffic portant part of managing pilot workload and is the default
advisory (TA), in which the traffic is typically displayed to approach type for most airports. In extreme cases, ILS allows
the pilot as amber and an aural alert of ‘traffic’ is given. If the aircraft to automatically land at sufficiently equipped airfields.
nearby aircraft becomes closer, a resolution advisory (RA) is 1) System Description: ILS consists of two components:
given. An RA will contain specific instructions for the flight localizer (LOC) and glideslope (GS) [21]. A localizer provides
crew, i.e., to climb or descend at a given rate, or hold vertical lateral guidance and alignment, centered on the runway center-
speed. These instructions are decided between the two aircraft line, whereas the GS provides vertical guidance to a touchdown
automatically to deconflict the situation. RA instructions must zone on the runway. Typically, the GS will provide a 3°
be followed within seconds. approach path, though this depends on the specific approach
In the cockpit, crew have control over the alerting level by and airport [41]. It is supplemented by Distance Measuring
selecting Standby, TA-ONLY, or TA/RA. For most of a flight, Equipment (DME), which provides the direct distance to a
TCAS will be set to TA/RA in which full alerting is provided. beacon without directionality.
TA-ONLY does not issue RAs, whereas Standby performs no
Transmission powers of the GS and LOC are 5 W and
TCAS interrogations or conflict resolution [19].
100 W respectively [21]. On the carrier frequencies for the
2) Attack Description: In our scenario, the attacker aims GS and LOC, overlapping 90 Hz and 150 Hz lobes provide
to cause crew responses to TCAS by triggering TAs and RAs guidance with the overlap forming the centerline on the
despite no aircraft being nearby. This is intended to burn approach path. The aircraft uses the relative strength of these
unnecessary fuel, break from air traffic control clearances, lobes to identify where it is with respect to the optimal GS
4Glideslope lobes 90 Hz
150 Hz
Runway
Antenna
(a) Glideslope under normal operation.
Attacker-induced lobes
Attacker Lobes
Real Lobes
Runway
Rogue Antenna Antenna
(b) Glideslope under attack with rogue antenna. Note how the aircraft touch-
down zone is now at the far end of the runway. This means that if the glideslope
is followed to touchdown, there may not be enough runway to slow down.
Fig. 3: Representation of normal and under-attack glideslope
operation, based on diagrams from [21].
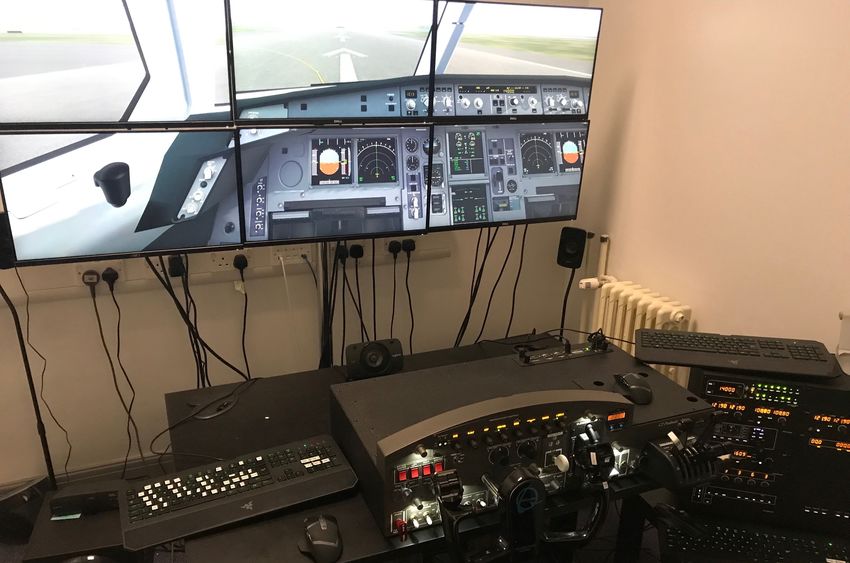
Fig. 4: Picture of experimental setup.
and centerline of the runway. A diagram of a GS can be seen
in Fig. 3a. immediately obvious that it is incorrect. We expect most
GSs and LOCs are monitored for accuracy to at least participants to follow the GS until they are below cloud at
10 nmi beyond the runway, as well as being protected from around 1000 ft, at which point they will notice a continued
interference to 25 nmi [42], [41]. It is important to note that slight discrepancy in AGL according to approach charts. They
‘protection from interference’ here means avoiding systems may also notice such a discrepancy using the PAPIs, as they
using nearby frequencies, rather than malicious interference. will show four white lights. At this point, we expect them to
be between 500–1000 ft AGL and opt for a missed approach
Separately, approach lighting provides an out-of-band and go-around.
check for crew on approach—Precision Approach Path Indi-
cators (PAPIs) are configured to match to the angle of the GS. 4) Simulator Implementation: In the simulator, an attacker
When an aircraft is on the correct GS, the PAPIs will show transmits a false GS at the far end of the runway with an
two red and two white lights; otherwise more red or white effective shift of 2.05 km, or 1.27 miles, creating a difference
lights are shown as appropriate [22]. between the false and true GS of 107 m, or 352 ft. Due to the
way in which ILS is implemented in the simulator software, we
2) Attack Description: Here, the attacker is aiming to cause could not replicate also having a ‘real’ GS. To account for this,
unnecessary missed approaches as a result of a tampered GS, we operated on an assumption that the attacker transmits at a
similar to that in [40]. In turn, this will use additional fuel, higher power than the real GS in an effort to force capture on
introduce delay and potentially force aircraft to divert to a to the false GS. The manipulation remains in place regardless
different airport. A secondary aim might be to force crew to of how many approaches are made. We treat the participant
use a different, also attacked, approach method. aircraft as if it is the first to encounter the attack, with ATC
The attacker replicates the real GS but with the touchdown not observing previous aircraft having difficulties.
zone short or long of the legitimate touchdown zone by
transmitting a replica signals from aside the runway. Since
V. E XPERIMENTAL M ETHOD
they will not be able to station themselves on the runway,
they will operate outside the airfield perimeter. This somewhat Since our attacks were specifically designed to examine
matches the legitimate GS signal which is transmitted aside responses, we wanted to allow participants to react in real
the runway to avoid aircraft clipping the antennae. time. To do this we used a flight simulator, partially recreat-
Crucially the signals would be the same as a real GS, so ing a cockpit environment—in this section, we describe the
would not be identifiable by a high rate of descent, as common experimental setup used. The work was approved by our local
GS issues can be. The difference induced by the attacker would ethics committee with reference number R54139/001.
be subtle. For a typical 3° GS, moving the touchdown zone
1 km along the runway creates a consistent height difference A. Participants
between the real and false GS of approximately 52 m, or 172 ft.
This could fall within a margin of error on approach, especially We recruited 30 pilots who had current Airbus A320 type-
whilst further away from the runway. rating or had held it in the past few years but had since moved
to larger Airbus aircraft. Our sample was recruited through
Such an attack is moderately difficult due to creating the
pilot forums, and open to pilots of any level of experience, First
correct signal and transmitting from an appropriate position.
Officer or Captain. This is appropriate since pilots are trained
We consider all of our threat actors capable of this but the
and kept current with a homogeneous skill set for a given
attack success may depend on the capability and equipment.
type of aircraft. Thus, all pilots are similarly skills-equipped
3) Expected Response: Since this attack will see the false to handle the scenarios we presented to them. Participants were
GS track slightly above the real GS, it is unlikely to be compensated for their time with a gift voucher.
5Sheet 1
Role Trainer?
FO TABLE I: Summary of participant actions and responses to
NA
SFO debrief yes/no questions. For some participants, the question
No
Capt. was not applicable due to previous actions such as landing
Yes
NP regardless of alarm, hence N/A. Percentages are of all partic-
0 2 4 6 8 10 12 ipants, for each question.
Number of Participants
Response
Count5:of Participant
Fig. Role for eachrole
Role.demographics
Colour shows details aboutcrew:
in flight Trainer?.
First Yes No N/A
Officer (FO), Senior FO (SFO) and Captain (Capt.). NP is Attack Question # % # % # %
where participants chose not to provide data. Green bars
indicate a training role, red for those without and grey is ‘not Q5–Trust 1 3.3 25 83.4 4 13.3
GS Q6–Safety 19 63.3 11 36.7 - -
provided’. Q7–Same 28 93.3 2 6.7 - -
Q5–Trust 4 13.3 22 73.4 4 13.3
Sheet3 TCAS Q6–Safety 28 93.3 2 6.7 - -
Rol
e Q7–Same 30 100.0 0 0.0 - -
FO Q5–Trust 0 0.0 12 40.0 18 60.0
GPWS Q6–Safety 14 46.7 16 53.3 - -
SF
O Q7–Same 27 90.0 3 10.0 - -
Ca
pt.
0 2 4 6 8 10 12 14 16 18 20 22 24 26 28 30
The interview assessed the pilot response to each attack,
Tota
lExpe
rie
nce(y
ears
)
focusing on perception of impact, trust, workload and safety.
Aver
a geofTotalEx
pe r
ienc
ef orea
chRol
e .De
tai
l
sar
eshownf
orTot
alE
xpe
rie
nce
.The
Fig.
vi
ewi s6:
fi
l
t e
rPlot
edonRof
ole,participant
whichexcl
ude
sNcommercial
ndNP. flying experience by
onea
This was done with closed questions, but we allowed the
role: First Officer (FO), Senior FO (SFO) and Captain (Capt.). participants to provide additional comments if they wished.
Only data from closed questions were used in our numerical
analysis. Interview questions are outlined in Sec. VI and pro-
vided in full in App. B. We recorded data from the simulator
1) Demographics: We collected demographics from partic- to correlate with interview responses. This included control
ipants with an option not to provide information if desired. In inputs, aircraft position, speed and heading. The details of the
Fig. 5 we show participants by both role and whether they attacks were explained by the experimenter in debrief.
hold a trainer role. We split into the three key crew roles
in order of increasing seniority: First Officer, Senior First We note that our study has some limitations, discussed
Officer and Captain. Furthermore, the colors indicate whether further in Sec. VII. At this point we note two limitations.
the participant trains other pilots as part of their job. First, whilst participants knew that they were taking part in
a study looking at cyber attacks on avionic systems, they did
In Fig. 6 we provide a chart of participant commercial fly- not know about the timing or type of attack. Also, since the
ing experience, grouped by role. Note that captains have a wide interview was conducted by the experimenter, we acknowledge
range of years of flying experience due to the requirements for that this may bias results to be more positive than if we
taking a captain role varying between company and location. had conducted this anonymously. This is mostly relevant to
The median total years of commercial flying experience for a interview questions on the effectiveness of this approach as
Captain was 19, for an SFO was 6 and for an FO was 4.5. training, and we note this where appropriate.
C. Equipment
B. Protocol
Our hardware consisted of two high-end gaming PCs, run-
For the purposes of control, we used the same weather ning X-Plane 11 and an aftermarket Airbus A330 model as no
conditions, traffic, and route for four runs. Pilots were asked reliable A320 models were available, seen in Figure 4 [31]. We
to fly between two international airports, cruising at 12,000 ft, checked the model fidelity with type-rated Airbus A320 pilots
for a total flight time of around 30 minutes. Since the setup to ensure sufficient similarity to an A320. We provided non-
was single-pilot, the experimenter provided support in enabling type-specific hardware controls, since the majority of flying on
modes, pressing buttons or selecting cockpit views for the such an airliner involves manipulating automatic flight, rather
pilot. These actions were done solely at the command of than directly flying with manual controls. Participant opinions
the pilot and the experimenter provided no decision support. on the equipment are presented in Sec. VII-E.
Additionally, the experimenter provided ATC information to
each pilot where relevant, such as approving clearances to VI. R ESULTS
change altitude.
We now discuss the data collected from simulator scenarios
Each pilot was given the first run as a familiarization flight, and participant interviews. Interview response data can be seen
in which they could get used to the controls of the simulator. in Tab. I and Fig. 7, with full data for this figure provided in
The following three runs included some form of attack with App. C. Responses are on the following scales:
each followed by a short debrief interview. At the end of
the third attack and debrief, we asked some questions on the • Q1. Confidence in the response being the correct
study as a whole. We used the same order of attacks for each one, on a scale from 1, very confident, to 5, very
participant. unconfident.
6Q1.
Conf
ide
nce Q2.
Wor
kloa
d Q3.
Trus
t Q4.
Impa
ct
28 5 7 4
eCount
8 8
24 9 5
11 11 16
20
22 4 10
16 13
pons
4 18
12 21 24
19 19
s
8 16
Re
12 13 10 10
4 6 5 8
GS TCAS GPWS GS TCAS GPWS GS TCAS GPWS GS TCAS GPWS
Mor
eConf
. L
essConf
.Si
gni
fi
cantI
ncr
eas
e None Mor
eTr
ust L
essTr
ust Si
gni
fi
cantI
mpa
ct None
1 5 1 3 1 5 1 4
Fig. 7: Stacked bar charts for participant scale responses on Q1–4. Orange represents the most ‘negative’ responses, i.e. no effect,
with blue ‘positive’, i.e. significant effect. Tabular data is provided in Tab. VI.
• Q2. Workload due to the attack, on a scale from 1, TABLE II: Action taken during GPWS attack. If a participant
no increase, to 3, significant increase. lands, they are not included in the numbers of following
• Q3. Trust in systems affect due to the attack, on a approach. Percentages are of participants in that approach.
scale from 1, much more trust, to 5, much distrust.1
• Q4. Impact on the flight due to the attack, on a scale Action Count
from 1, significant impact, to 4, no impact. Approach Action # % # Participants
Land 10 33.3
The Q2 and Q4 scales differed from scoring 1–5 to better 1
Go-around 20 66.7
30
represent their topic. For Q2, we are measuring any increase Turn off 11 55.0
from baseline workload hence the scales are half of those in 2 Land 8 40.0 20
Q1 and Q3. In Q4 we again measured from a baseline of no Go-around 1 5.0
impact but aimed to collect a more granular response coupled 3 Turn off 1 100.0 1
with qualitative answers.
We also recorded yes/no responses for the following: Attack Start Time
3000
• Q5. Whether they would trust systems under attack
later in flight, N/A if they did not respond to the attack. 2500
• Q6. If participants felt the attack put the aircraft in a
Altitude (ft)
less safe situation. 2000
• Q7. If participants would respond the same way in a
1500
real aircraft (i.e. free of simulation restrictions).
Tab. I summarizes the response to these; note that the table 1000
designates some responses to Q5 as not applicable in cases
where actions preclude the question. In the case of GPWS, 500
this is N/A is when the participant switches the system off,
0 Aerodrome Alt.
for TCAS it is when they did not change the system mode
away from TA/RA and for GS it is when a participant landed 0 5 10 15 20 25 30 35 40 45 50 55 60
on the first approach despite the attack. Time (s)
A. GPWS Attack Fig. 8: Plot of time against altitude for first approach under
GPWS attack. Each line is a participant. Eight land and
First, we look at the GPWS scenario. We assess participants disregard the alarm, on account of being sure of their position.
primarily on their actions, i.e. go-around, land with the alarm
sounding or switch GPWS off and land, before considering
their scale responses.
warning in order to land. Vertical profiles for all participants on
Response: Participants generally responded as ex- the first approach are plotted in Fig. 8, with Tab. II, showing
pected, split between those opting for a terrain avoidance participant actions split into landing, aborting the approach
maneuver (thus a missed approach) and those disregarding the (i.e. go-around) and turning the system off. If a participant
1 In this study we consider temporary trust, i.e. trust during the scenario. We lands or turns the system off they ‘complete’ the flight on that
cannot assess longer term trust as we did not carry out repeated simulations approach so are not included in subsequent approaches, e.g.
for each attack, per participant. the 10 pilots who land in approach one are then no longer
7Alert Height Perception: As seen in Tab. I, 14 (46.7%) participants
felt that this attack put the aircraft in a less safe situation. The
numbers are lower compared to other attacks as the response
is in itself a safety maneuver, though some pilots felt that due
250 275 300 325 350 375 400 425 450 475 500 to the extreme nature, the aircraft is at additional risk. This is
Height Above Ground (ft) because the maneuver involves high engine power and a steep
climb, possibly into the vicinity of other aircraft.
Fig. 9: Minimum heights reached by participants opting to go
around in first approach of the GPWS attack. Fig. 7 shows that this scenario has the least impact as
assessed by the participants—even so, it was judged to have
‘some impact’ on average, with 8 (26.7%) saying it was ‘sig-
nificant’. For workload, there was on average ‘some increase’
flying so are not included in approach two statistics. with 13 (43.3%) feeling there was a ‘significant increase’.
Two thirds of participants went around on the first approach These results imply that the attack is much more of a nuisance
as a result of the alarm; these participants remarked that their than a risk; the pilots identify and manage the issue quickly
choice was an automatic one due to procedure. This shows that before it can become more serious but still have to deal with
triggering such an attack can cause arbitrary go-arounds with extra work. On top of this, a number of remarks were made
reasonable chance of success, at least on the first approach.2 about the startle factor involved on what appeared to be a
normal approach. This can significantly impact workload as
In Fig. 9 we plot the minimum altitude reached during the event is far outside the expected set of possible events.
the first approach for those who did not go on to land, i.e.
those who performed a go-around. In this chart, a higher An inevitable consequence of pilots identifying spurious
altitude indicates a faster decision to abort the approach. warnings was that trust in the system was eroded during the
Across participants, we found that the go-around began at scenario. From Tab. I we can see that 12 (40.0%) participants
height x̄: 403.9 ft (s: 51.1 ft). Some outliers in the form of later would not trust the system later in flight, with the other 18
responses do exist, also visible in Fig. 8. Most participants participants expressing their distrust by switching it off (hence
responded within 100 ft of the alarm with an interquartile range N/A). Matching this to Fig. 7, 29 (96.7%) participants felt at
of 29.7 ft. The relatively small interquartile range around 100 ft least ‘some distrust’ towards the system after the attack.
after the attack triggered—with most outliers sitting towards
Generally, confidence in response was very high, with an
higher altitude—shows that the participants are well-drilled in
average score of ‘very confident’. The majority of participants
responding to this alarm. From an attacker’s point of view this
(27, 90%) said they would take the same course of action
lessens the safety impact of the attack as a decision to abort
in a real aircraft. This is likely to be due to terrain alarms
the approach is quickly reached.
being such a high priority—with a high risk if the decision
As indicated earlier, we expected most pilots to follow is wrong—that pilots are trained to quickly respond in a
the terrain warning and execute a well-drilled maneuver, not particular way with minimal scope for choice. Indeed, those
allowing the aircraft to become unsafe due to low altitude. who said that they would behave differently in a real aircraft
However, of the 10 who chose not to go around on the first suggested that they would have opted for a missed approach
approach, seven identified the alarm as spurious and so were rather than landing. In turn, this means that the vast majority
happy to disregard it. Five of these participants felt they could of participants would choose to abort the first approach. To
do this due to good weather, implying that poor visibility some extent, this confidence can be exploited by an attacker.
would push them to abort. Knowing that on balance, pilots are likely to abort a landing if
a terrain alarm is triggered, they can be relatively sure that such
To manage the attack, 11 participants switched the system an attack will at least cause a nuisance in the first instance.
off prior to a second approach, finding the alarm distracting.
An attack causing GPWS to be switched off has the potential Evaluation: The reaction was relatively consistent
for further erosion of safety—indeed, of the 12 who switched seemingly due to strict procedure on how to handle terrain
it off, none said that they would trust the system later in the alarms. We can deduce that:
flight. This is of benefit to the attacker in some situations.
In the case presented as part of our scenario, the terrain was • An attacker has a good chance of triggering an unnec-
broadly flat and some pilots had flown into the airport before. essary missed approaches on the first approach by an
In less familiar circumstances or in challenging terrain (e.g. aircraft, due to startling, temporary workload increase
mountainous), pushing crew into a situation which forces them and prescribed reaction to terrain alarms,
to switch a safety net off could result in unsafe situations. • The attack lacks longevity—pilots quickly identified
However, this is counteracted somewhat by the pilots mostly the alarm as spurious and disabled or ignored it,
feeling that either the system was giving spurious alarms so
• A safety reduction occurs but is limited, only becom-
was distracting anyway. On top of this, most of the participants
ing worse in unfavorable conditions.
who did switch the system off commented that they were
sufficiently sure of their location relative to the terrain that As a result, the attack does not cause a significant reduction
they did not see it as an undue risk. in safety and has short-term disruption potential but is easily
2 In one instance, the attack triggered late; however, in debrief, the partici- managed. Considering that this is the most technically simple
pant noted that they would have taken the same course of action and landed attack, it could be attractive to lower capability threat actors
regardless. seeking disruption alone, such as activists.
8B. TCAS Attack TABLE III: Responses to the TCAS attack scenario, mapping
Next, we consider the TCAS attack. Results indicate that the final selected TCAS mode against actions or maneuvers
this is the most concerning attack to the participants. taken by the pilot. Percentages are of all participants.
Response: An action summary is given in Tab. III. We Final Selected TCAS Mode
provide the ‘end-state’ of the selected TCAS mode (e.g. if TA/RA TA-Only Standby Total
a participant selects TA-Only then Standby, they are under
Standby) against actions taken which fall outside of normal Action # % # % # % # %
flight actions. Actions are categorized into continue on route, Continue
4 13.3 10 33.3 8 26.7 22 73.3
i.e. no extra action taken, avoidance maneuver, in which the on route
Avoidance
participant changes course beyond responding to an RA such maneuver
0 0.0 3 10.0 3 10.0 6 20.0
as changing flight level, or divert to origin, i.e. return to the Divert
departure airport. Some 26 participants (86.7%) turned TCAS 0 0.0 2 6.7 0 0.0 2 6.7
to origin
to TA-Only during flight, with 11 (36.7%) switching it to Total 4 13.3 15 50.0 11 36.7 30 100.0
Standby thus turning the system off. Participants switched
to TA-Only after x̄: 4.5 RAs (s: 1.7), then down to standby
after another x̄: 2.8 TAs (s: 2.1). Two participants went straight
from TA/RA to Standby, one after three RAs, another after These responses are important as even though the false
six. With the exception of one participant, all followed the aircraft generated by the attacker were identified by most
instructions of the RA whilst TCAS was set to TA/RA mode. participants as spurious, they still caused a range of emergency
This meant following collision avoidance maneuvers involving actions. This indicates that the attacker has a significant
steep climbs and descents. amount of influence though this attack.
These actions highlight two problems created by this attack. Perception: Looking to Fig. 7 and Tab. VI, we can
First, the attacker has the opportunity to push the aircraft away see that 27 (90.0%) pilots felt that the attack had at least
from ‘normal’ flight by triggering alerts which cannot be ig- ‘some impact’, with 19 (63.3%) feeling that it had ‘significant
nored. The range of outcomes to these alerts, coupled with the impact’. In comparison to the other attacks, this judged to be
fact that the average pilot complied with over four RAs before the most impactful by far. Coupled with the vast majority of
reducing sensitivity, shows that there is no straightforward participants identifying that the TCAS returns were spurious,
response. This indicates that the attack has a confusion factor. a variety of reasons were provided such as unusual intruder
behavior, frequency of RA or that ATC were not observing the
Next, the attack caused the majority of participants to intruders. Some participants commented that they experience
reduce the sensitivity of TCAS and in some cases, switch it one RA a year at most during their job, so seeing multiple,
off completely. This is a loss of situational awareness which rapid RAs was a sign of unusual activity. A further 29 (96.7%)
could allow unsafe situations to develop later in flight. Many participants felt that there was at least ‘some increase’ in
participants stated that this response was a trade-off between workload, typically due to having to respond to regular RAs
the additional workload of responding to TAs and RAs if the and dealing with periodic distraction. An unduly increased
system is left on against the loss of full use of TCAS if it workload creates further problems for the crew managing the
is switched off. They also felt that the additional workload situation and can lead to errors.
was too great. Furthermore, some participants noted that the
distraction brought about by repeatedly responding to the alerts Considering perceived safety, 28 (93.3%) pilots felt that the
meant they had less time to deal with other aspects of flight. attack put the aircraft in an unsafe—or potentially unsafe—
situation. A variety of reasons were provided by participants
Looking at the control response in more detail, three of with three themes emerging: effect on other aircraft, crew or
those eventually turning the transponder to TA-Only and three passenger injury and distraction (as discussed above). The first
of those turning it to Standby took avoiding action. The action presents a unique risk to this attack. Since responding to TCAS
itself varied per participant but for some involved climbing RAs results in the aircraft making an emergency maneuver, this
above the planned cruise altitude or making horizontal ma- can result in other aircraft nearby losing separation and thus
neuvers to try to avoid the attacker’s false traffic. On top being issued with TCAS alerts. This might cause the attack
of being unpleasant for passengers, this increases the risk of to trigger a chain of alerts, disrupting every aircraft involved.
incursion into the path of other aircraft; particularly dangerous In this situation, the outcome becomes less predictable since
when TCAS is apparently malfunctioning. Furthermore, two multiple aircraft are involved, each reacting in their own way.
participants diverted back to the origin airport rather than The other cause for concern was for those onboard who
continue with malfunctioning TCAS, which would incur sig- might be moving about the cabin, thus injured in an extreme
nificant costs (discussed in Sec. VII). Three of the remaining maneuver such as an RA. This is especially true of RAs
participants felt that TCAS was providing spurious returns but triggered at higher altitudes where passengers and cabin crew
felt the risk of downgrading the system to TA only was too may not be sat down with seatbelts on.
high and instead opted to follow the RAs as issued. Such a
response would lead to an uncomfortable flight, excessive fuel Similarly, 29 (96.7%) participants felt they had at least
use from repeated climbing and the possibility of becoming too ‘some distrust’ in TCAS during the scenario. Again, this is
close to other aircraft. The final participant was not aware of problematic as it indicates that an attacker with moderate
the ability to go to TA-Only in the simulator and so remained ability can sow distrust in critical aircraft safety systems during
in TA/RA. flight. One participant described this as a “crying wolf” effect,
9wherein TCAS was being triggered so often that they might
start to disbelieve it even though they cannot refuse to act.
Evaluation: In this scenario, the most common option
was to reduce the alerting level of TCAS to either only notify 400 500 600 700 800 900 1000 1100 1200
of traffic (TA-Only) or to switch the system off. We also
Height above ground (ft)
identified some common outcomes:
(a) Height above ground level at point of first go-around.
• Repeated, unexpected alarms cause pilots to make a
choice: deal with the disruption and distraction, or turn
the system off and possibly lose the safety benefit,
• Time taken to identify the attack was longer than the
other attacks, indicating a confusion factor,
0.0 0.2 0.4 0.6 0.8 1.0 1.2 1.4 1.6 1.8 2.0 2.2 2.4
• No prevailing way to handle the attack emerged, with Distance to touchdown (miles)
pilots split between a range of actions.
(b) Distance from runway touchdown zone at first go-around.
Although this attack is the most difficult to carry out, our
Fig. 10: Box plots of participants performing a go-around on
results suggest that it has the greatest impact on the crew,
the first approach under the glideslope attack.
aircraft, surrounding traffic and the passengers.
C. Glideslope Spoof
The final attack is the glideslope spoof, where an attacker Fig. 10a and 10b show box plots for the height above
aims to capture a pilot on a false GS and cause missed ground level (in feet) and distance (in miles) from the runway
approaches. We focus on the first approach, in which the touchdown zone, respectively, for when participants opted to
participants knew least about the attack; our results also abort the first approach. These charts demonstrate the wide
indicate that most pilots identify a problem on this approach. range of ‘abort points’ observed during the attack, indicating
flight crew confusion or startle caused by the false GS. Many
Response: On encountering the attack, 4 (13.3%) par- participants noted that it was hard to identify the issue quickly
ticipants chose to land anyway on account of having a good as initially, everything seemed fine; it was only as the approach
visual picture. This means that they identified a problem—that continued and the PAPIs became visible that the problem was
the aircraft was too high compared to the real glideslope—but more obvious.
felt that weather conditions and terrain were good enough to
correct course and land anyway. Of the 26 (86.7%) participants Looking to the average case of the go-around for the 26
choosing to abort the first approach, three aborted their second pilots aborting their first approach, altitude was at x̄: 930.0
approach too but landed on their third. Participants aborting ft (s: 235.8 ft), for distance to touchdown at the abort point
approaches identified a problem but felt they needed to go x̄: 1.1 miles (s: 0.7 miles). Since preparation for a go-around
around either to use a different type of approach or to allow takes a few seconds, the average case abort decision takes
more time to diagnose the issue. The choices for subsequent place slightly before the above altitude and distance, i.e. just
approaches were as follows: as participants descended below 1000 ft.
• 1 (3.3%) used a VHF Omnidirectional Range ap- Considering that a 3° GS has a rate of descent of 700 ft/min,
proach, this means the go-around begins with just over a minute to
touchdown. In poor weather, this might be the first time the
• 2 (6.7%) used a Surveillance Radar Approach (SRA), pilots see the runway with only a short amount of time to abort
which relies on higher involvement with ATC, the approach. That the attack is subtle enough for the aircraft
• 8 (26.7%) flew a localizer only approach (LOC DME) to get so close to landing demonstrates how difficult it is to
on account of identifying GS problems, clearly identify that an ILS attack is under way. In this case,
• 9 (30.0%) avoided ILS completely, and used an Area forcing a late go-around would inevitably impinge on safety.
Navigation (RNAV) approach, which is based on GPS, Perception: As shown in Fig. 7, 13 (43.3%) participants
• 6 (20.0%) flew a visual approach (i.e. no landing aids) found the attack had ‘some’ impact or greater; less than the
due to good conditions. TCAS attack but judged more significant than the GPWS
attack. This appears to be due to the attack being relatively easy
This split highlights that the attack invokes a response gray to manage once diagnosed—though the diagnosis took some
area and creates unpredictability. Eleven participants chose to time—with some participants noting that faulty glideslopes
forgo ILS completely and use SRA or RNAV approaches as are experienced in practice. Furthermore, a range of routine
they could not identify the issue precisely. However, eight were options exist outside of ILS, unlike TCAS and GPWS.
happy to use LOC DME, relying on the localizer component
of ILS, since they felt that they had identified that just the The GS attack had a small workload increase with 22
GS was affected. Such a range of responses also indicates that (73.3%) participants claiming ‘some’ increase, the lowest
the attack is only likely to be effective for the first or second average score of the three. This may be due to the GS attack
approach as after this most participants avoid the glideslope. developing gradually at a higher altitude with PAPIs providing
Even so, by this point the aircraft has already been disrupted visual reference for correctness, which the other attacks did
through a go-around which will cause delay and use extra fuel. not have. This allows more time for participants to respond, in
10contrast to TCAS or GPWS attacks which trigger alarms and TABLE IV: Summary of attack costs, equipment requirements,
need immediate attention. difficulty and overall impact. H is high, M is medium and L
is low.
Despite this, 19 (63.3%) participants felt that the attack
made the aircraft less safe. A number of participants noted Attack Name
that this attack would be harder to deal with in other situations.
Actor GS TCAS GPWS
In worse weather conditions such as extremely low visibility
they would have fewer reference points against which they Cost M H L
could check the glideslope. This would make it hard to even Equipment M H M
Difficulty M H L
identify that an issue exists until very late in the approach. Disruption/Impact M H L
Some participants also commented that if the glideslope was Safety Effect M H L
short, rather than long, of the runway threshold (i.e. touchdown
was before the runway started), it would be significantly more
dangerous. This is because the approach might look normal TABLE V: Mapping of attacks against threat actors.
until very late at which point the aircraft would be at risk of
landing off the runway. Attack Name
Actor GS TCAS GPWS
Although there was little additional workload, 26 (86.7%) Activists 3 7 3
participants performed at least one go-around as a result of Terrorists 3 7/3 3
being unsure about the approach, instead seeking the safest Nation State 3 3 3
option possible. Here, this involved taking a second approach,
in many cases with a different landing system. Some pilots
noted that low fuel situations would limit the options and VII. D ISCUSSION
possibly only allow one more approach, making the attack
more difficult to manage. We now discuss results across attacks and within wider
contexts such as cost and compared to system faults.
As with TCAS and GPWS, the attack caused ‘some’ dis-
trust in aircraft systems, with 23 (76.7%) participants remark- A. Attack Comparison
ing ‘some’ or ‘significant’ impact. However, some participants In Tab. IV we provide a high-level summary of the costs,
correctly identified that the ground systems were at fault and so equipment requirements and difficulty based on Sec. IV, fol-
did not distrust the aircraft. In this situation, they were able to lowed by the potential for disruption/impact and safety effect
diagnose the issue and ‘cut out’ ILS, thus mitigating the attack. derived directly from participant impact (Q1), and safety (Q6)
As such, attackers would have to consider other vectors if they assessment in Sec VI.3 Using this, we then map the attacks to
wished to guarantee disruption. This is supported by responses threat actors in Tab. V.
to Q5, on trusting the system later. In Tab. I we can see that
of the 26 (86.7%) participants, who did perform a go-around, Whilst all aircraft were handled safely in our experiment,
all but one would not trust the GS on a second approach. there appears to be a meaningful effect on safety from the
TCAS attack, with variants on the GS attack also able to create
Evaluation: Generally, this attack was considered a unsafe situations. Despite participants taking the safest option
nuisance rather than a significant safety issue but did manage in the circumstances, TCAS saw 93.3% participants feel that
to disrupt. Our results indicate that: the attack made the aircraft less safe with GS at 63.3%. For
TCAS, this could be the uncertainty of the situation, with pilots
not expecting false alarms; for GS, the safety concern comes
• Whilst the attack consistently caused first approach from how late the discrepancy is apparent and the situation
disruption, its effect was limited beyond this as par- this leaves the aircraft in. GPWS safety was split with 46.7%
ticipants used other approach methods, feeling that the aircraft was less safe. This is due to the terrain
• The subtlety of the attack and a lack of alarms meant avoidance maneuver being the de facto safe option, making the
that aircraft got close to the runway—within a couple automatic response the safest response. However, the GPWS
of minutes before landing—before they had to abort, attack highlights the interplay of safety and security; even
• After an initial problem diagnosis, the attack was fairly though most pilots took the safe option, they still felt they
easily managed with little excess workload, were compromised by factors out of their control.
• Variants such as poor weather may be much more All three attacks have the potential to cause some degree of
difficult to handle and pose a greater safety risk. disruption, but the level and means vary. Clearly, TCAS has
the greatest potential with the attack causing participants to
Despite the limited effect, the attack can cause short term dis- respond for a longer portion of flight than the others. This
ruption through triggering go-arounds, in turn burning excess is in contrast to GS and GPWS both of which caused an
fuel and increasing delay. However, it is likely that attacking initial disruption but were then quickly managed, with most
consecutive aircraft would see ATC instructing aircraft not to participants landing by their second approach. However, TCAS
use ILS. Whilst a more sophisticated attacker might tamper 3 For example, impact an average impact response of ‘significant impact’
with multiple systems, this significantly increases cost and the is a score of ‘high’. With safety, we base the score on the proportion of
risk of detection. respondents judging there to be a safety impact.
11You can also read