About the Big Bash predictive model - NineSquared
←
→
Page content transcription
If your browser does not render page correctly, please read the page content below

About the Big Bash predictive model
About the Big Bash predictive
model

The predictions made in the paper are based on As the formula demonstrates, Team A is expected to
ratings of each team using the Elo system. Elo rating win almost 99 times out of 100. Each team’s Elo rating
system is used in competitor-versus-competitor is then adjusted after the match based on the
arenas to rank the relative skills of various players / outcome.
teams. Originally, the system was used to rate chess
players. However, in more recent times, the Elo Team Rankings Over Time
rating system has expanded to rate a wide range of By plotting each team’s Elo rating over time, the league
activities such as basketball, American football, contenders, roughies and wooden spooners are able to
world football, rugby league, card games and be seen.
competitive programming.
 At the end of the 2014/15 BBL season, Perth had the
At a high level, a player’s Elo rating is a numeric highest Elo rating making them the favourites to
score which moves up and down based on the repeat. Melbourne Stars, Sydney Sixers and the
results of matches between other rated players. Adelaide Strikers all finished with top 4 Elo ratings. This
These ratings may then be used to predict the group would have been considered league contenders.
outcomes of competitive matches. When the
favourite (the person with the highest score) wins, Hobart Hurricanes and the Melbourne Renegades fall
their Elo rating moves up by a small margin while the into the second category of roughies. These two teams
loser’s Elo rating moves down by a small margin. did not light the league on fire in 2014/15, but
However, when the underdog (the person with the managed to record some decent wins.
lowest score) wins, their Elo rating will increase by a
 Finally, the Sydney Sixers and Brisbane Heat were the
larger margin and vice versa. This phenomenon is
 two bottom team, making them the front runners for
exacerbated the wider the margins in Elo rating.
 the wooden spoon (i.e. last place).
As an example, assume Team A is playing Team B.
 However, player movement has seen a shift in these
Team A is full of star players and has been on a long
 expectations. The Perth Scorchers and Melbourne
win streak. This has led to an Elo rating of 1,500.
 Renegades improved to put themselves in the lead for
Team B, on the other hand, has been struggling and
 premiership contention.
has a below average Elo rating of 750. To determine
the chances of Team A beating Team B in a match, Sydney Sixers, Melbourne Stars and Adelaide Strikers
the following formula is used. remain in the hunt for the top 4, giving themselves an
 outside chance of the premiership.

 10( 400 )
 % =
 Bringing up the rear is the Hobart Hurricanes, Brisbane
 10( 400 ) + 10( 400 ) Heat and the Sydney Thunder. Of these, the Heat and
 1,500 Thunder are front runners for the wooden spoon, with
 10( 400 )
 % = 1,500 750
 a single Elo point separating the teams at the start of
 10( 400 ) + 10(400) the season.
 % = 98.7%
Elo scores - Big Bash League 2011/12 to 2014/15
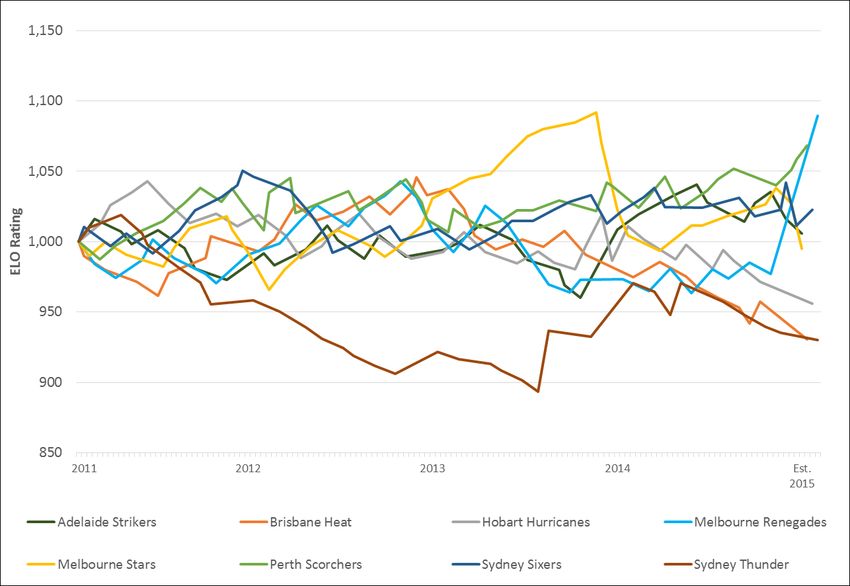
Margin of Victory Duckworth Lewis Method Projecting Team Scores In the RWC, an expected margin of victory was able to A team’s projected score can only be applied to be calculated based on the Elo ratings of each team batting teams with a combination of wickets coming into the match. Comparing the model remaining and overs remaining. If a team has only predictions with the actual outcomes was relatively one resource available it is impossible for them to straight forward as each match is played for the full better their score and, therefore, their recorded time limit. score remains. Match scores excluded from projected score methodology include: However, limited overs cricket differs from traditional sports. During limited over games, a team does not A team being ‘bowled out’ before using its always utilise its full resources (wickets and overs) to full allocation of overs. achieve a result. This occurs under two scenarios: A team with remaining wickets but have fully The team batting second reaches the target used their allocated overs. runs before the allocated overs have been completed If the resulted team is neither of these and has resources remaining at the conclusion of the match, Disruption to play reduces the number of overs the model projects the team’s ‘predicted’ scores by allocated to team/s applying the DWL method in the following way: In the first scenario, the team is announced victors Team Score with the remaining resources noted in the result. This Proj Score = × (100% −DWL Remaining resources%) result does not consider the potential accumulated 100% runs of the innings, rather the margin of victory considers the number of wickets remaining with the The below diagram illustrates this method. more wickets remaining, the larger the victory. For a disruption in play, match adjudicators apply the “Duckworth Lewis” method which was developed by Frank Duckworth and Tony Lewis and successfully trialled by the International Cricket Council (ICC) in 1997. This method takes a holistic approach to a team’s available wickets and overs remaining at any given point in a match and allocates a resource percentage to the match circumstances by setting revised targets. In this analysis, the method has been adapted to 20/20 cricket and applied to both of the above scenarios in the model to determine projected final run totals. Once a team’s score has been projected under the utilisation of full resources, the This adjusted model score is then used in teams can be directly compared. determining the margin of victory multiplier.
Margin of Victory Multiplier The purpose of introducing a margin of victory An adjustment has been made to limit the multiplier is to account for autocorrelation. impact of multi-collinearity by implementing Autocorrelation relates to time series data in which the margin of victory multiplier historical and future values are correlated. An adjustment has been made to each teams Elo ratings already account for the favourites score to account for player movement. A winning more often than they lose. Someone with a portion of the leagues total points were high Elo rating (e.g. Perth Scorchers) gain less from adjusted to reflect recruitment and loss of a victory against an average than someone with a players based on their index scores. Broadly, 3 low Elo rating (e.g. Sydney Thunder). index points equate to 1 Elo point. Given Elo ratings are a 0 sum game, the league average However, not only to better teams win more often, of 1,000 points is maintained after the player they also typically win by larger margins. To account movement adjustment has been made. for this, a margin of victory multiplier is introduced. In essence, the margin of victory is further Based on the approach taken, there are some discounted when the team with a higher rating wins limitations which may impact the results. At a high and increase it when the lower rating team wins. level, these limitations include the following: Model Assumptions The player movement adjustments assume that players play all (or at least a vast majority) An overview of the key assumptions underpinning of matches. It has been the case that big name the Elo ratings and subsequent analysis are players sign with a team, then focus on provided below: international duties and do not play a The Elo ratings for the Big Bash teams have significant amount of BBL games. This is been based on 272 games since the 2011/12 particularly relevant to Chris Gayle due to his season. large contribution to both the improvement in the Melbourne Renegades and the league The k factor used in the analysis has assumed itself. to be 20. As discussed earlier, the k factor determines the importance of more recent matches compared to older matches, with larger k factors relying on more recent matches more strongly. The initial Elo rating for teams entering the competition is 1,000. This is also the rating of the “average” Big Bash team. No home field advantage has been assumed. Over the four seasons, the home team won 48% of the matches and, in no seasons, did the home team, on average, win at a rate significant greater than 50%.
About NineSquared Disclaimer
NineSquared is a specialist economic advisory firm Nine-Squared Pty Ltd (NineSquared) has prepared
supporting companies and governments to make this report taking all reasonable care and diligence
and implement great decisions. We provide required. This report provides high-level analysis
economic, commercial and public policy advisory only and does not purport to be advice on
services that are underpinned by the use of data particular investment options or strategies. In
and evidence, and we develop decision support particular, the analysis and options included in this
tools that are tailored to our clients’ specific presentation based on publicly available
requirements.
 information. We have not independently verified
NineSquared provides clients with economic,
 the information used.
commercial and strategic advice in relation to
transport. Our principals, directors and consultants While NineSquared has used all reasonable
have significant experience in working in, and endeavours to ensure the information in this report
advising clients on, both passenger and freight is as accurate as practicable, NineSquared, its
sectors and across both public and private sectors. contributors, employees, and Directors shall not be
Our experience, expertise and skills cover liable whether in contract, tort (including
economic research and analysis, commercial negligence), equity or on any other basis for any
advisory services and public policy development loss or damage sustained by any person relying on
and analysis. this document whatever the cause of such loss or
 damage.
Contact us This research if for NineSquared clients only. This
 report is not intended to and should not be used
Nine-Squared Pty Ltd or relied upon by anyone else and we accept no
Level 6, 243 Edward Street duty of care to any other person or entity.
Brisbane QLD 4000
GPO Box 21 This research is for NineSquared clients only. Other
Brisbane QLD 4001 Australia than disclosures relating to NineSquared, this
 research is based on publically available
Anthony Vine information at the time of analysis. While
Senior Analyst NineSquared views this information as reliable, we
M. +61 431 283 697 do not represent it as complete or accurate and,
E. avine@ninesquared.com.au therefore, it should not be relied upon as such. We
W. www.ninesquared.com.au have sought to update our research as
 appropriate, but various factors may prevent us
 from doing so. NineSquared does not recommend
 the information in this analysis be used to gamble
 and users do so at their own risk. Any loss is not
 the responsibility of NineSquared.

 Cover Photo used under creative commons
 attribution 2.0 Generic licence – Andrew Blight,
 https://www.flickr.com/photos/ablight
You can also read